


A Questionable Start to 2024 for the S&P 500
Some profit taking and sector rotation may be on the horizon
1. Santa Didn’t Show - What’s Next?
Following yesterday’s note, Santa didn’t show in equity land.
The S&P 500 closed down for the day and during the last 5 trading days of 2023 and the first 2 trading days of 2024 dropped 0.9%.
As a result, we decided to look at additional data of “non-Santa rally” years.
Over the past 70 years, Santa has failed to show 20% of the time.
As shown on the chart below, these years have been consistent with challenging S&P 500 returns over different periods. (Past performance is not indicative of future results).
What’s next?
We will watch for the S&P 500 performance for the month.
On Wall Street, it is often said, “as goes January, so goes the year.” What this means is that similar to the “Santa” period, equity market performance during January often sets the tone for the year.
To a certain extent, we can see this in the data below.
Those years with both negative Santa periods and negative January’s have averaged a return of -3.3% whereas those with a positive January have returned 17.4% on average. (Past performance is not indicative of future results).

2. A Bigger Picture Look at the S&P 500
After the 17% rally from October 27 to December 29, it is not surprising to see the S&P 500 pause and trade down a little.
The questions at this point are how much of a pause will it be and how far will it trade down (if at all).
The answers, in our view, will be based on a combination of Fed policy / outlook; earnings; and sentiment.
From a Fed policy perspective, expectations of a rate cut in March are moving lower. At the end of 2023, a March rate cut had market-based odds of 82%. Those odds were 64% this morning.
2024 S&P 500 earnings expectations are expected to grow 11% to $245 from $220 in 2023 (source: FactSet). While we will go into this in more detail in the the future, our current view is that earnings expectations seem elevated given the inconsistent operating environment.
US earnings season begins next Friday (January 12) when JP Morgan, Citibank and others release their Q4 results. (This is not a recommendation to buy or sell any security). We will be watching management commentary and outlooks closely.
Finally, sentiment, as a contrarian indicator (“buy when others are fearful, sell when others are greedy”) was a valuable equity market tool in 2023.
As we enter 2024, the CNN Fear & Greed index is in the “Extreme Greed” category; the American Association of Independent Investors (“AAII”) Bulls outweigh Bears by 25% (not extreme in our work); and the National Association of Active Investment Managers (“NAAIM”) Exposure Index was at 2-year peak (Chart 3).
Given the steep two-month ascent in the S&P 500 to end the year , we would not be surprised to see at least some pullback. There was a somewhat similar set-up earlier last year after the 21% climb from mid-March to the end of July. The S&P 500 then dropped 10% (a perfect retracement to the 61.8% Fibonacci level) as traders took profits.
While not a prediction, we could envision a scenario where the S&P 500 trades down around 4% towards the 4500 range (2nd highest grey shaded area) as the Index works off some of the elevated expectations and positive sentiment.

Source: Bloomberg. Through year-to-date 2024.
3. Too Many on One Side of the Boat
The National Association of Active Investment Managers (“NAAIM”) Exposure Index represents active asset managers’ average exposure to US equities.
NAAIM exposure closed 2023 at a two-year high of 102.71.
While not predictive, it is notable that the second highest reading over the past two years was July 26, 2023 and preceded a 10% drop in the S&P 500.
Other exposure readings above 80 over the past two years were similarly contrarian when they reversed. (Past performance is not indicative of future results).
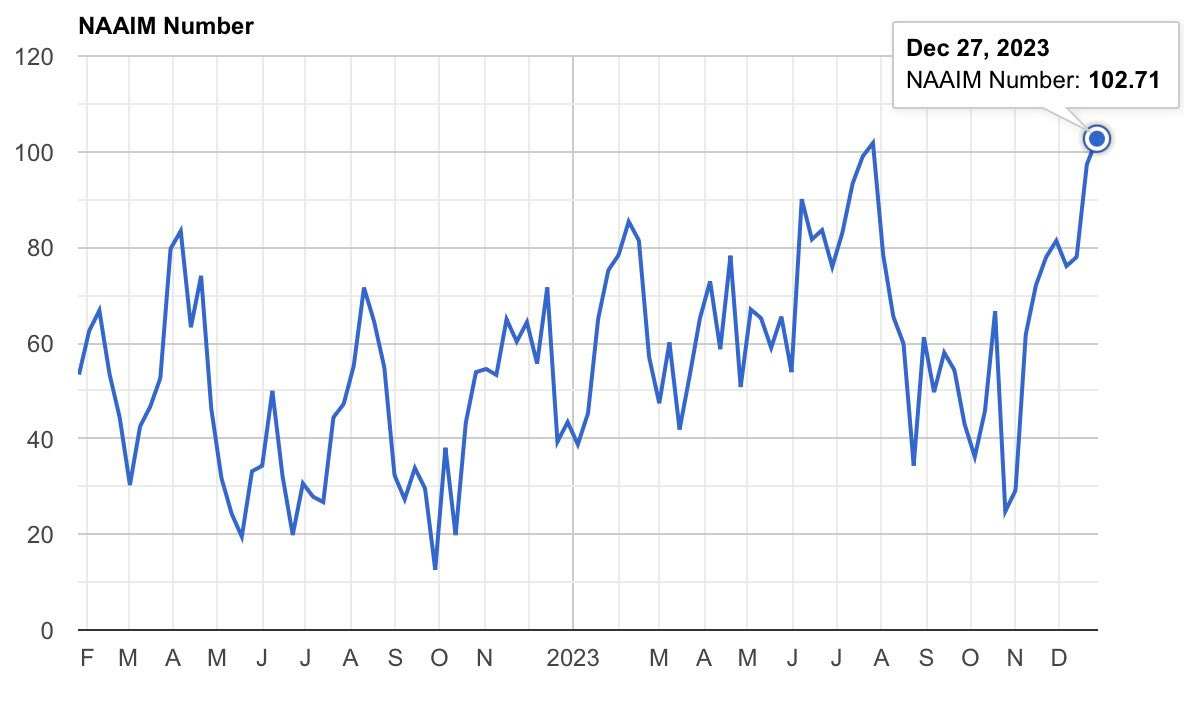
Source: National Association of Active Investment Managers. Through year-end 2023.
4. US Presidential Election Year Seasonality
Over the past two years, the seasonality of US equity markets based on the 4- year Presidential election cycle has been one of the better guides to market direction.
With that in mind, we find it worthy of consideration that the first four months (100 trading days) of Presidential election years (year 4 of the cycle) have been relatively lackluster. (Past performance is not indicative of future results). This is somewhat consistent with the lack of a Santa rally (Chart 1).
It is also notable that the period from April through July has historically been strong while there has typically been a market pause ahead of the election and, similar to other years, a Q4 rally has closed the year.
While our investment process does not rely solely on calendar cycles or sentiment, given elevated valuations, an uncertain policy backdrop and mixed economic signals, our awareness (and respect) of these factors has increased.
Based on the current macro backdrop, we wouldn’t be surprised to see a typical Presidential election year path for the S&P 500 (weak Q1, move higher through July, pause, Q4 rally).
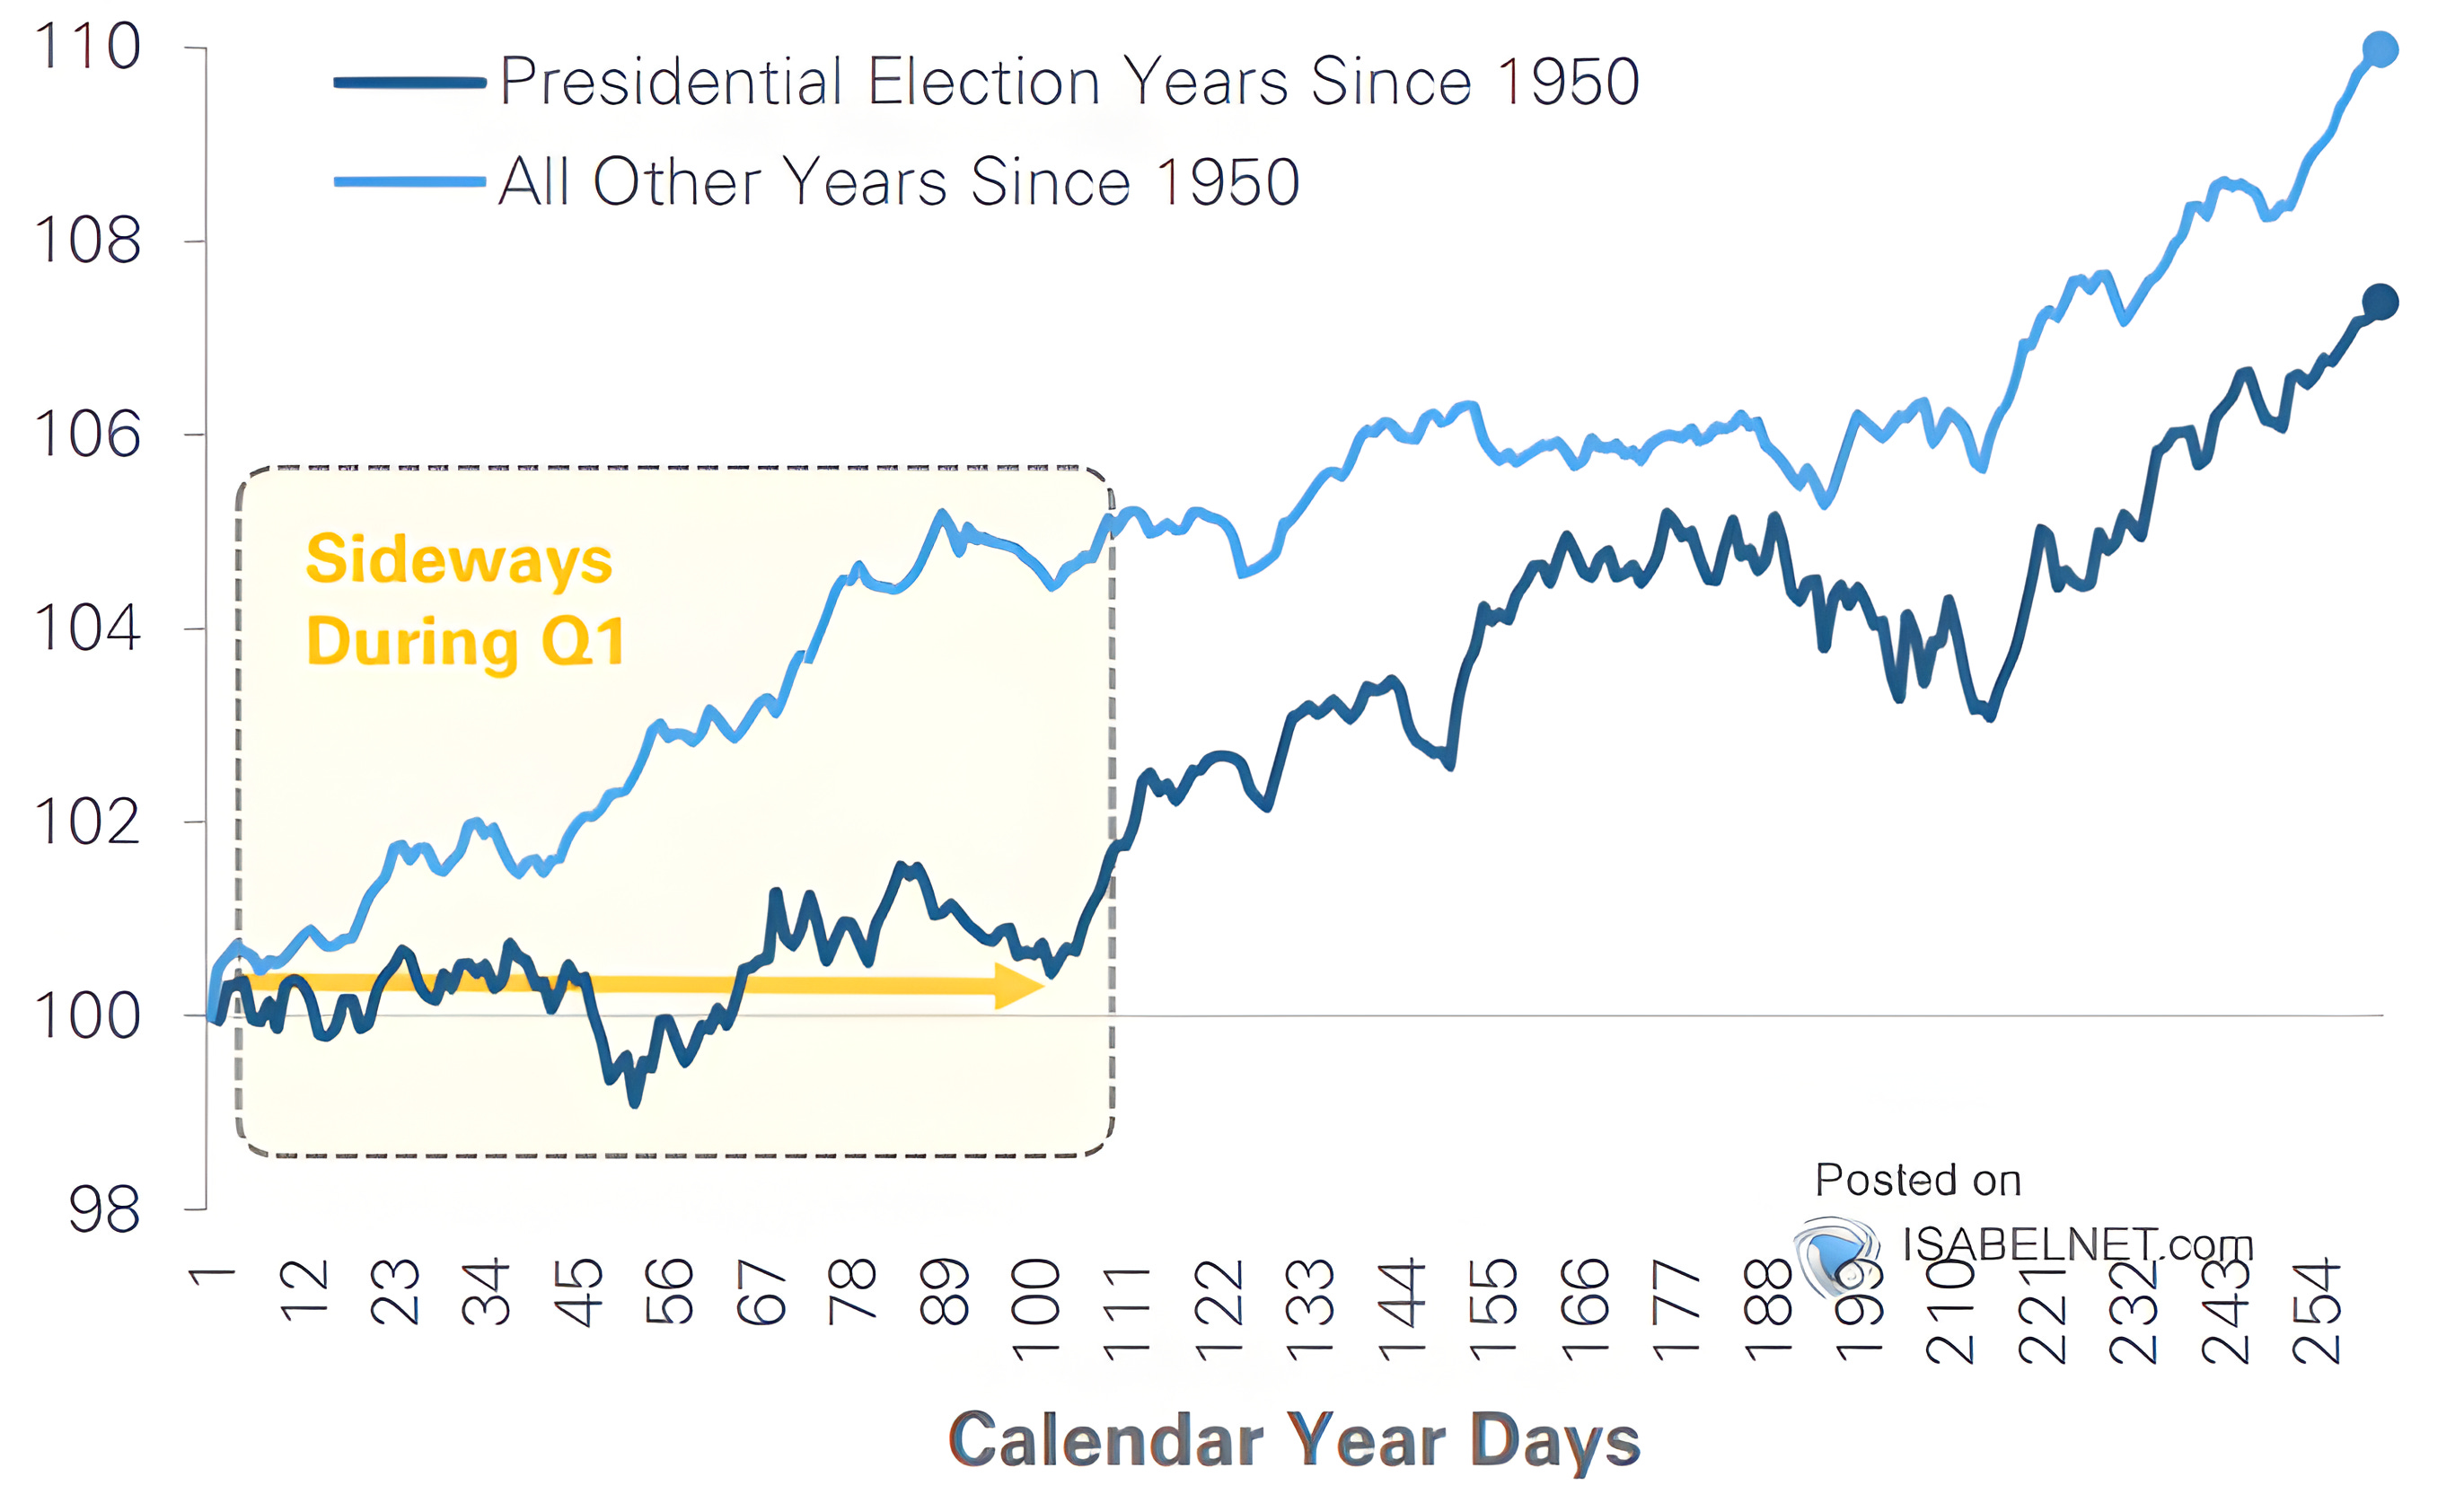
Source: MarketDesk / Isabelnet.com. Through year-to-date 2024.
5. The Opposite of Love is not Hate, but Apathy…Energy
Yesterday, we highlighted the Financial sector as a possible rotation destination for those taking gains in their Magnificent 7 investments.
Today, we wanted to look at the Energy sector.
Many forecasters (ourselves included) were surprised by the 50%+ 2022 peak to 2023 low drop in the price of oil.
While OPEC+ cut production quotas in 2023, US shale producers filled the shortfall and then some. Additionally, Russian oil that was “sanctioned” was able to be sold often for below market prices and provided cheap supply.
Although we are not expecting oil prices to move back to their Ukraine-invasion 2022 peak (WTI at $130 per barrel), we do not see it going much lower from current levels (WTI at $72 / barrel).
Looking at the Energy Sector ETF (ticker: XLE), it is at the level that has represented a relative floor vs. the S&P 500 over the past 18 months.
If there is a rotation to value, Energy may be a sector that benefits.
