Charts and Thoughts to Start 2024
Some Conflicting Signals

Quick Introduction
Before digging in to today’s charts, it’s important to state that many people discount the seasonal trends of markets.
However, over the past two years, the S&P 500 performance has been incredibly typical from a seasonal perspective (over time I will detail this).
During 2023, many forecasters who relied only on economic models, fundamentals (earnings and earnings growth) and valuation missed a great market environment. While those that focused on seasonality, sentiment and momentum were often able to generate attractive returns.
Today, we will focus on some of the seasonal indicators. Over time, we will present as much economic, fundamental and valuation analyses as we believe is relevant.
We want to use every tool at our disposal and try to understand (and present) what we believe are the most significant and timely factors to consider in markets.
1. What if Santa Didn’t Show?
There is a theory (one of many) on Wall Street that the S&P 500 performance during the last 5 trading days of the year and the first 2 trading days of the following year sets the tone for the following 12 months.
This is known as the Santa Claus rally.
The Santa Claus rally becomes particularly relevant when there is no Santa Claus rally (negative performance during the period).
This has only occurred six times in the past 30 years (20% of the time). Depending on the performance in the S&P 500 today, it is at risk of happening again.
As can be seen on the chart below, those years when there is no Santa Claus rally (the period between the last 5 trading days of one year and the first 2 trading days of the next) have been consistent with challenging S&P 500 returns over different periods. (Past performance is not indicative of future results).
When the market does the atypical - we want to listen.

2. Where are we in the Santa Rally?
The Santa Rally was cruising along until yesterday.
The S&P 500 (chart below) closed at 4746 (higher red horizontal line) on December 21 (6 trading days before the close of the year) and basically traded above that level until yesterday morning.
At one point yesterday, the S&P 500 flirted with the north side of the Santa rally line. It fell again.
In the last half hour of trading, the S&P 500 climbed nearly 20 points (0.3%) to make things interesting.
This morning, the S&P 500 has been trading lower.
Over the past 30 years, as shown in the chart above, there were only 6 times (20%) that the Santa rally didn’t materialize. We will see if this is the seventh.

Source: Bloomberg. Through year-to-date 2024.
3. On the Other Hand…
Since 1950, when the S&P 500 has returned greater than 10% during November and December (as it did in 2023), returns during the following year have averaged 19.5% vs. 9.1% average for all years (past performance is not indicative of future results).
As we wrote at the top, there are conflicting signals as we enter 2024 - particularly if the S&P 500 can not recapture the north side of the Santa Rally line.

4. After a Year of Dramatic Outperformance, are the Magnificent 7 Done?
If there was one group of US equities that characterized the strong performance of the markets during 2023, it was the Magnificent 7.
Apple, Amazon, Microsoft, Google, Tesla, Nvidia and Meta (the Magnificent 7) as an index, rallied 107% during 2023, while the Nasdaq 100 appreciated 55%, the S&P 500 was up 26% and the Equal Weight S&P 500 gained 14%. (This is not a recommendation to buy or sell any security).
However, during the fourth quarter equity market rally, the Magnificent 7 underperformed.
Specifically, from the time that 10-Year US Treasury Yields peaked on October 23rd to year-end, the Equal Weight S&P 500 (the average US stock) outperformed the Magnificent 7 by 3%.
We will be watching to see if this is the beginning of a broader trend towards a) smaller cap companies (the Magnificent 7 are all mega-cap) and b) more value oriented shares (the Magnificent 7 are all growth).

Source: Bloomberg. Through year-to-date 2024.
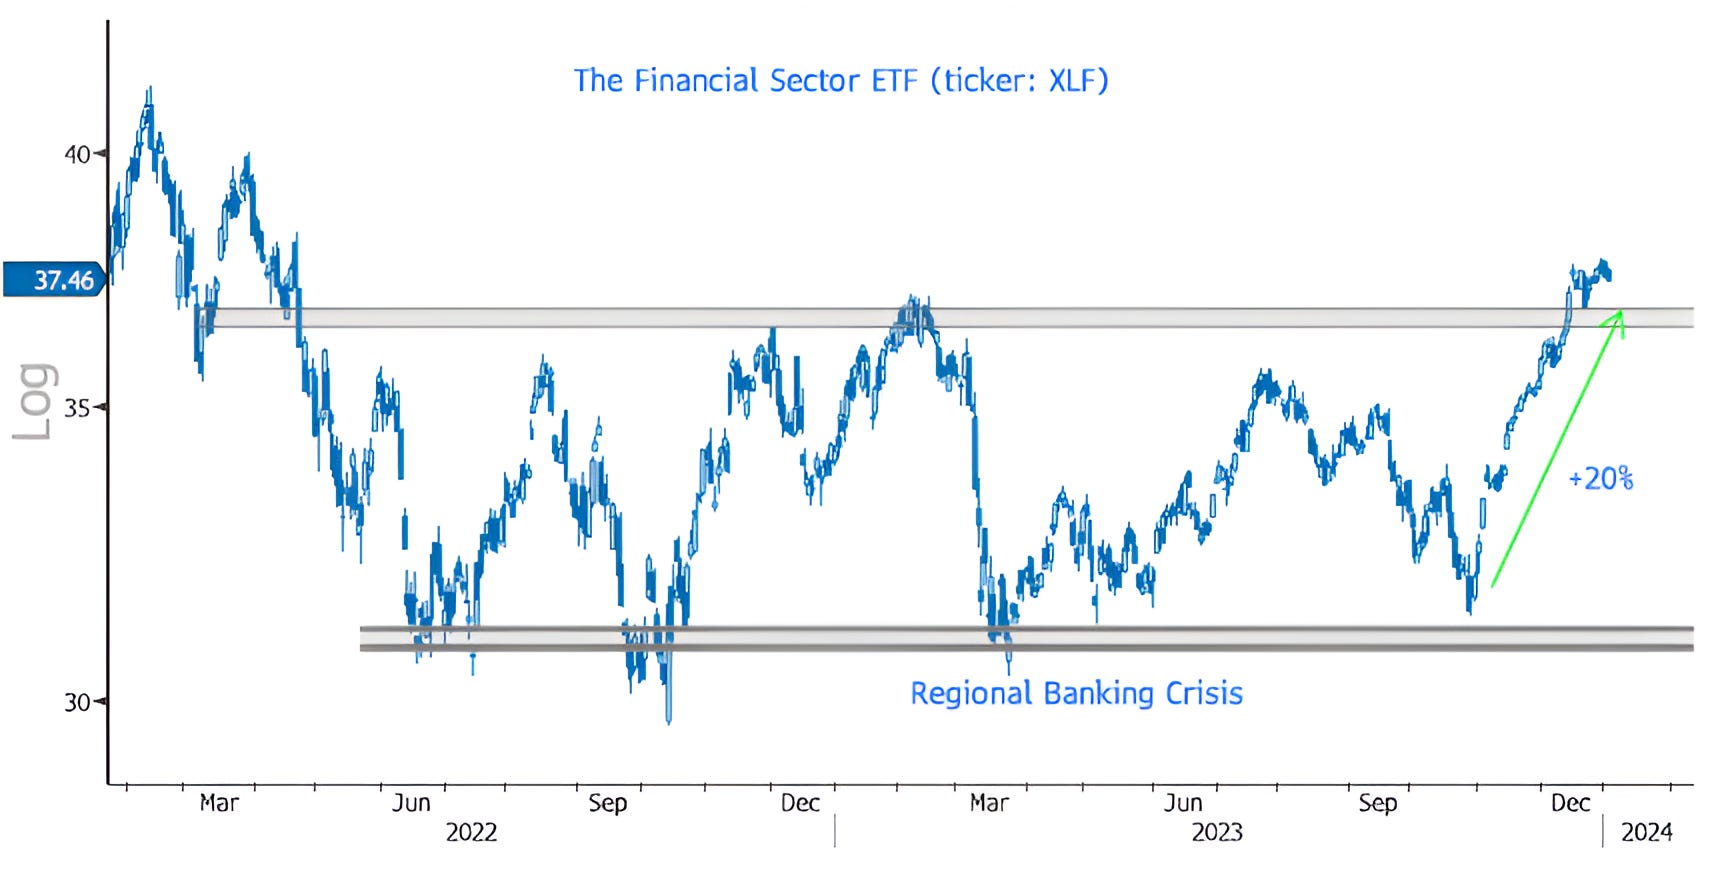
5. One Sector in Particular We are Watching…Financials
After trading in a broad range (between the two grey shaded areas) from April 2022 to December 2023, the Financials were able to rally 20% from mid-October and recapture the north.
2023 was a difficult year for the Financial sector (to say the least) with the 2nd, 3rd and 4th largest US bank failures by assets ever. (First Republic, Silicon Valley Bank and Signature Bank, respectively - the largest bank failure was Washington Mutual in 2008).
Interestingly, however, even during the depths of the crisis, the Financial sector did not revisit its October 2022 low. This is partially because the sector includes insurance companies, asset managers and, more recently, credit card processors. (The Bank Index did hit a new low in March).
The Financial Sector currently trades for 13.8x next 12 months estimated earnings. Although this is above the long-term average (12.6x), it is below the 19.1x forward PE of the S&P 500 overall.
We will watch to see if the Financial Sector can maintain its Q4 momentum.