Considering a More Constructive Scenario
We're keeping an open mind towards equity markets in 2024. While our narrative last week was somewhat cautious, today we highlight more constructive factors and what we're watching to inform our view.
1. Earnings - It’s not about 2024, It’s About 2025
Our overall outlook always begins with fundamentals which we consider to be corporate earnings and earnings growth.
When it comes to fundamentals in equity markets, often expectations are more important than reality.
It no longer matters that earnings grew 1% in 2023 (or at least that is the current expectation prior to Q4 earnings season). Right now, in early January, the focus is on 2024 earnings.
Looking back to the Q4 2023 rally, the drivers, in our view, were likely expectations for 2024 - a combination of economic activity (including the inflation outlook - these drove 10-year Treasury yields), monetary policy and earnings growth.
If there is another Q4 rally this year (in line with our expectations) - what will the drivers be? In our view, they will likely be similar to what they were last year: next year’s expectations for economic activity, monetary policy and earnings growth.
Of those three factors, we likely have the best view on corporate earnings and earnings growth.
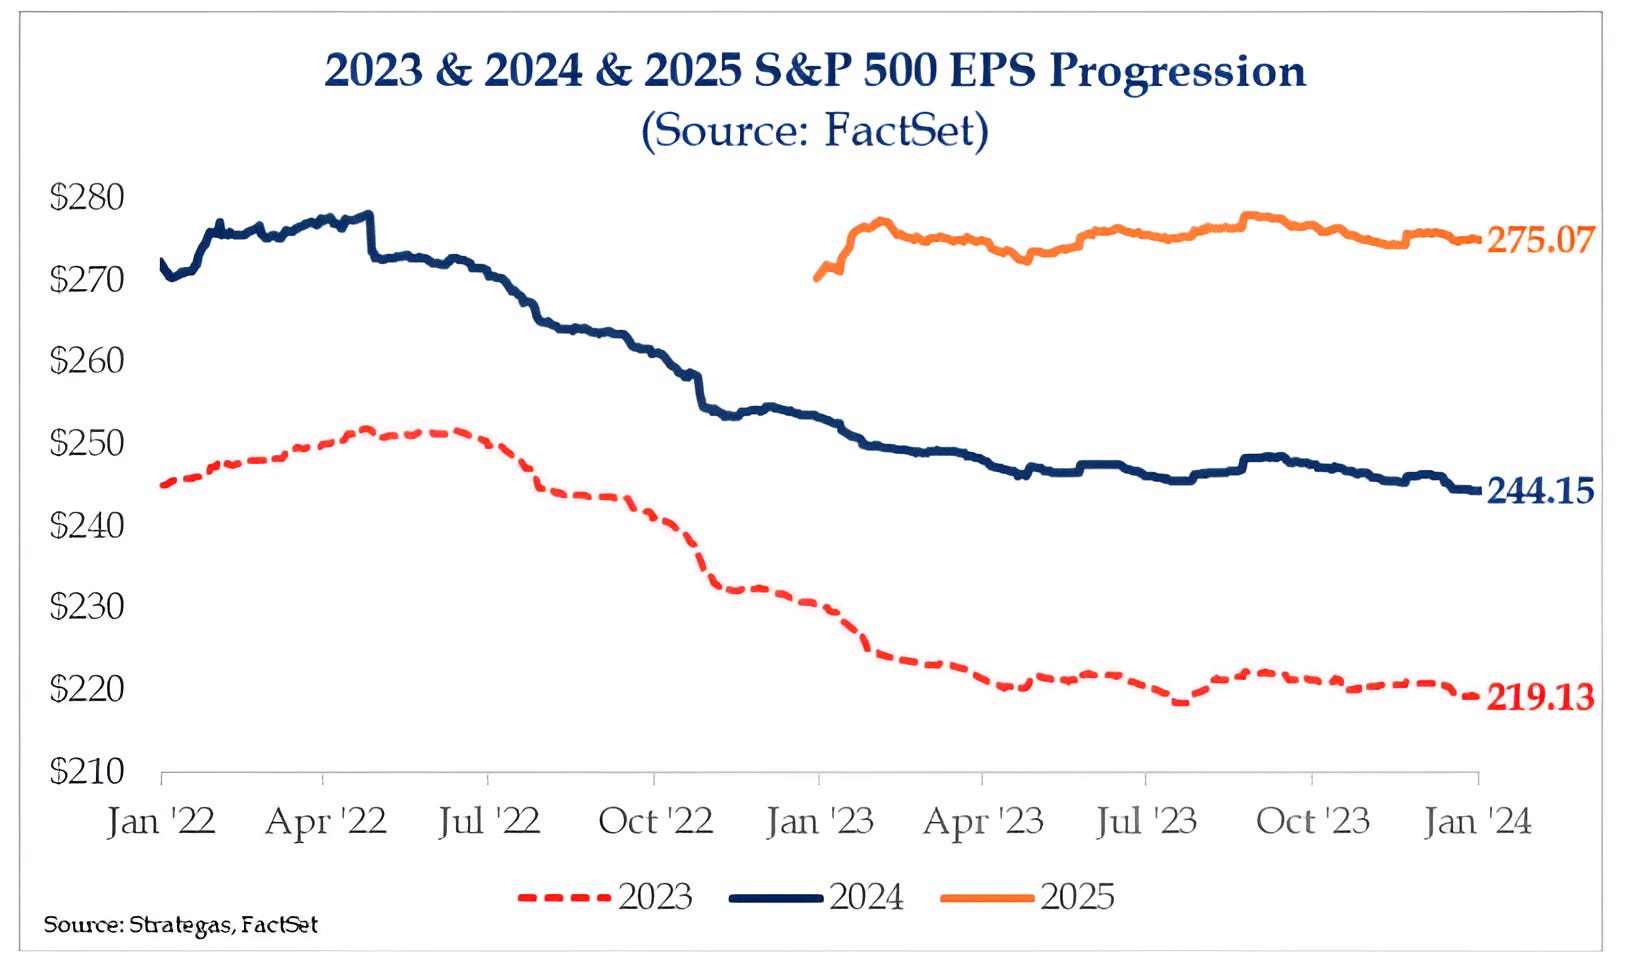
Below is a chart of “bottoms-up” S&P 500 earnings for 2023, 2024 and 2025. (Bottoms-up earnings consider consensus analyst expectations for all 500 companies in the index, weighted and aggregated by each companies share in the index.)
The current expectation for 2025 S&P 500 earnings is $275. Although, we believe that 2025 earnings expectations are likely too high, that may not be overly significant.
What do we mean?
Consider this - we are currently in January 2024 and full year earnings expectations are $244 (10-11% growth depending on final 2023 earnings). We think the reality will be closer to 6-8% growth (~$235).
Does our view that 2024 earnings will be lower than consensus matter? Is our view (shared by many) driving equity markets? Was this a consideration in the Q4 rally? Is there an asterisk next to the forward PE (our preferred valuation measure) that takes into account expectations are elevated and may not be met? The answer to all of these questions is no.
The point is that sitting at this point in 2025 (one year from now), analysts may once again be pricing in 10% earnings growth. If our 2024 earnings expectation of around $235 is accurate, this would put the 2025 expectations 1 year from now in the neighborhood of $260 (2026 earnings of ~$280-$290?).
The consensus base case for the economy seems to be a soft landing while the market is currently pricing in 150 basis points of Fed cuts between now and the end of January 2025. If the price to expected earnings (PE) remains in its current range of 19-20x, based on $260 in expected 2025 earnings (1-year from now) we could see the S&P 500 finish 2024 in the 5000-5200 range (+5-9% from current levels).
2. A Decline in Earnings Expectations Would by Typical and Not Necessarily Negative
As we highlighted above, our view is that 2024 and 2025 earnings expectations are likely too high.
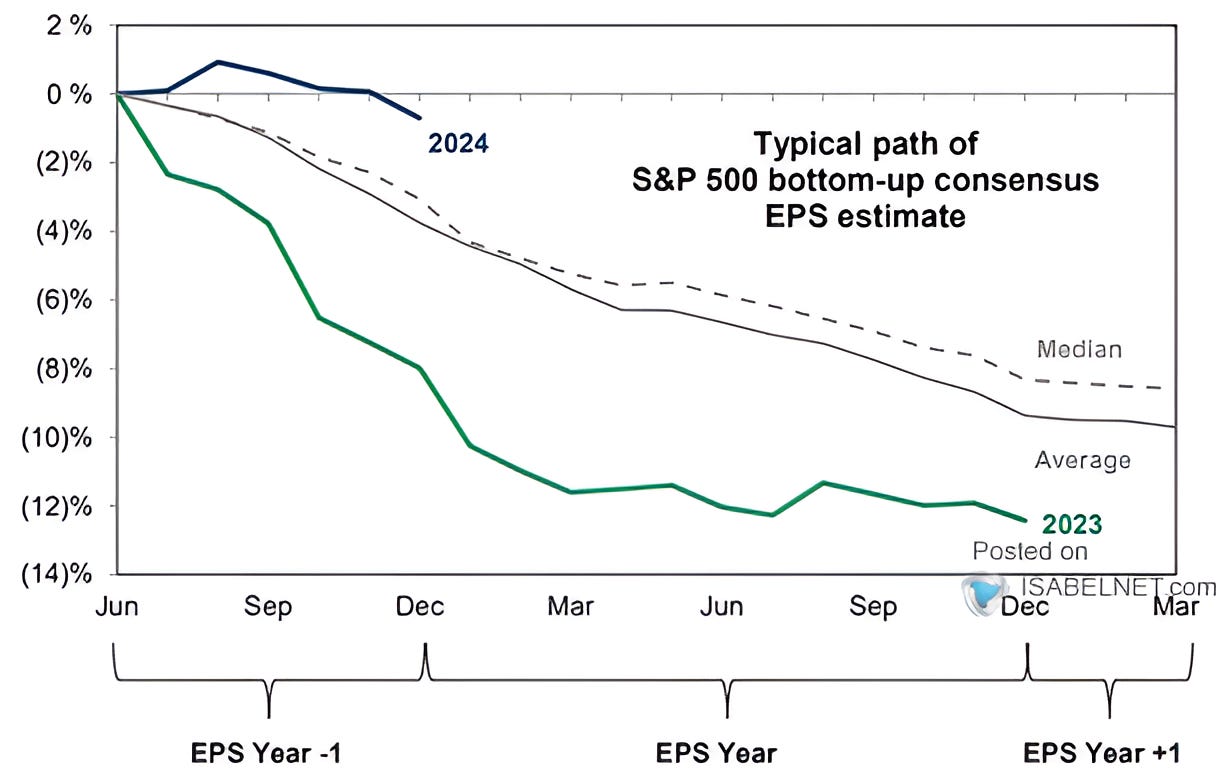
Historically, according to research from Goldman Sachs (chart below), earnings expectations typically drop 8-10% from the initial estimates to reality. (Past performance is not indicative of future results).
This doesn’t necessarily impact equity markets for a couple of reasons:
Company’s often lower guidance coming into earnings season and then exceed the lowered guidance when earnings are released. (See Chart 3 for the set-up coming into Q4 earnings season).
During earnings calls, management teams often raise the future outlook.
While the net sum of this dance is that actual earnings land below expectations, share prices continue to move higher as the outlook for future earnings continues to rise (even if it’s a less than expected).
One factor to note, if our 2024 S&P 500 earnings estimate of $235 comes to fruition, it would represent a ~4% decline from initial expectations which is a smaller drop than average.
We can already see that the path of 2024 S&P 500 bottom-up estimates has declined less than typical at this point in the cycle.
Source: Goldman Sachs. FactSet. Isabelnet.com.
3. The Current Set-Up Coming into Earnings Season
Q4 2023 S&P 500 earnings season officially begins on Friday when JP Morgan, Citigroup, Wells Fargo and others announce results. (This is not a recommendation to buy or sell any security).
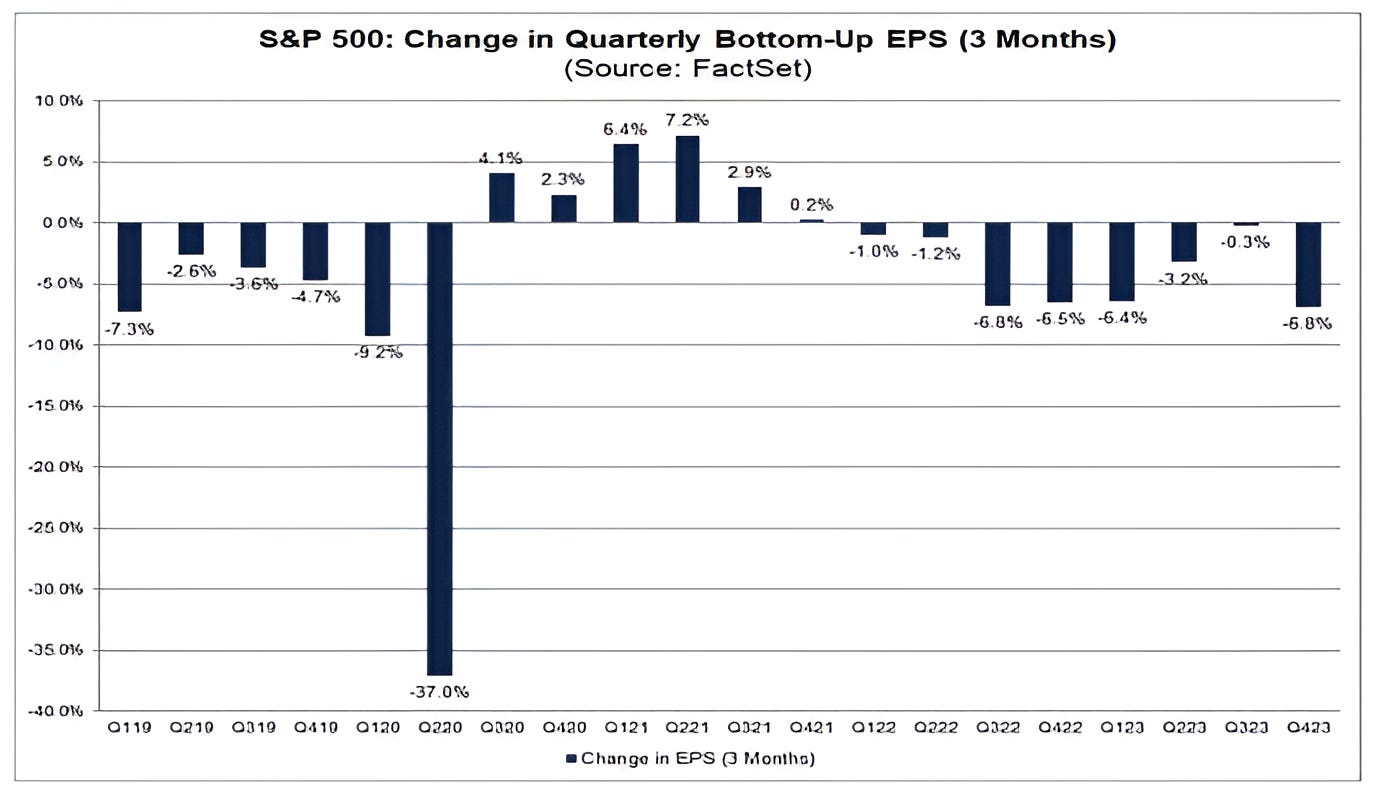
As can be seen on the chart below, over the past 3 months, earnings estimates for Q4 have dropped 6.8%. Not only was this an above average decline, but it was the largest downward revision since the pandemic quarter (Q2 2020).
Despite the negative earnings revisions, as we know, during Q4 shares rallied.
As highlighted in point 1 above, in our view the Q4 rally was driven by:
expectations for economic activity - tame inflation plus a soft landing became the narrative and helped drive 10-year Treasury yields lower;
monetary policy - Fed rate cuts and easier monetary policy expected;
earnings growth - while 2023 expectations were reduced a little, 2024 and 2025 forecasts remained stable. (Often, expectations matter more than reality.)
In our view, the lowered Q4 estimates have established a foundation for earnings to beat expectations. However, the outlook will likely be more important than last quarter’s results.
Source: FactSet. Through year-to-date 2024.
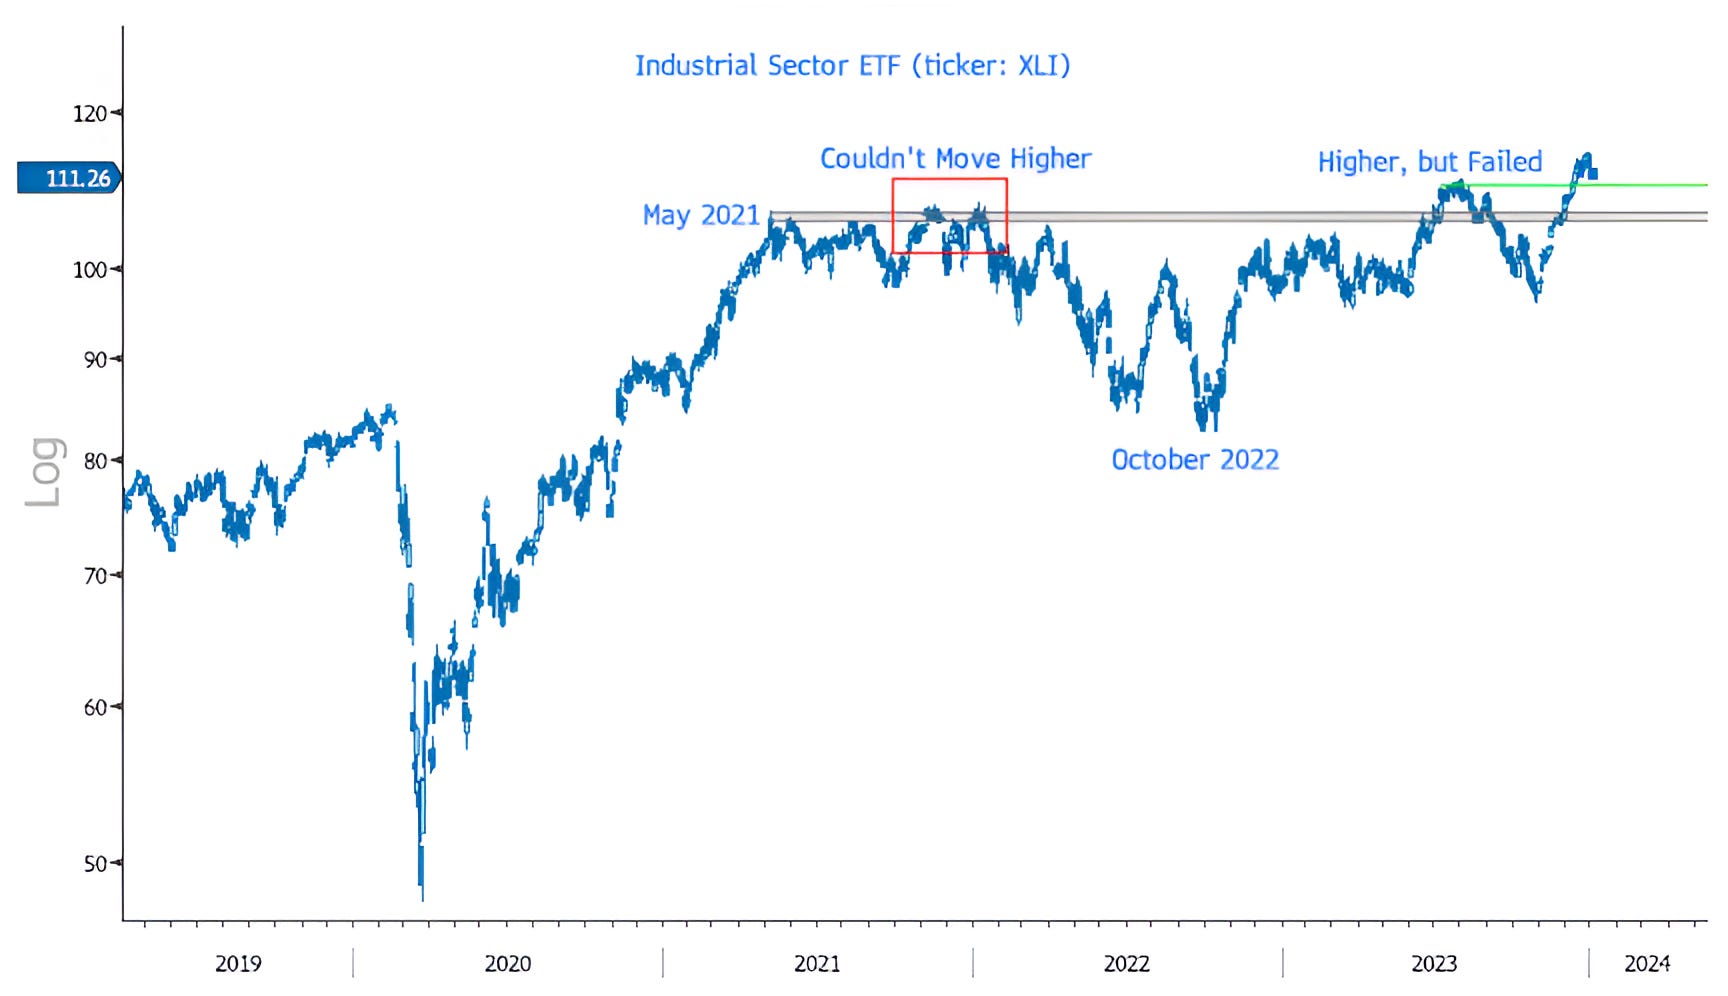
4. The Industrials Sector is Currently Constructive
Although the Technology sector has the largest weighting in the S&P 500 (28%), historically, the Industrials sector has been the most correlated with the overall performance of the index.
Looking at the chart below, the Industrials Sector ETF (ticker: XLI) has been flirting with the same ceiling level (grey shaded area) fro 2.5 years.
After rallying 123% from March 2019 to May 2021 on the post covid stimulus, the Industrials moved sideways through the end of 2021 and, despite trying, couldn’t move higher (red box).
Industrials (along with most of the equity market) traded down through October 2022.
In July 2023, Industrials were finally able to make it to the north side of their ceiling level. However, shortly thereafter they fell back below.
In the final months of the year, Industrials were able to recapture the north and make a new all-time high. This is constructive.
Although the Industrials have traded down a little after their 19% run from late October to late December, we are watching to see if they can hold a level near the July high (green line) and if not, if they can remain above their longer-term ceiling level.
If Industrials can remain on the north side of their ceiling, we see this as constructive for the market overall. A drop back below the ceiling would likely mean that the scenario for equities is more complicated than currently priced in.
We will continue to monitor.
Source: Bloomberg. Through year-to-date 2024.
5. The Consumer Looks Healthy
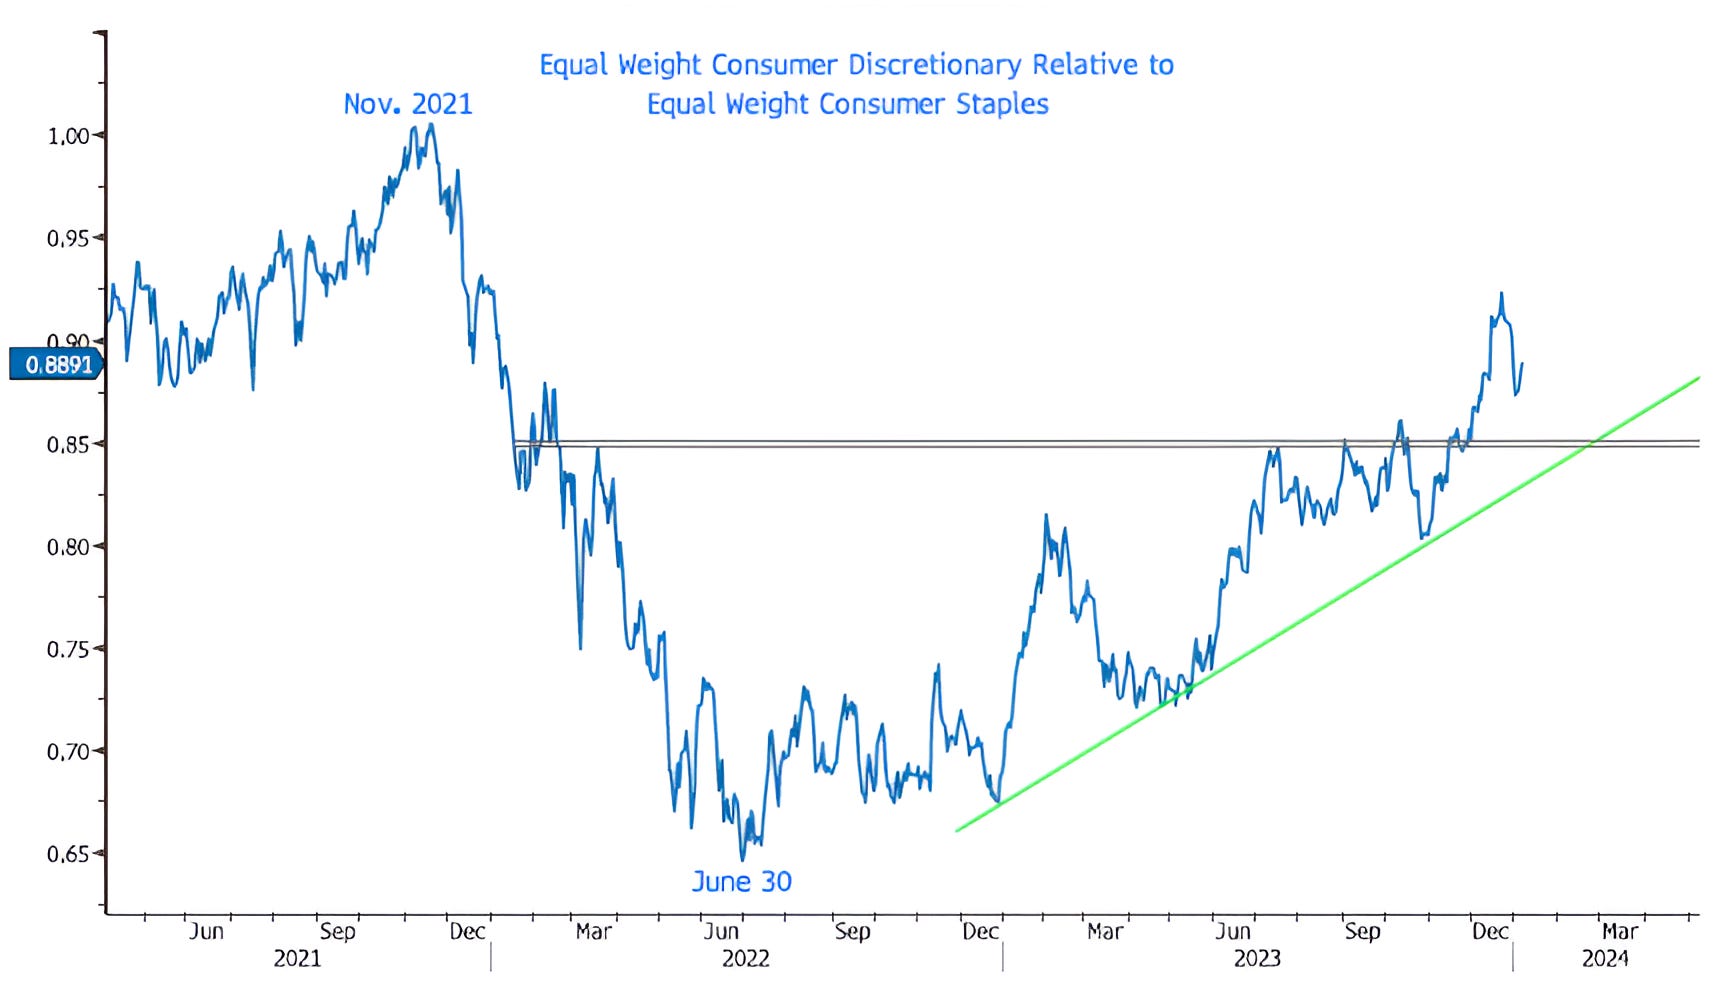
We often look at the Equal Weight Consumer Discretionary sector relative to the Equal Weight Consumer Staples sector as both a sign of the health of the consumer and a barometer of the overall market.
When this relationship peaked in November 2021, one month before the overall market, it foreshadowed the first half 2022 equity volatility.
Conversely, when this relationship bottomed in June 2022 and did not make a new low in October with the S&P 500, it was a positive signal for equities overall.
More recently, the Equal Weight Consumer Discretionary relative to the Equal Weight Consumer Staples hit its highest level since December 2021 and has been in an uptrend (the green line) for the past year.
Although it has recently moved down a little, this series is volatile and we don’t consider each individual movement as meaningful.
We would view a drop below either the 2022-2023 ceiling area (grey shaded zone) or the uptrend line as moves that would warrant attention. That said, for now, we consider the recent performance of this relationship as supportive to a continued positive equity market environment.