Earnings and the Fed, Oh My!
Over 25% of the S&P 500 by market cap reports earnings this week including 5 of the Magnificent 7. In the middle of the week, the Fed will articulate its current policy considerations. Buckle up!
1. Over 25% of the S&P 500 Reports Earnings This Week
This week is the biggest week of the Q4 2023 reporting season and the combination of earnings and outlooks will likely color the near-term character of equity markets.
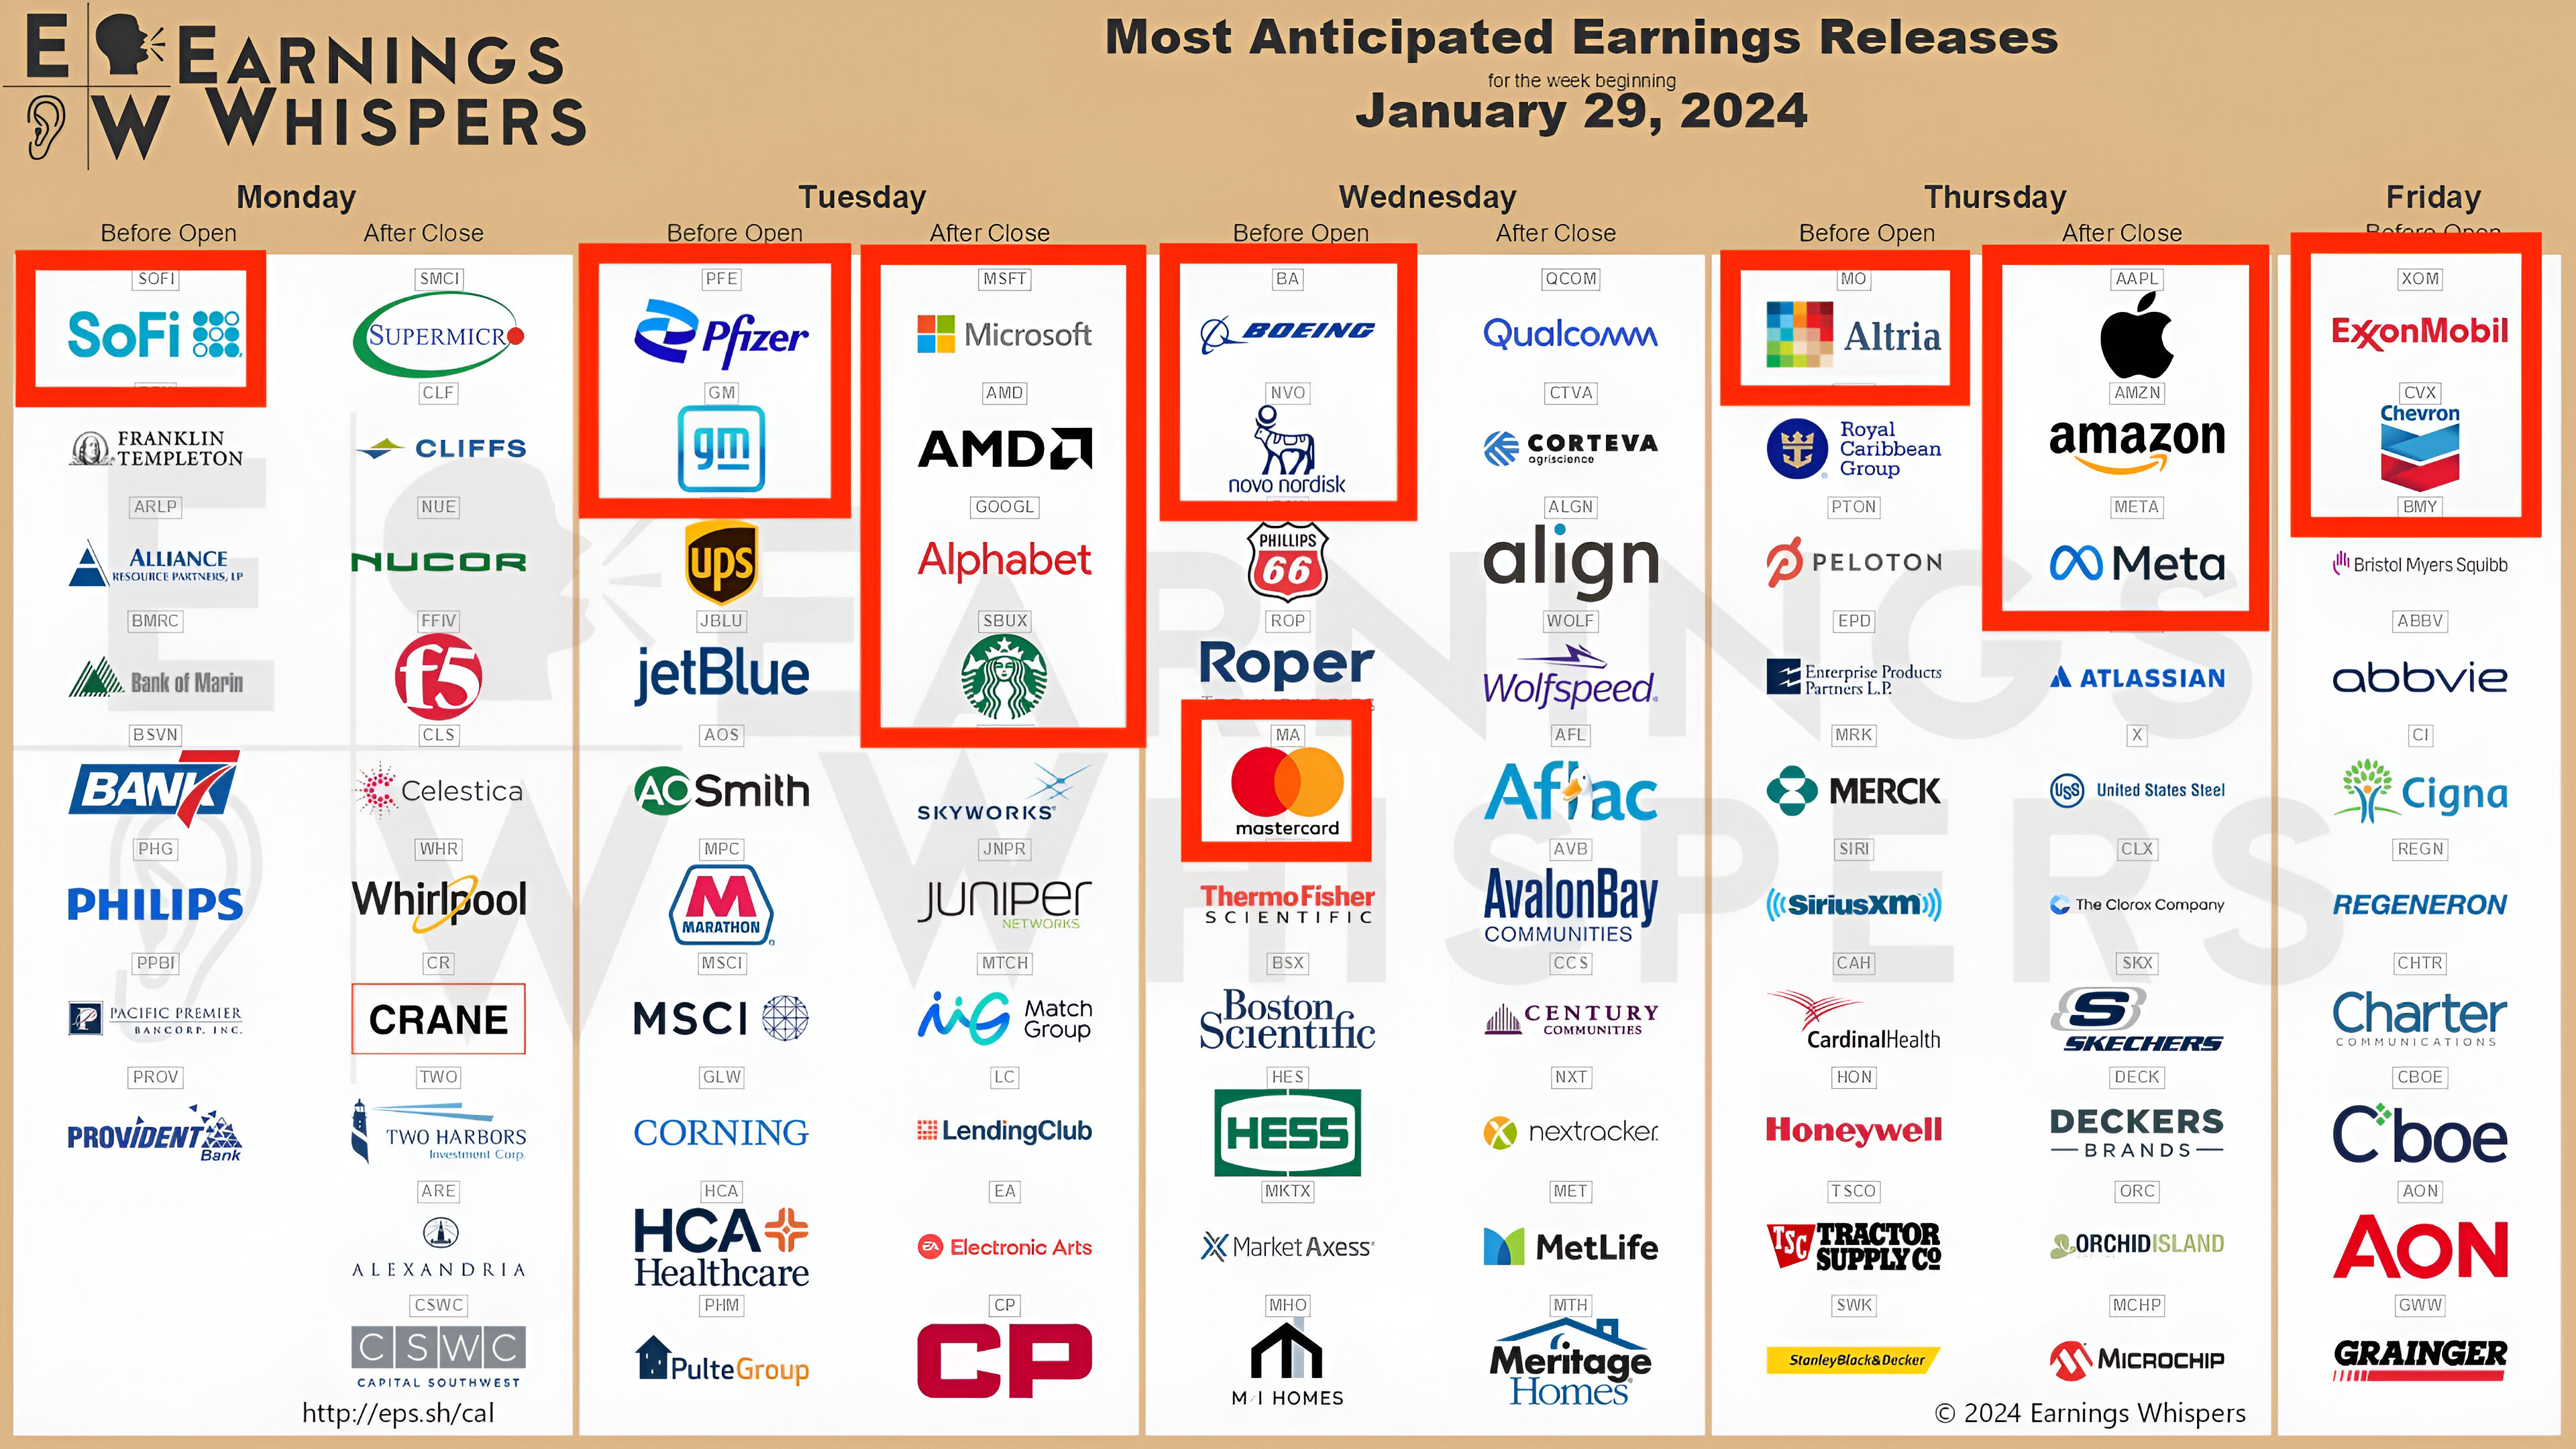
The chart below shows the calendar. While we have highlighted some of the largest and most influential (from an index perspective) shares (using red boxes), we will continue to track the aggregate earnings outlook.
Tomorrow after the close, Microsoft and Alphabet (Google) are reporting earnings while Thursday after the close, Apple, Amazon and Meta (FaceBook) are reporting. (This is not a recommendation to buy or sell any security).
These are 5 of the Magnificent 7 stocks (Tesla, which reported last week and Nvidia which reports in 3 weeks are the other 2).
As can be seen in Chart 2 - these are important to the overall Q4 2023 earnings profile of the S&P 500.
Source: Earnings Whispers. Through year-to-date 2024.
2. Magnificent 7 and Everyone Else
As noted above, 5 of the Magnificent 7 shares are expected to report earnings this week.
If we add Nvidia to the list, in aggregate, these 6 companies are expected to report year-over-year earnings growth of 53.7% for Q4.
Excluding these 6 companies, the blended (combines actual and estimated results) earnings decline for the remaining 494 companies in the S&P 500 would be -10.5% for Q4 2023.
Overall, the blended earnings decline for the entire S&P 500 for Q4 2023 is -1.4%.
This is likely indicative of a narrow and fragile market - a market that is dependent on a few shares to drive earnings growth as well as returns.
That said, a fragile market does not necessarily warrant selling (as we saw in 2023) but, in our view, likely requires vigilance.
This chart re-emphasizes how important this week is in terms of earnings.

Source: FactSet. Through year-to-date 2024.
3. The Fed’s Favored Inflation Metric Suggests “Job Done” on Inflation
On Friday, the Core Personal Consumption Expenditure (PCE) Index, the Fed’s favored measure of inflation, came in at 2.9% for December (chart below).
Looking at the month-over-month readings, core PCE fell to 1.5% on a 3-month annualized basis and 1.9% on a 6-month annualized basis.
While, market participants believe that this may indicate the Fed’s job is done on inflation, the market is currently pricing in less than 50% odds that the Fed will cut rates in March down from a 66% likelihood at the beginning of the year.
The Fed is due to announce its January decision on Wednesday. While no movement in the Fed Funds rate is expected, Fed Chair Powell will likely articulate many of the committees current considerations at his press conference.
In the middle of one of the biggest earnings weeks, the Fed’s statement, outlook and press conference are likely to be market moving events.

Source: Bloomberg. Through year-to-date 2024.
4. A Divergence Worth Noting, but Not Necessarily Acting on (Yet)
As the S&P 500 has achieved new all-time highs, is that it has done so at a time of a narrow earnings growth; inconsistent economic data; and heightened investor optimism.
Rather than over-react, where appropriate, our emphasis has been on hedging portfolios with options (puts / put spreads); raising a little cash (depending on time frame and risk profile) and concentrating portfolios on shares and sectors with higher confidence. (These are not recommendations).
Today, we add the divergence between the S&P 500 and the Transportation Index to our list of questionable characteristics of the current market back drop.
This is a modified version of Dow Theory that states new highs in the Dow Industrials Index need to be “confirmed” by highs in the Transportation Index to establish a consistent uptrend.
While this does not need to be immediately confirmed, the “divergence” - new highs in one but not the other - adds a question market to the viability (and maybe confidence in) the current new highs.
In the chart below, I have highlighted some “divergences” when the S&P 500 has established new highs (green arrows) that have not been confirmed by the Transportation Index (red arrows).
With the exception of the mid-2021 drawdown in the Transportation Index, each divergence was followed by volatility in the S&P 500 overall. (Past performance is not indicative of future results).
Although, it is not shown on the chart below, at the time of the mid-2021, Transportation Index drawdown, the Dow Industrials Index (the true Dow Theory comparable), unlike the S&P 500, was moving sideways (not making any consistent new highs).
This chart and condition, in our view, warrants our attention, but not necessarily our over-reaction.

Source: Bloomberg. Through year-to-date 2024.
5. More Seasonality…
We like to consider ourselves aware and respectful of, but not beholden to, seasonality.
What does this mean?
There are times when equity markets has moved lower and a cautious / negative narrative develops. If this is part of a typical seasonal cycle, we may want to recalibrate our portfolios before the seasonal trends reverse.
There are other times when we can be patient in portfolios as we recognize that market activity is “normal”.
We also want to be acutely aware of when the market does something atypical.
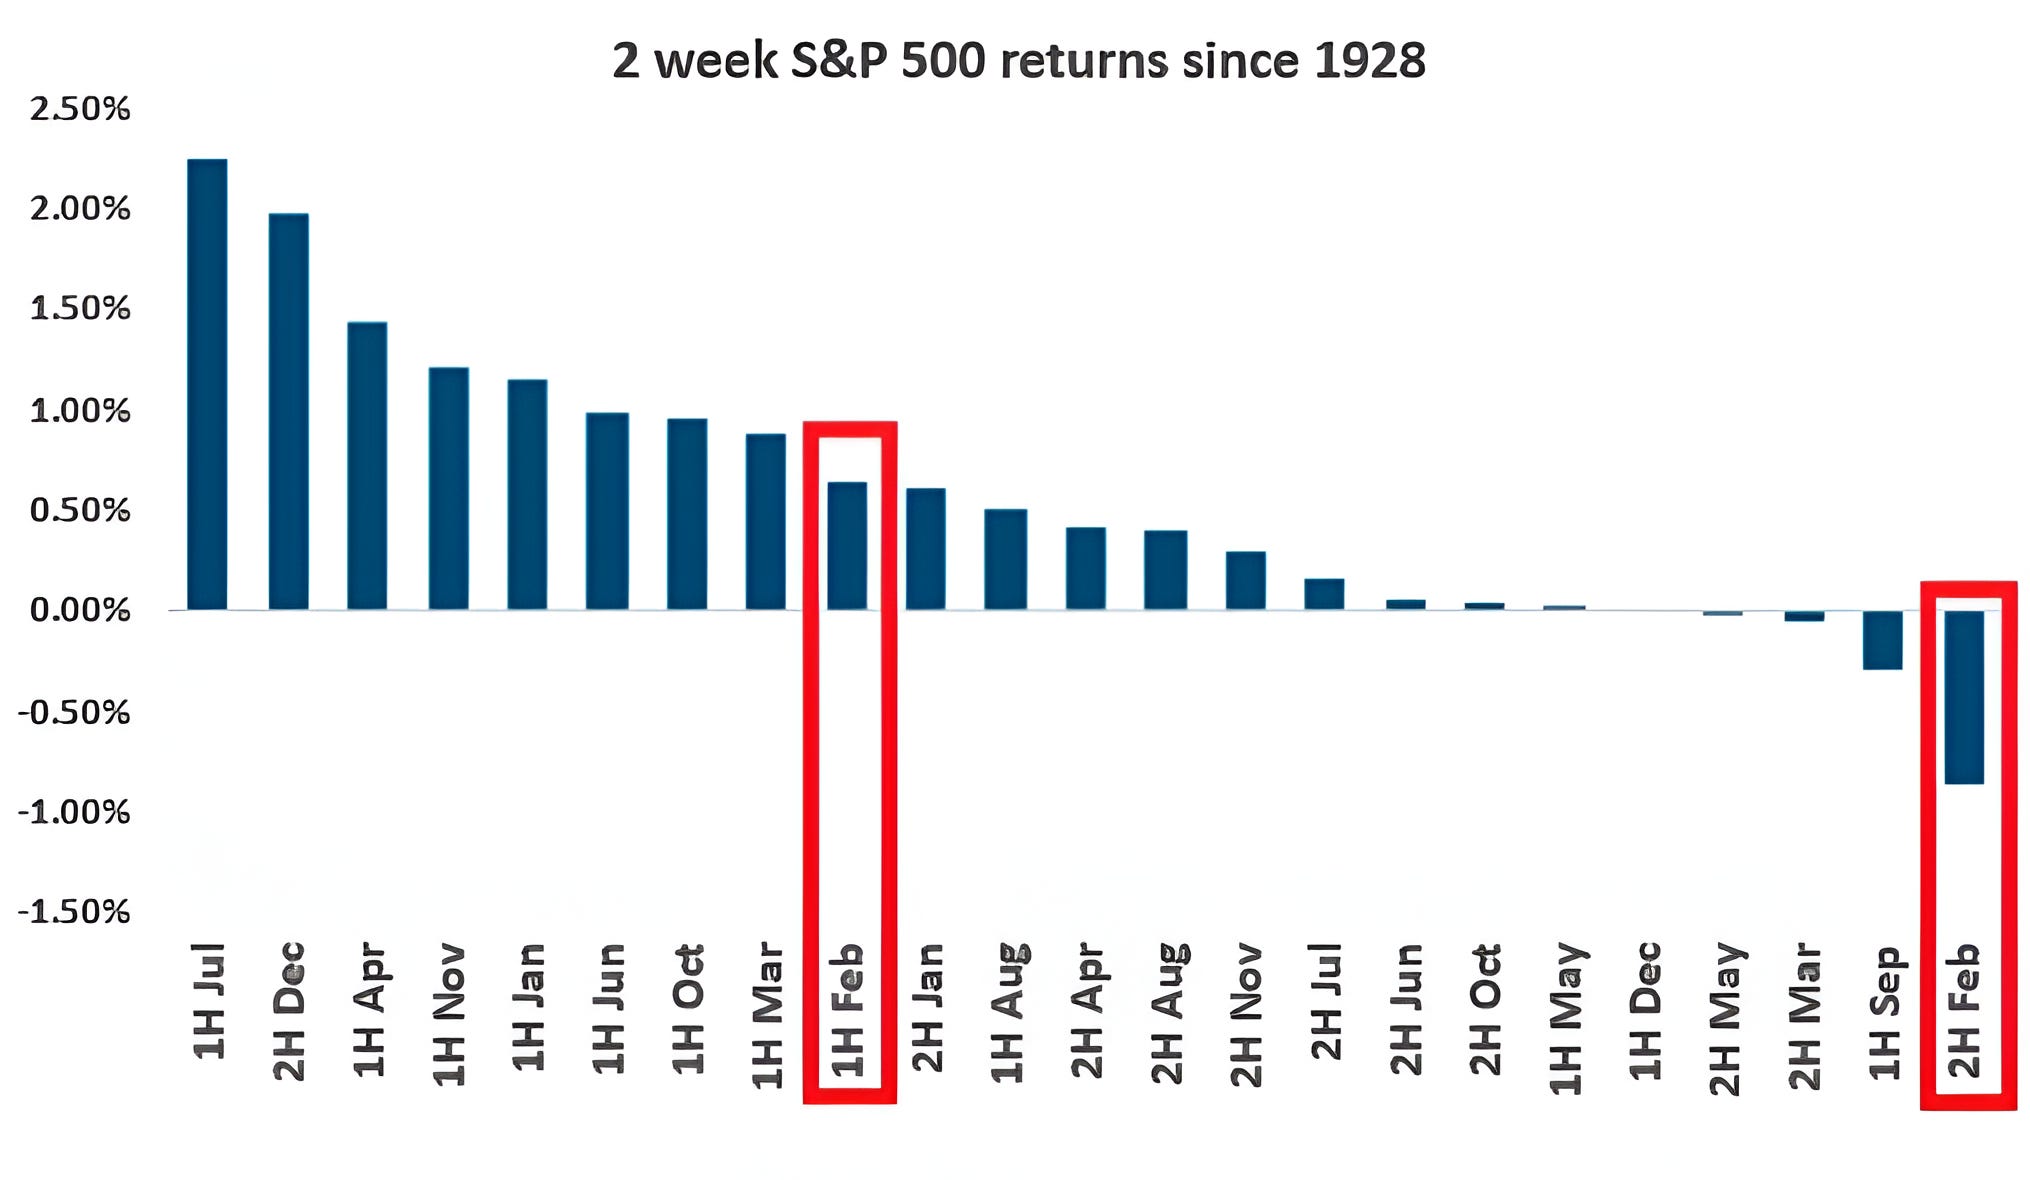
With that in mind, Goldman Sachs has looked at average returns for each half of each month from 1928. (Somehow, the 2nd half of September did not make it on to the chart).
While the first half of February is a little better than average, the second half of February, on average, has been the worst two-week period of the year. (Past performance is not indicative of future results).