


Happy Monday!
After Nvidia's results last week drove the US equity indexes to their best week of the year and new all-time highs, there are several tertiary earnings and emerging trends this week. Let's dig in...
1. Is AI Netscape 2.0?
The chart below (from Bespoke Investment Group) shows the Nasdaq Composite’s path in the 750 trading days following several major technology releases since MS-DOS in 1981.
Since ChatGPT’s November 2022 release, the Nasdaq’s path most resembles the path after the release of the Netscape web browser in late 1994.
It is obviously difficult to compare technologies, their impact on businesses, productivity and ultimately share prices.
However, with the luxury of hindsight, it is interesting to consider the evolution, unexpected results and the market roller-coaster ridess associated with many of these significant technological advances.
I remember arriving home each day to be greeted by an AOL cd (along with buy 1 music cd, get 10 free flyers). At the time, there was no way to consider the rise and demise of pets.com or Global Crossing.
There was a time in 1999 when Internet Capital Group came public, was up 100% giving it a value of $3 billion on its first day of trading. At its high point in December 1999, the Company had a market cap of $52 billion, behind only AOL and Yahoo as an Internet stock. (Internet Capital Group was essentially bankrupt 3 years later).
As I alluded to on Friday, it is difficult to understand all of the winners and losers from AI. Will there be a wave of lay-offs? Will there be medical break-throughs?
Like many other periods of technology emergence, some of the trends and beneficiaries are those we are not currently considering.
Contrarily, some of today’s perceived AI winners - similar to AOL, MySpace and Blackberry - may end up as side notes in the industries they helped create.
We will do our best to highlight trends and conclusions and to identify winners and losers as AI matures.
(This is not a recommendation to buy or sell any security, it is not investment advice, please do your own analysis).

Source: Bespoke Investment Group. Through year-to-date 2024.
2. “All in All, We Have No possibility of eye-popping performance” - Warren Buffett
Over the weekend, Berkshire Hathaway announced that Q4 operating earnings (primarily from insurance, railroads and utilities) had grown nearly 28% .
In addition, Berkshire announced that it now has $167.6 billion in cash up from $157.2 billion at the end of Q3.
In his annual letter, Warren Buffett wrote:
“There remain only a handful of companies in this country capable of truly moving the needle at Berkshire, and they have been endlessly picked over by us and by others.
Outside the US, there are essentially no candidates that are meaningful options for capital deployment at Berkshire.
All in all, we have no possibility of eye-popping performance.”
He went on to say:
“With our present mix of businesses, Berkshire should do a bit better than the average American corporation and, more important, should also operate with materially less risk of permanent loss of capital.
Anything beyond ‘slightly better,’ though, is wishful thinking.”
While Berkshire Hathaway is the largest component of the Financial Sector and outperformed many others in the group over the past year, it is clear that it is unlike most other companies categorized as financials.
When we consider the chart below of the company’s B shares, we see a stock that, over the past two years has traded in a broad ($85) range.
Since the start of the year, Berkshire shares have moved above the range and with the initial positive response to earnings (at this morning’s open) had gained $85 from 2022 / 2023 ceiling level.
While we have shown a target level (top horizontal blue line) $85 above the 2022 /2023 ceiling and we often consider these symmetric levels a good place to pause, we have no view on the outperformance / underperformance of the stock from here.
We do find it interesting how many patterns similar to Berkshires we are seeing - both the moves above long-term ceiling levels (the horizontal lines) and the “cup and handle” formations (the arcs).
(This is not a recommendation to buy or sell any security).

Source: TradingView. Through year-to-date 2024.
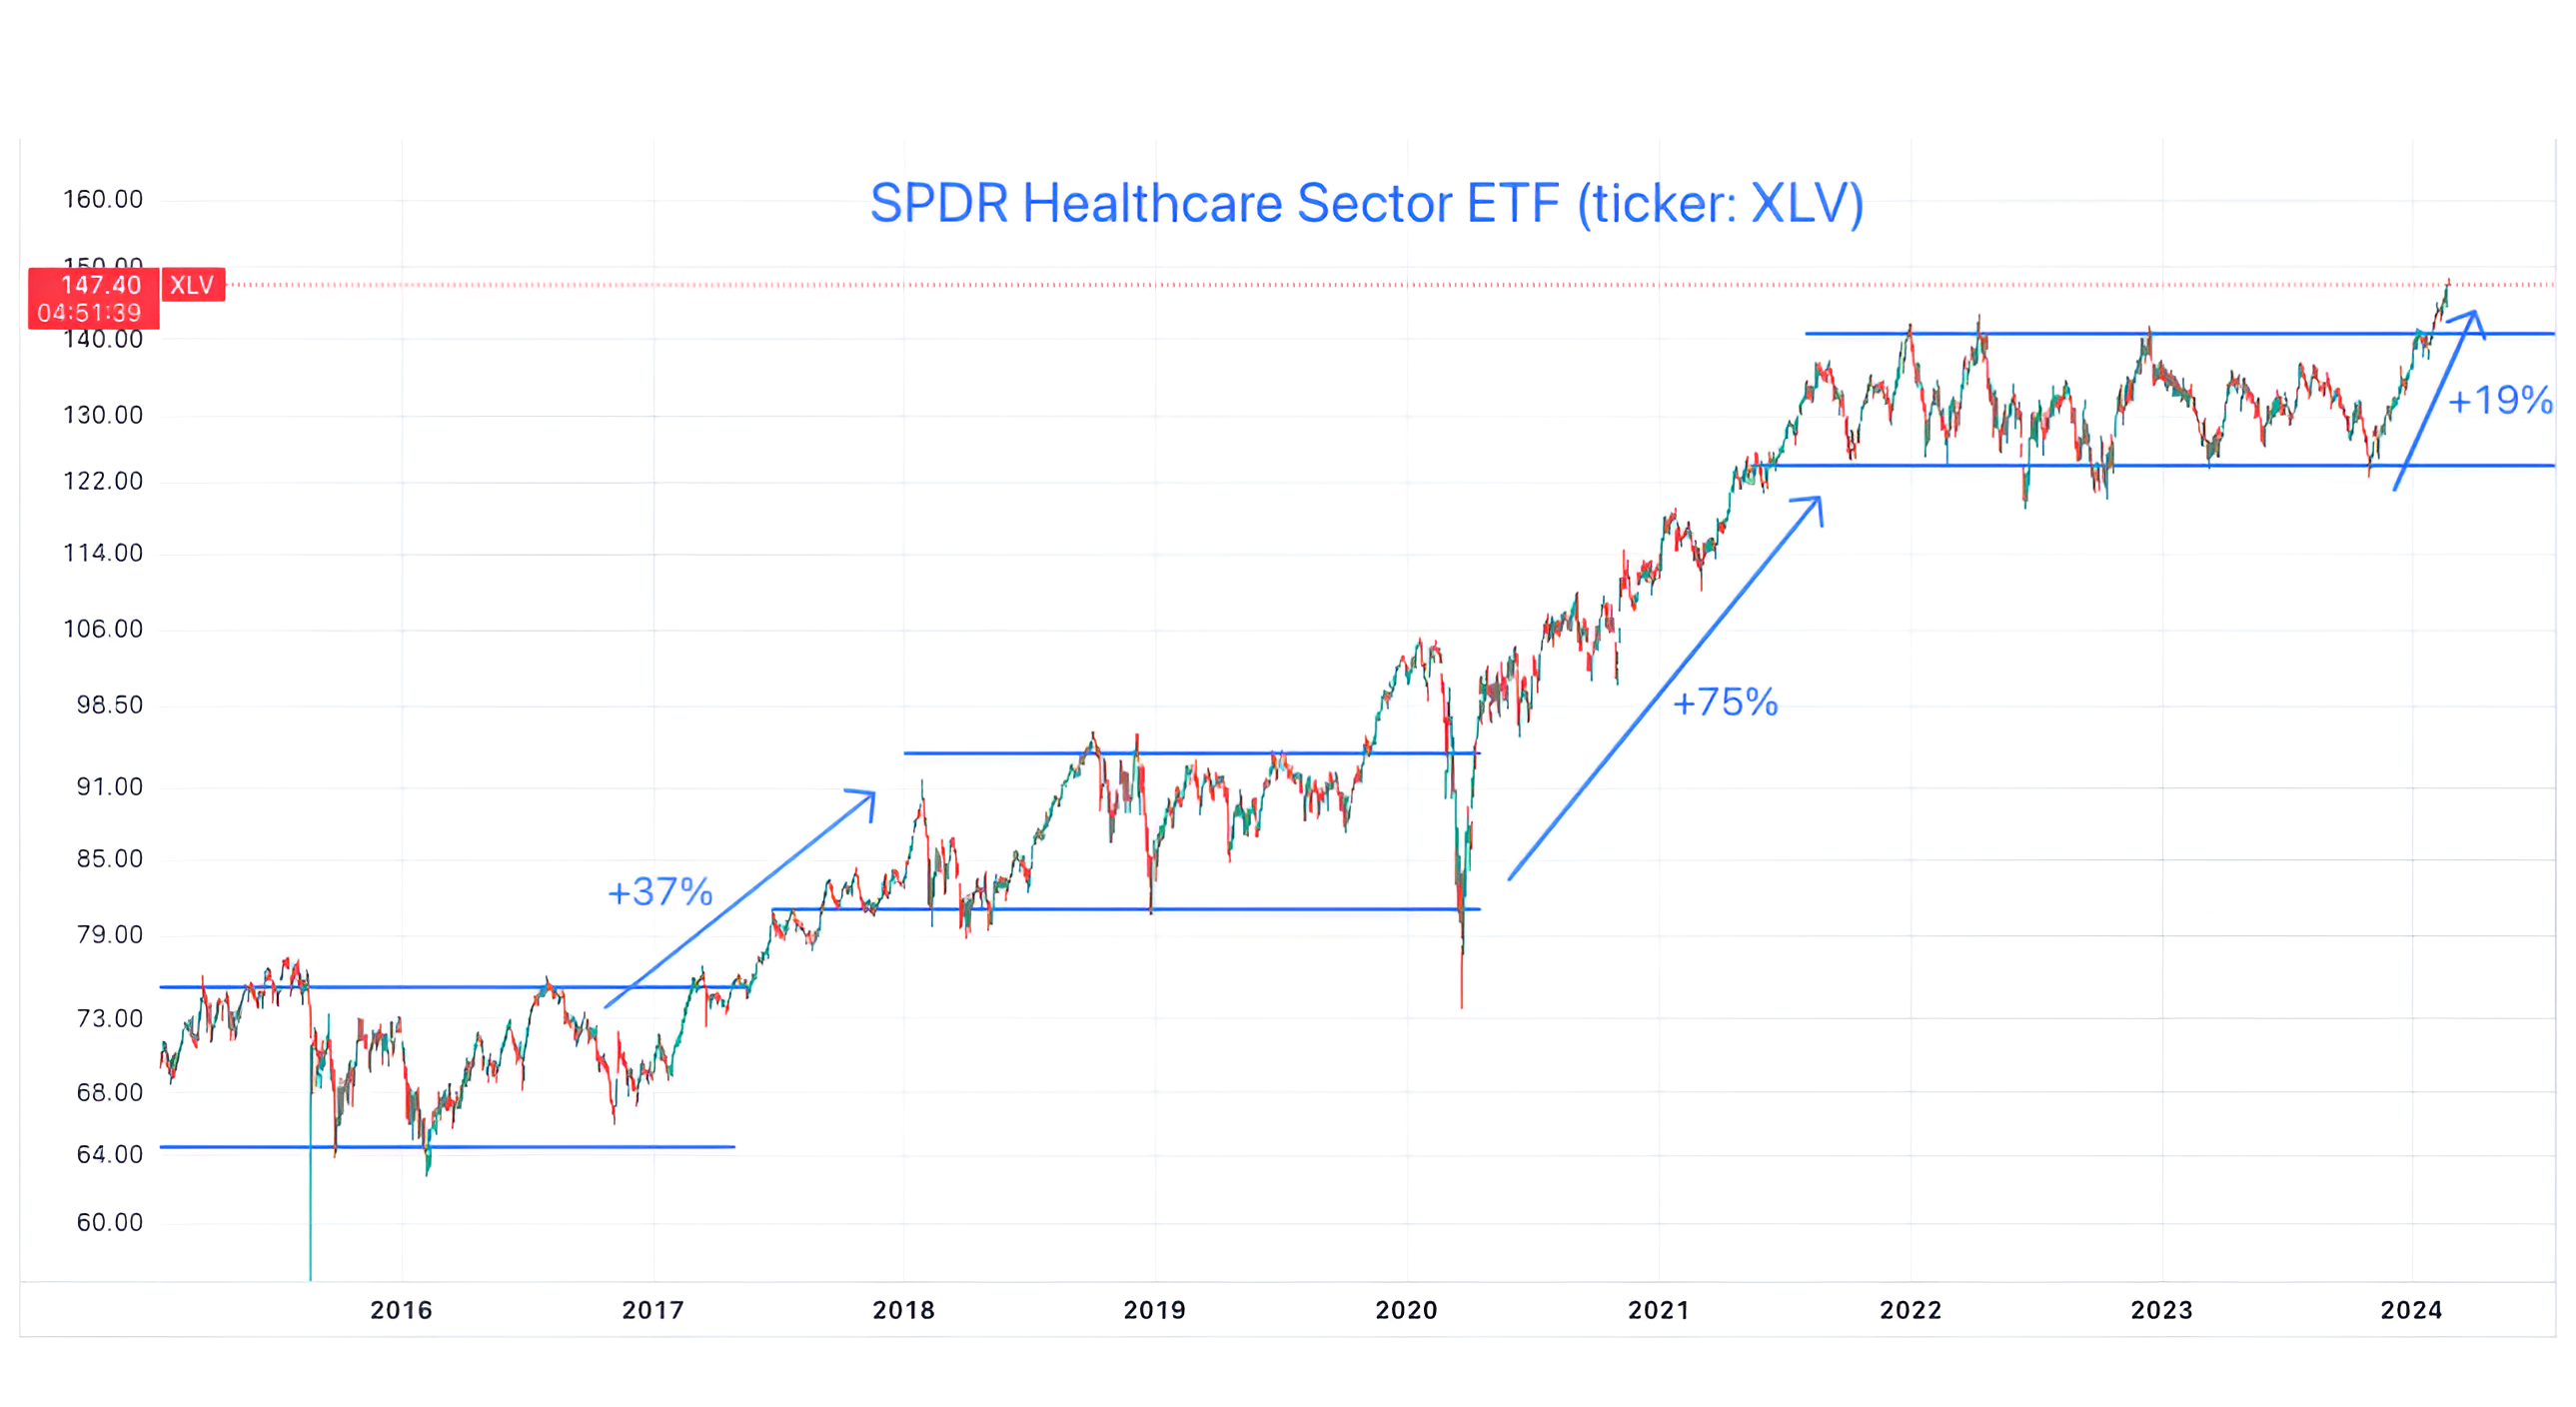
3. Stair-Stepping Higher! Health Care
The chart below shows the Health Care Sector ETF (ticker: XLV) (It looks very similar to the other major US Healthcare sector ETF: IYH). (This is not a recommendation to buy or sell any security).
Since the end of October 2023, the Healthcare Sector ETF has rallied 19% to a new all time high.
While we don’t know whether moving out of a long sideways range will once again precede a meaningful move higher, we do know that there are some interesting dynamics in the healthcare industry:
GLP-1s: these are the Ozempics and Mounjaros of the world.
According to JP Morgan, the GLP-1 market is expected to grow by 53% compounded annually from 2022-2030 and close to 3X over the next 3 years.
While the GLP-1s are mainly known for their success in fighting diabetes and obesity, in some ways, they are behavioral drugs.
Many people taking GLP-1s stop biting their finger nails, drink less alcohol, walk more, eat better (not just less) and gamble less. In other words, the GLP-1s will have an impact across sectors and industries, but for now, we are focused on Healthcare.
The Affordable Care Act (Obamacare): From July 2010 when the Affordable Care Act was passed, the Healthcare Sector is up 425% vs. 368% for the S&P 500. Obamacare has been a windfall for health care insurance companies and drug companies.
AI: On Friday, we wrote about AI 1.1 and 2.0. We believe the combination of AI on drug development and the use of AI on data within the healthcare industry could be a significant driver of innovation, time-to-market and efficacy.
We will watch to see whether these dynamics continue to drive the Healthcare Sector ETF higher.
(This is not investment advice)
Source: TradingView. Through year-to-date 2024.
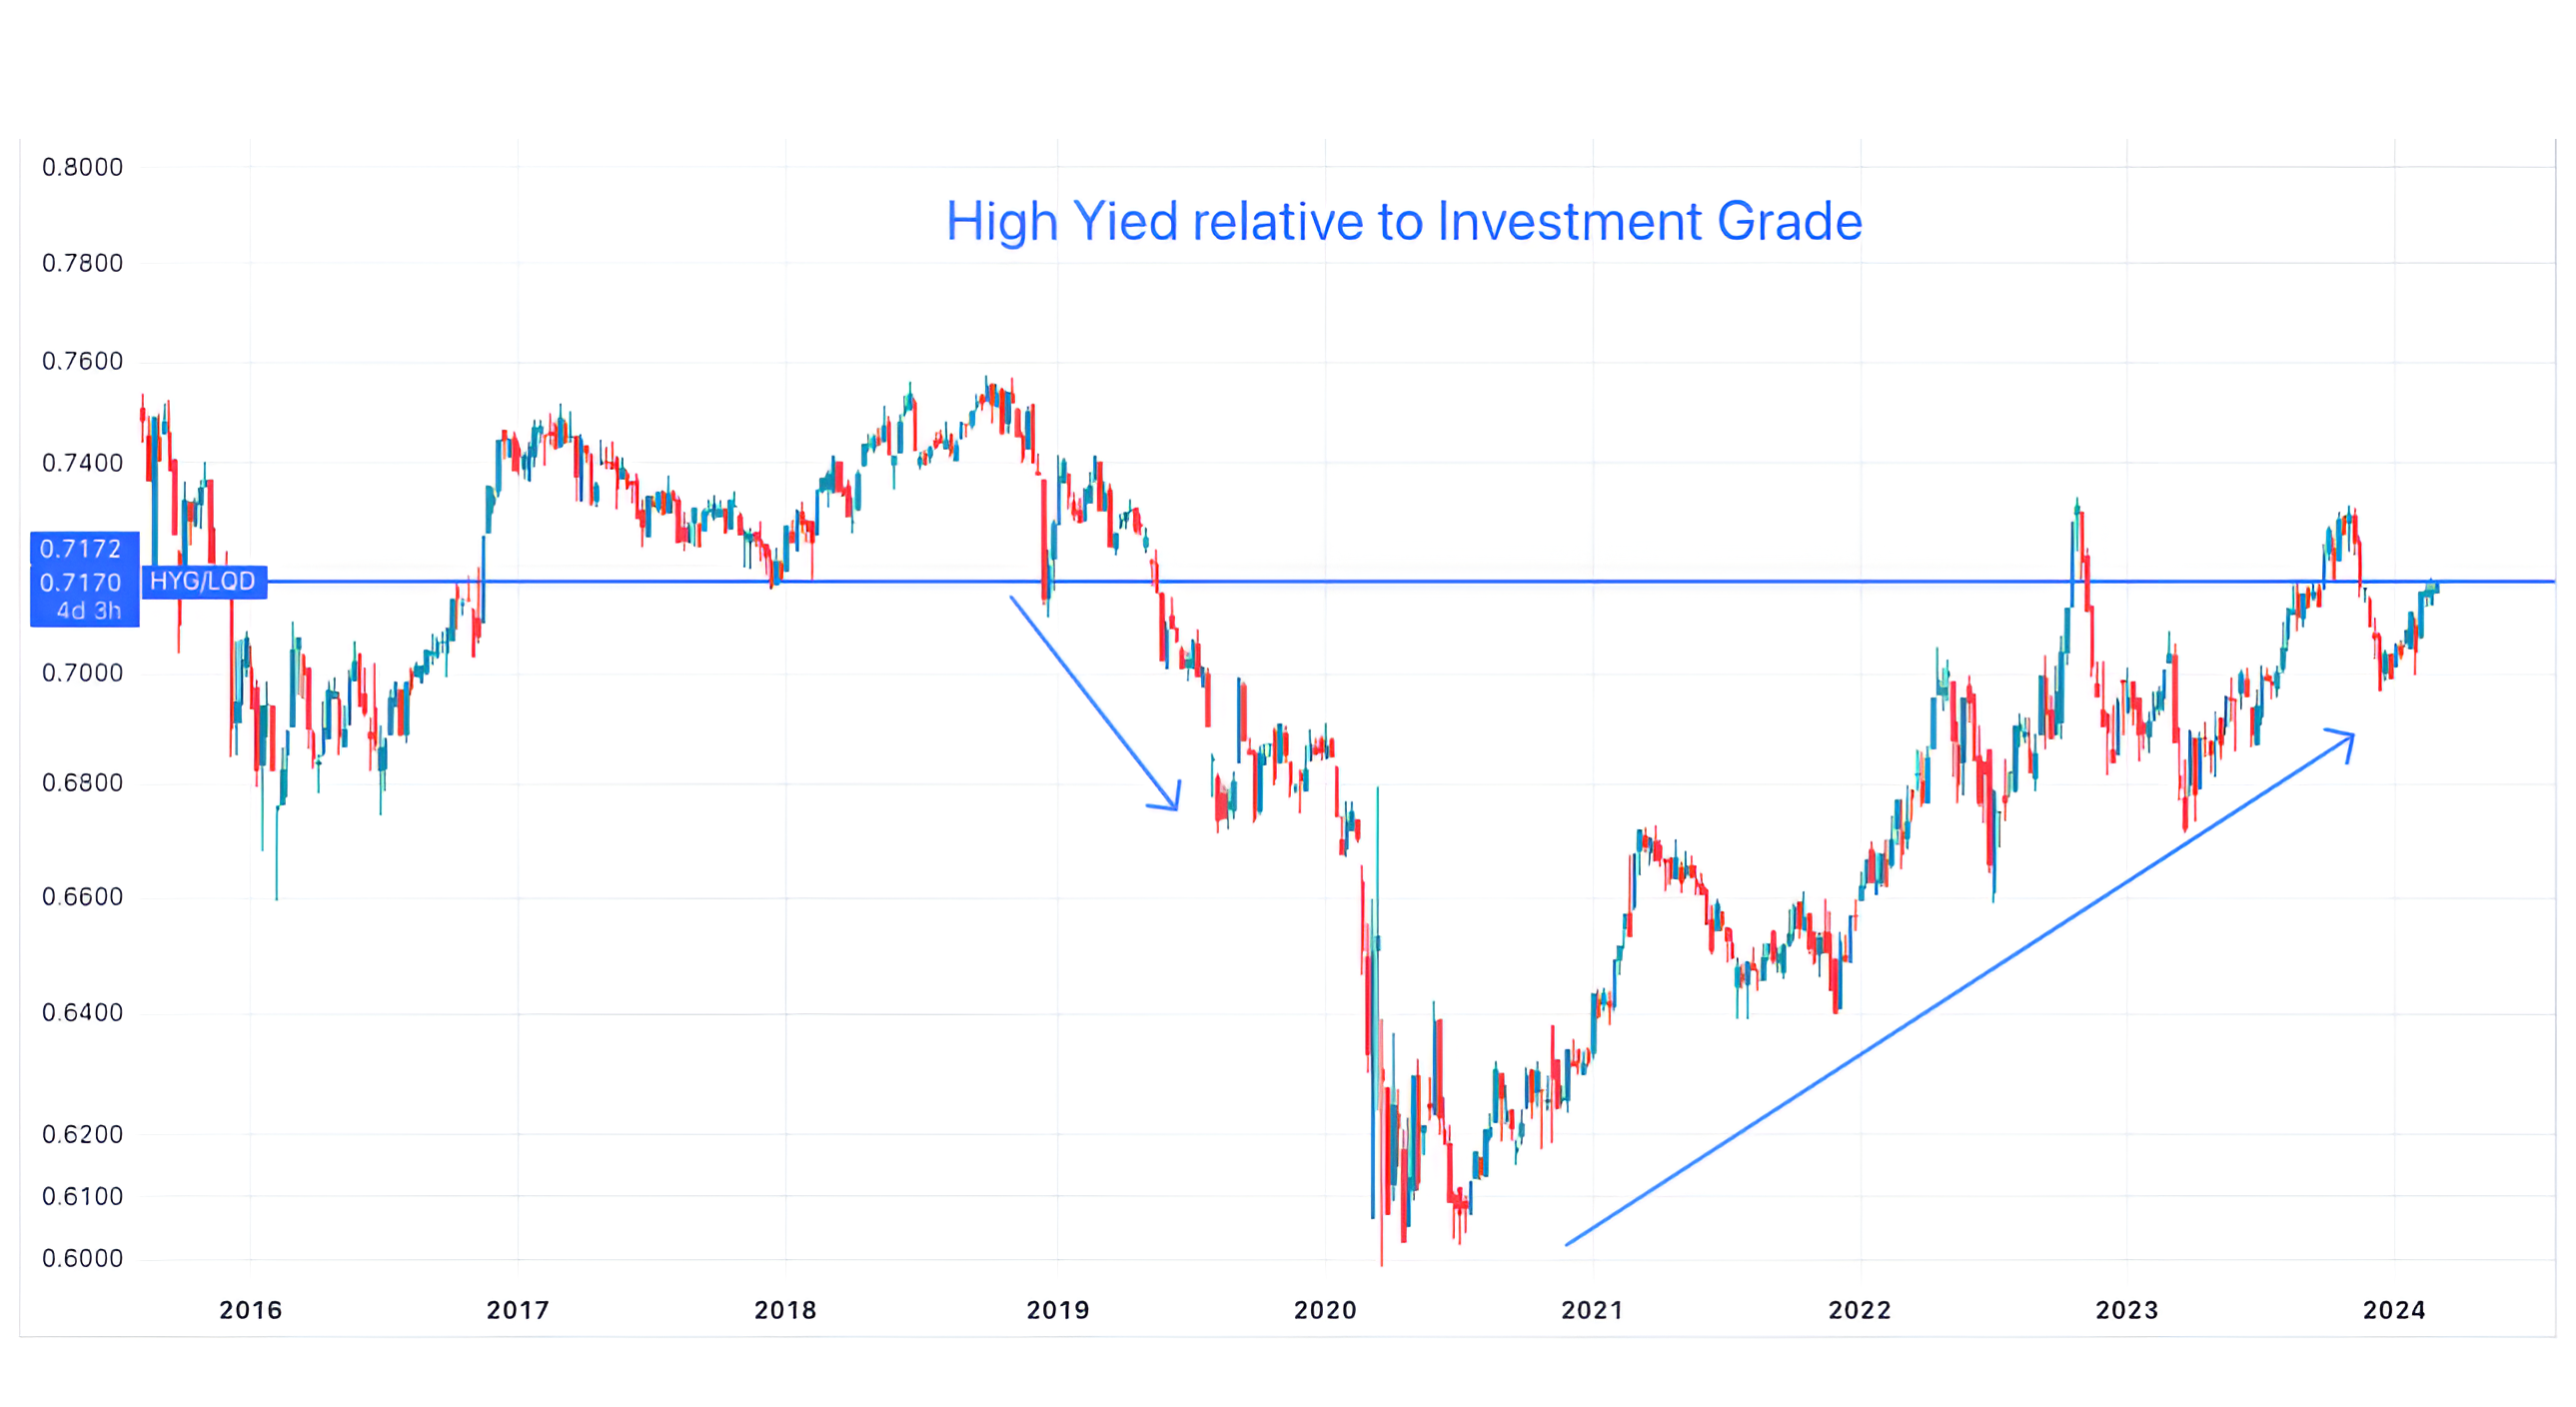
4. High Yield vs. Investment Grade Looks Bullish
One simple relationship we like to follow is High Yield relative to Investment Grade Credit.
The chart below uses the High Yield ETF (ticker: HYG) and the Investment Grade Corporate Bond ETF (ticker: LQD) as proxies. (This is not a recommendation to buy or sell any security).
The idea is that any economic or stress, if it were to occur, would begin in riskier portions of the fixed income market (high yield) before transcending to the higher-rated neighborhoods.
It is interesting to me that High Yield was underperforming in 2019 (left, downward arrow on the chart) before plateauing in January 2020 and continuing its descent into the covid lows.
Why is that interesting?
Equity markets moved higher in 2019 while the yield curve (very) briefly inverted.
It is possible, in our view, that the US economy could have been slowing significantly in 2019 and on a path to a recession without covid.
While we would not rely on this (or any one) indicator alone, it is also notable that at the end of 2019, Consumer Staples began to outperform Consumer Discretionary (another relationship we follow).
With all of that said, we see little current stress in High Yield relative to Investment Grade credit.
In our view, if the relationship pushes meaningfully above 2017 - 2019 floor / 2022 - 2023 ceiling that might be considered evidence of the bond markets perception of continued economic growth.
(This is not investment advice).
Source: TradingView. Through year-to-date 2024.
5. “I Don't Want to Belong to Any Club that will Accept Me” - Groucho Marx
I have often anecdotally heard that when a new share is added to the Dow Jones Industrials Index as another is consequently dropped (there are consistently 30 shares in the Index), the contrarian trade is to short the new member and buy the former member.
As it was recently announced that Amazon would replace Walgreens in the Index as of today, we found the chart below interesting.
Since Walgreens replaced General Electric in the Dow Industrials Index, General Electric is up nearly 86% while Walgreens has dropped 58%. (Past performance is not indicative of future results).
That said, this trade doesn’t always work as Apple replaced AT&T in the Index in 2015 and since that time AT&T is down 35% while Apple is up over 500%.
(This is not a recommendation to buy or sell any security).
