


Hold the Line, Love Isn't Always on Time
As we were looking over a broad range of charts that we view as market barometers and early warning indicators, we noticed many were at levels that have been meaningful in the past. Let's dig in...
Today’s note is going to be a quick one.
Yesterday, we highlighted last week’s “doji” in the S&P 500 that is often an indication of investor indecision.
Despite the resilience in the S&P 500 and Nasdaq 100, there are Indexes (chart 1), Relationships (chart 2) and Sectors (charts 3 and 4) - each of which we view as providing insight to the market and / or the economy - that are at critical levels.
If these levels are broken, it could foreshadow further market weakness, volatility and economic uncertainty.
On the other hand, if these lines hold, the market’s ascent could strengthen as participation continues to increase.
“It's not in the way that you hold me, It's not in the way you say you care. Hold the Line.” Toto
1. Small Caps
After rallying and poking above their trading range of the last 2 years, Small Caps have dropped back to revisit the top of the range.
While there is second support area 2.7% below the current floor, we want to see if Small Caps can hold this level.
We have continued to highlight our view that the Small Caps are often a reflection of equity investors economic outlook.
A move higher from current levels might be an indication that investors see future economic strength, whereas a drop would add question marks to an already uneven economic and market foundation.
(This is not a recommendation to buy or sell any security, it is not investment advice).
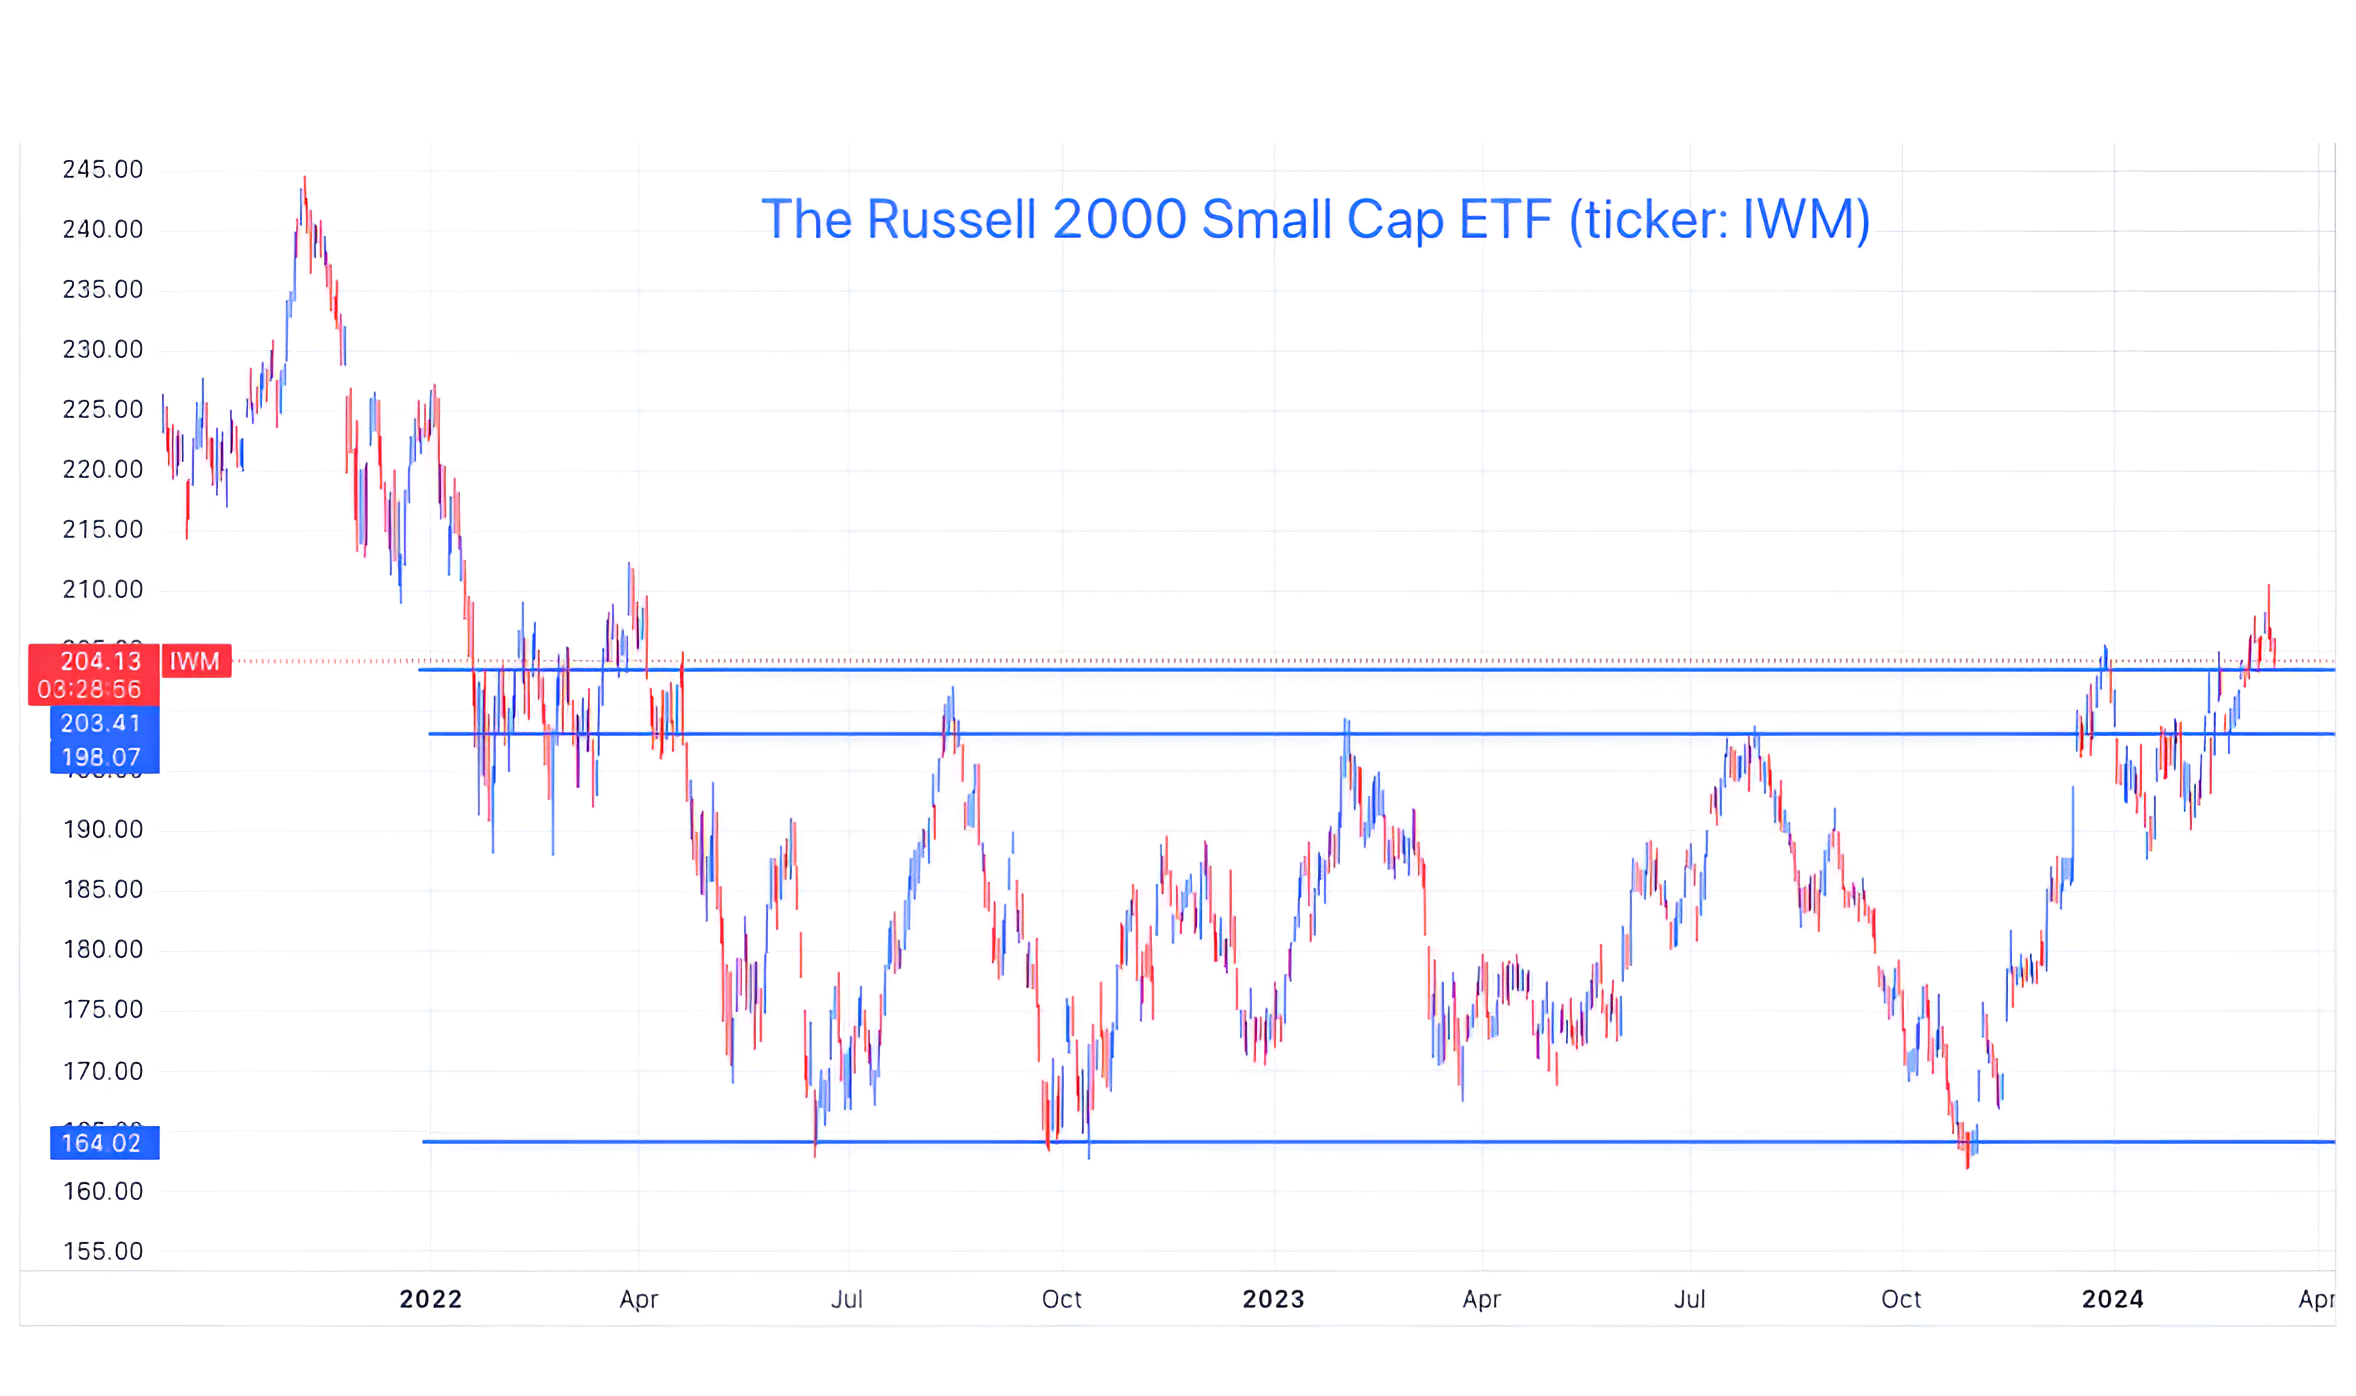
Source: TradingView. Through year-to-date 2024.
2. Consumer Staples vs. Consumer Discretionary
If the US economy is approximately 2/3 based on the consumer, it makes sense to keep an eye on how (and what) the consumer is doing.
Is the consumer feeling healthy and spending on discretionary items or only purchasing necessities (staples)?
While this relationship does not have a direct correlation with consumer attitudes or economic growth, we believe it’s an important one to track.
From mid-2022 to December 2023, Consumer Discretionary outperformance relative to Consumer Staples looked very similar to the chart of the S&P 500 both:
bottomed in October 2022;
rallied after Nvidia / AI earnings in May 2023;
fell again into October 2023; and
rallied once again.
However, on December 21, Consumer Discretionary relative to Consumer Staples peaked while the S&P 500 continued moving higher.
Over the next month, the Consumer relationship fell back to its Q3 ceiling level (the top horizontal line) and has been indecisive ever since.
Regardless of whether Consumer Discretionary vs. Consumer Staples can move sustainably higher from here or if it falls from this level, the recent weakness - and divergence from the upward trend in the S&P 500 - has our attention.
(This is not a recommendation to buy or sell any security and is not investment advice).

Source: TradingView. Through March 5, 2024.
3. Regional Banks
Regional banks are the lifeblood of many local US economies.
When these banks are lending and fostering development, small businesses are able to grow, hire and thrive.
As we saw last year (the steep drop on the chart), this sector was disproportionately impacted by the Feds restrictive policies.
Although the Regional Banks climbed back from the March 2023 crisis, they never made it all the way back to their former floor level (higher 2 blue horizontal lines).
With recent volatility in New York Community Bank (ticker: NYCB), the Regional Banks dropped below their August 2023 peak. (This is not a recommendation to buy or sell any security).
Since that time, they have stabilized, but have been fighting with the August 2023 peak line.
In our view, a resolution from current levels in the Regional Banks - either north or south - will be a meaningful reflection of the economy and may once again have an impact on the character of the overall equity market.
(This is not a recommendation to buy or sell any security).

Source: TradingView. Through year-to-date 2024.
4. Utilities
The Utilities are often seen as the ultimate safety sector within US equity markets.
In general, the companies in this sector provide electricity and are regulated in terms of what they can charge customers and their profitability.
While Utilities bottomed with the S&P 500 in October 2023, they were rejected at the 2021 / 2022 floor level.
After falling during the Nvidia / “risk-on” move from January 1 to mid-February, investors have gravitated back to utilities over the past month.
Although there are narratives of how much power AI / data centers will require (this may be the “growth” case for utilities), we are watching the recent ascent of the sector and question whether there are some looking for safety within the equity market.
As we highlighted yesterday, with Gold, Bitcoin and Treasuries rallying (Treasury yields moving lower), there are a number of investors that seem to be hedging against possible uncertainty across markets.
In our view, the recent rally in Utilities may be an expression of the same view and in our experience, it may worthy of attention.
(This is not a investment advice and is not recommendation to buy or sell any security).

Source: TradingView. Through year-to-date 2024.
5. Copper
Dr. Copper is often seen as a barometer of world economic growth.
When Copper prices are moving higher, its a reflection of demand for homebuilding, electrical wires and industrial use.
When Copper prices are dropping, it may be an indication of a global economic slowdown.
After experiencing a post-covid rally, Copper dropped as monetary policies tightened and China went into lock-down mode.
Unlike many US equity indices, Copper bottomed in July 2022 and while it flirted with its lows in September and October, it never revisited them.
That positive divergence (Copper not making a new low, while equities were at a low) could have provided some lynx-eyed equity investors with confidence in October 2022.
More recently, Copper has been fighting with its 2nd half of 2023 ceiling.
Some look at the relationship of Gold to Copper to consider whether investors are seeking safety (Gold) or are funding growth (Copper).
We looked at that relationship to see if we could find clues as to the future direction of copper. However, that relationship is also at a critical line.
Like the other charts above, we view the resolution on this one as meaningful.
(This is not a investment advice and is not recommendation to buy or sell any security)
