Party On!
Equities rally (chart 1) and rate cuts are priced in (chart 5) despite higher than expected inflation data and increasing global conflicts (chart 3).
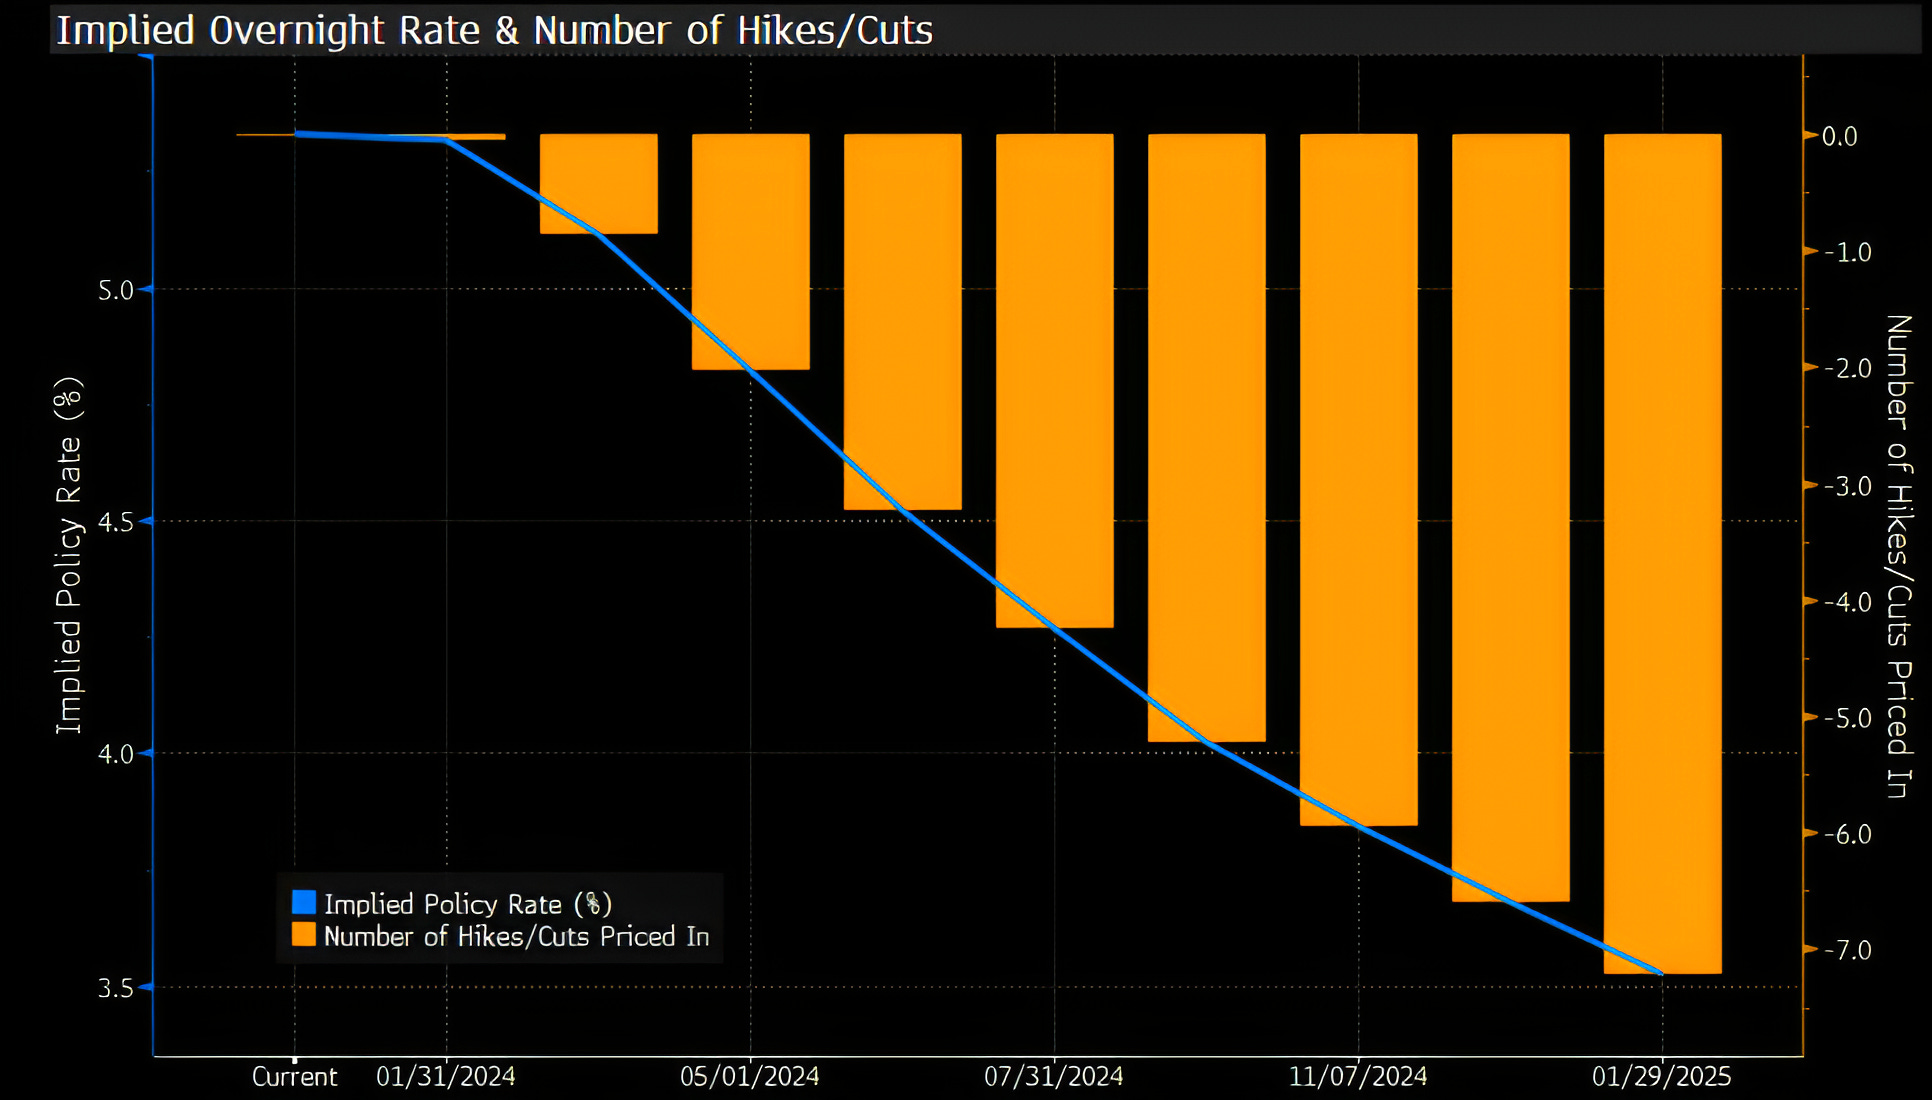
1. S&P 100 - We Didn’t Come This Far, to Only Come This Far
The S&P 100 - the Index that consists of the largest 100 companies in the S&P 500 has hit a new all-time high.
While few other indices or sectors have achieved the same (the technology and industrials sectors are close), in our view, this is a positive.
The S&P 500 is 0.3% away from its January 2022 all-time high, while the Nasdaq 100 is less than 1% from its December 2023 all-time high.
Smaller companies and more defensive sectors have continued to underperform.
We will watch to see if the S&P 100 can begin to pull other indexes and sectors higher or if the others drag it down.
Source: Bloomberg. Through year-to-date 2024.
2. Will Earnings Miss By More than We’re Expecting in 2024?
As we detailed earlier in the week, 2024 S&P 500 earnings expectations are for $244 (10-11% growth depending on final 2023 earnings).
Our view is that the earnings will be closer to 6-8% growth (~$235).
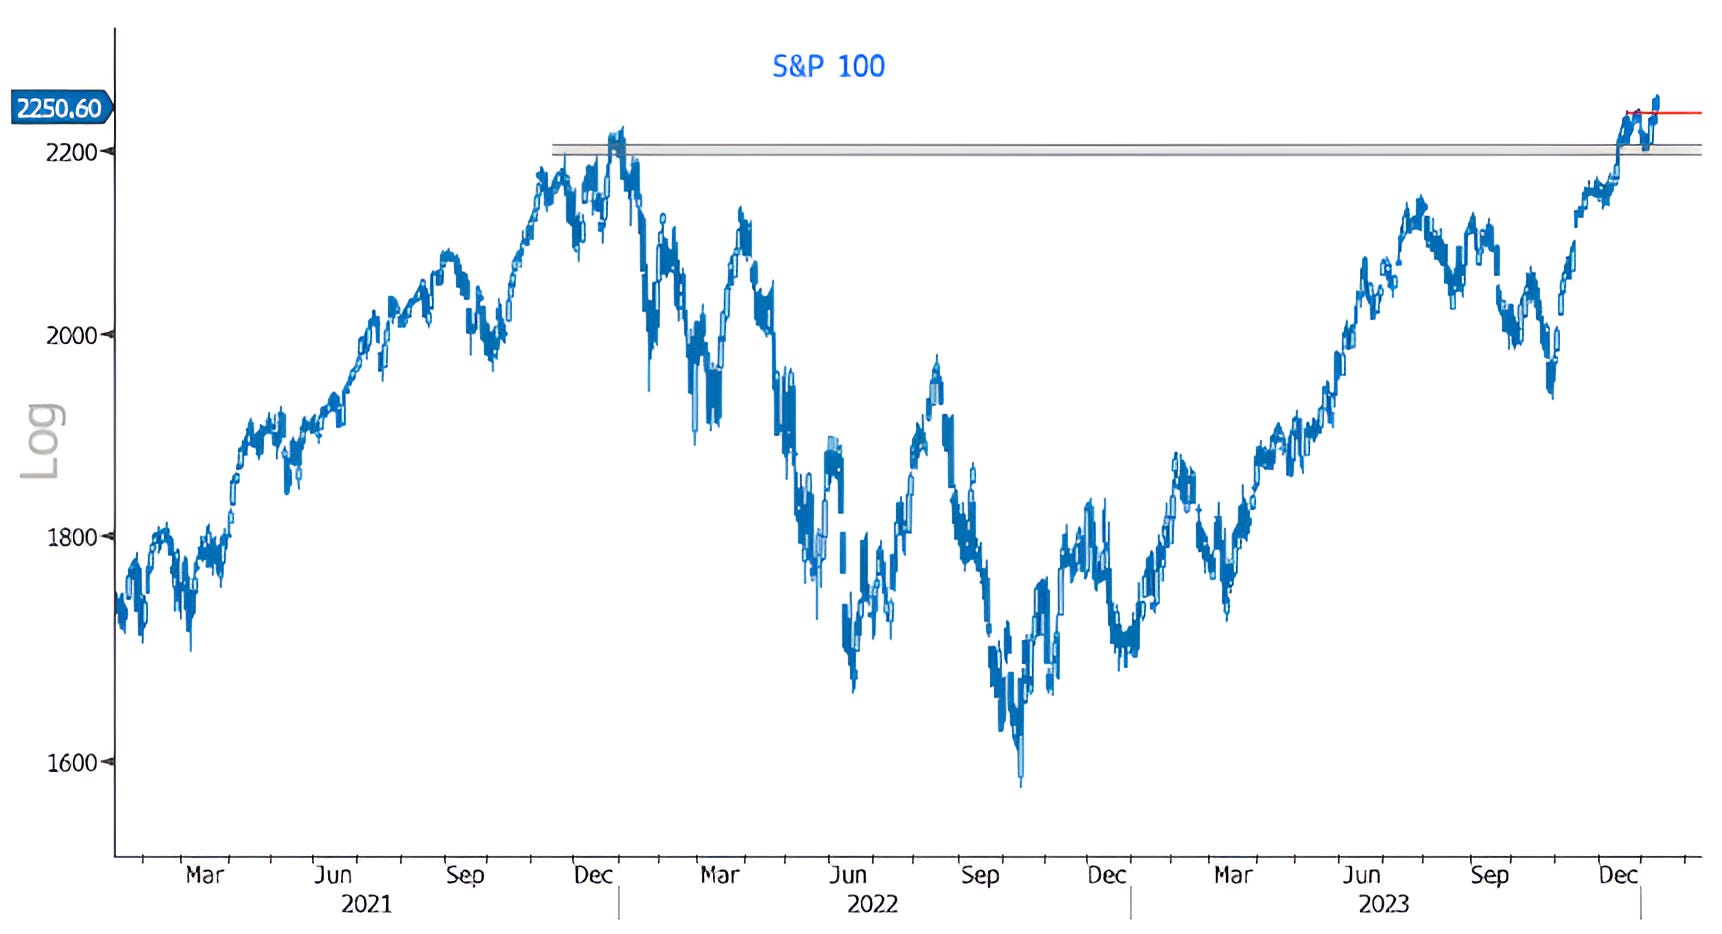
From the chart below, we can see that there is has been a consistent relationship with S&P 500 operating earnings growth (light blue, red / left axis) and the National Federation of Independent Business (NFIB) Sales Growth (dark blue / right axis). (Past performance is not indicative of future results).
If this relationship were to hold, it suggest a ~20% drop in S&P 500 operating earnings.
Given the ~31% weight of the top 10 shares in the S&P 500 and the resilience of their business models and consistency of earnings, this historical relationship may not be as relevant as in the past.
As examples of those top 10 shares and their business dynamics: Microsoft, Amazon and Google - have been supported by the continued growth in cloud which is unlikely to reverse significantly; Nvidia has benefitted from AI which is in its early stages; Meta (Facebook) is driven by user engagement and online advertising growth; Berkshire Hathaway is broadly diversified; and Eli Lilly is a leader in GLP-1 obesity drugs (Mounjaro). (This is not a recommendation to buy or sell any security).
That said, the relationship in the chart may help explain weakness (and recent underperformance) in Small Caps despite the resilience of the larger companies.
As Q4 earnings season is starting today, we will continue to monitor.
Source: Nordea and Macrobond. Through year-to-date 2024.
3. A Pain in the Houthi: Shipping Prices the Highest Since Covid
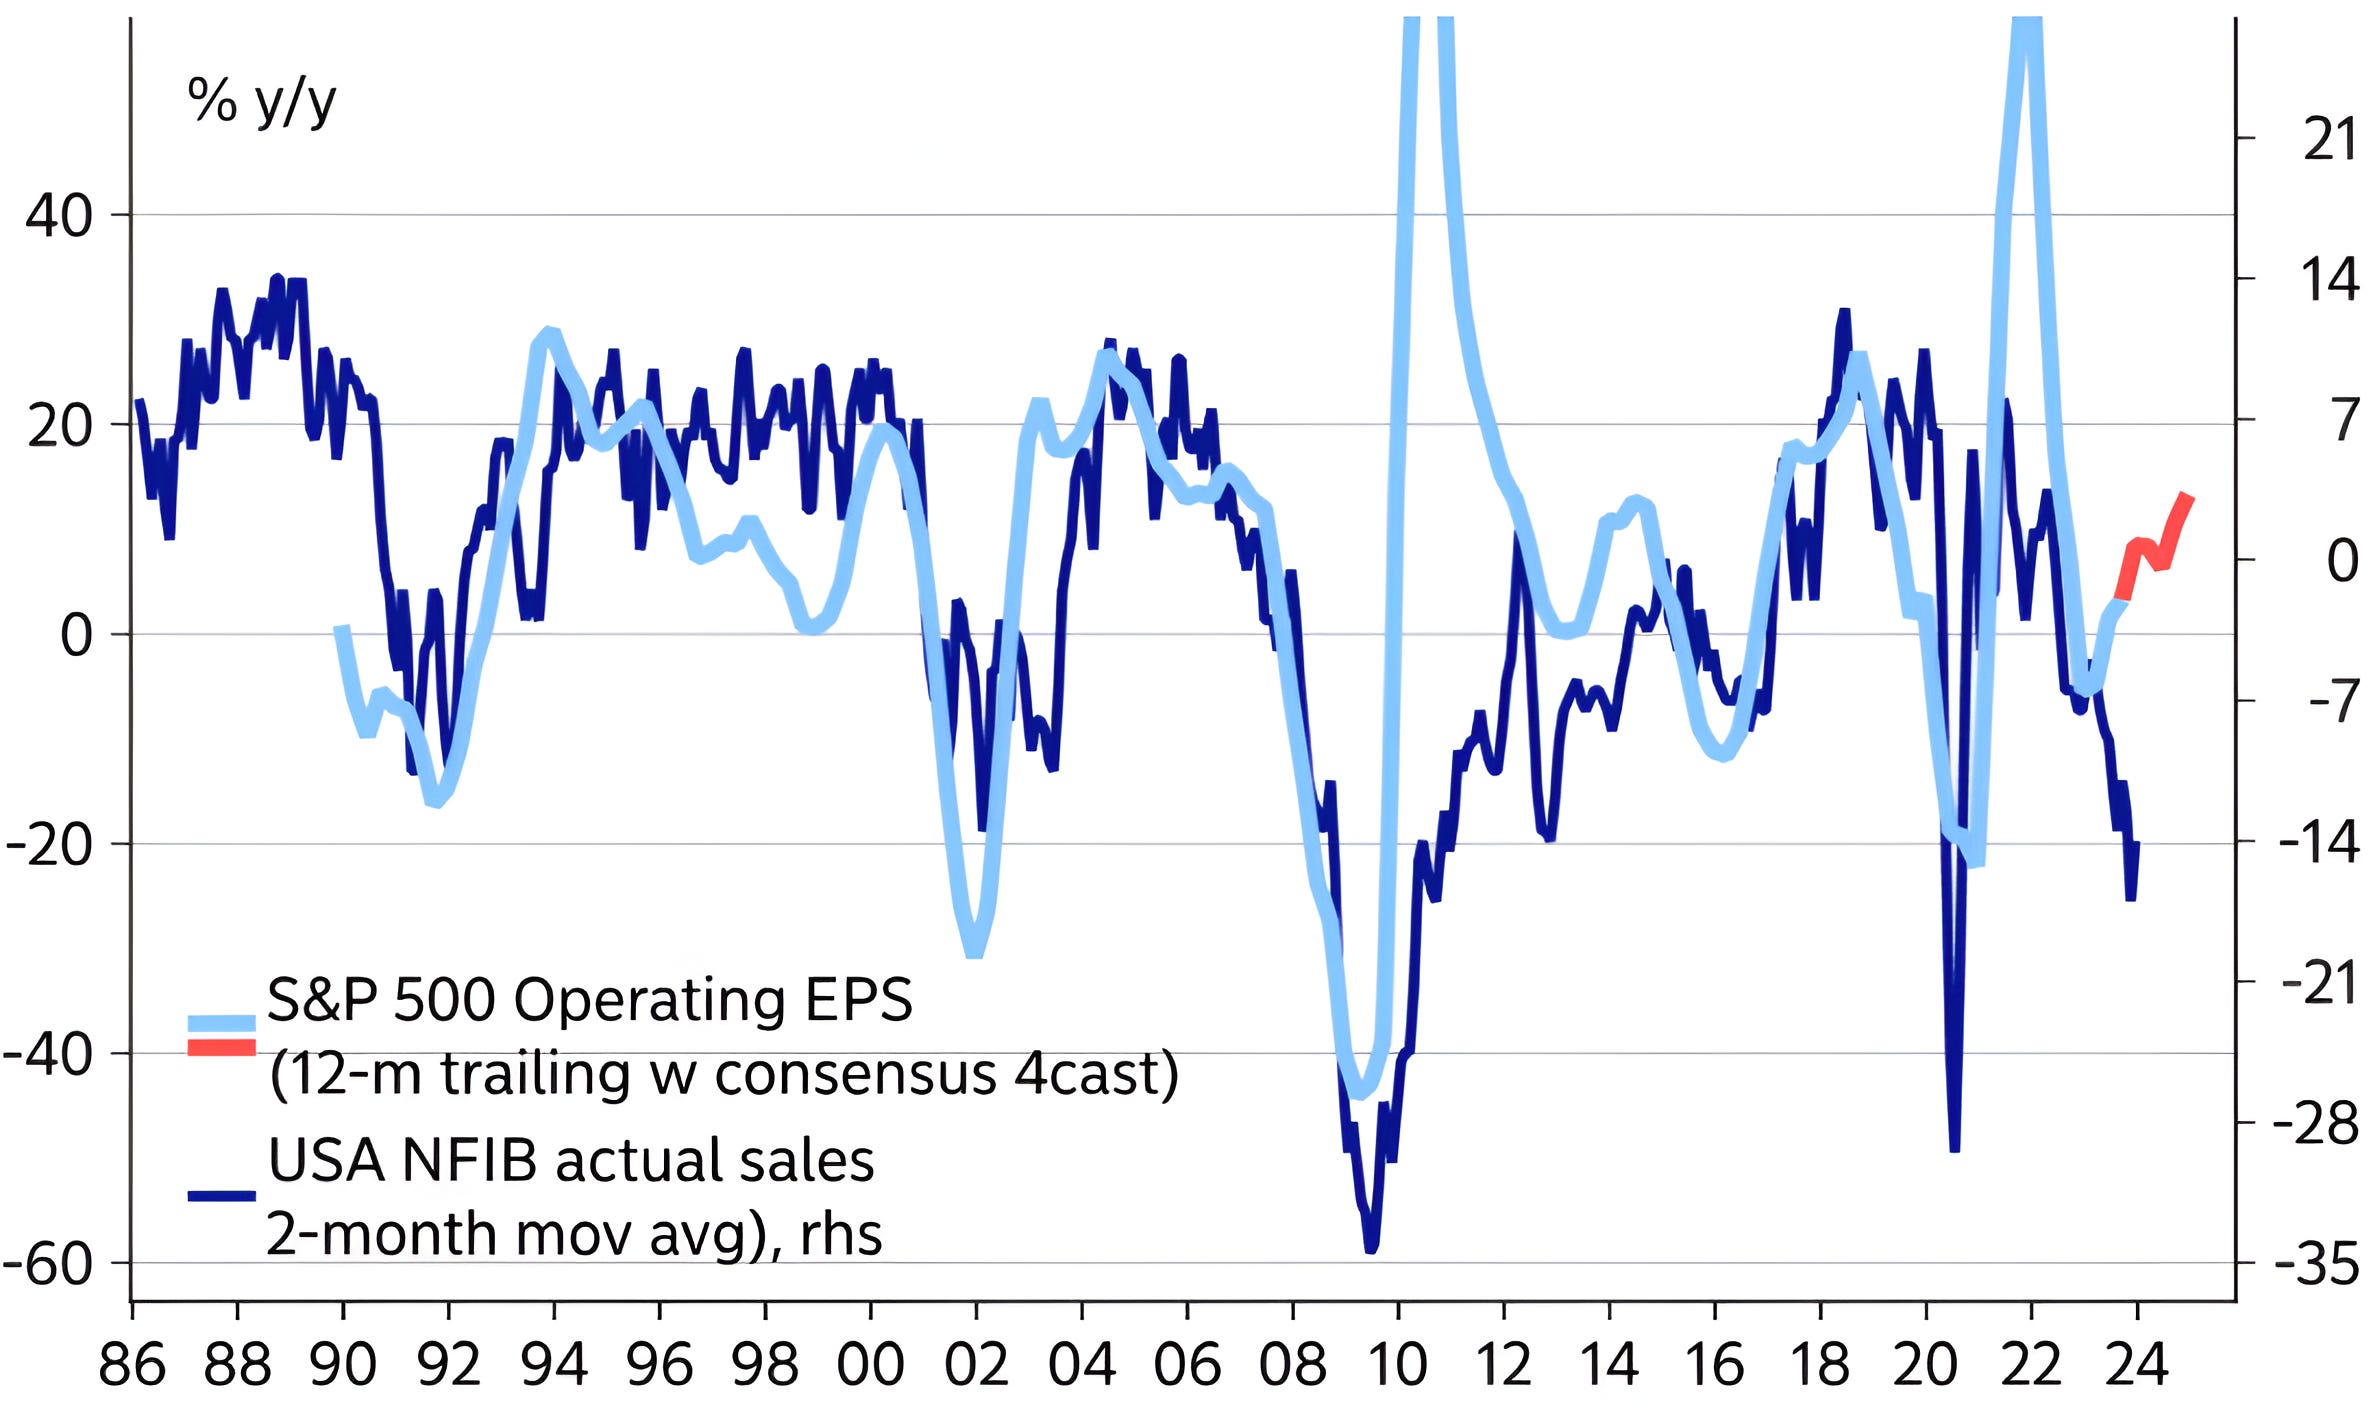
Below is a chart of the benchmark rate to ship a 40-foot container.
Global container shipping prices are being driven to their highest levels since covid as the Houthis are forcing ships away from the Red Sea and around Africa.
The Houthis are attacking ships in a 16 mile passage between Yemen and Djibouti that connects the southern Red Sea with the Gulf of Aden called the Bab el-Mandeb.
(For cocktail parties this weekend - Bab el-Mandeb roughly translates into "Gate of Tears" or "Gate of Grief.")
In general, container ships from Asia typically go from the Gulf of Aden to the Red Sea through the Suez Canal and into the Mediterranean. (The Suez Canal is at the (northern) top of the Red Sea and connects it with the Eastern Mediterranean Sea.)
Between 12% and 15% of the world’s shipping traverses this route.
As a result, the Houthis are having the greatest impact on global shipping since the “Ever Given” was wedged in the Suez Canal (March 2021).
Ships are being forced to around the Cape of Good Hope (South Africa) to reach their European destinations. From Asia, going around the Cape of Good Hope (red), versus the Red Sea/Suez (green) adds about 10 days and 3,300 miles to a one-way trip.
For now, the Houthis have focused on container ships rather than oil tankers.
Regardless, this could make the inflation story (and the Fed’s job and the US election) more complicated.
Source: Bloomberg. Through year-to-date 2024.
4. The US Fiscal Deficit - At Some Point this Will be a Problem
The Chart below shows the US Federal Surplus / Deficit (below the dark blue line) along with US recessions.
Typically, the deficit increases (chart moves lower) going into a recession as tax revenues decrease while the Federal government increases spending to spur growth.
As recessions conclude, the opposite dynamic often occurs as tax revenues increase and offset government spending leading to a smaller deficit (higher on the chart).
In the post financial crisis recovery, the deficit only climbed back to its long-term average (-2.8% / horizontal red line).
During covid, the US deficit as a % of GDP hit a 55 year low. Although it recovered, it never made it back to its average and since June 2022, despite economic growth and solid employment, the US fiscal deficit has been growing (chart moving lower).
Why does this matter?
First, if there is a recession, the US is already in a challenging fiscal position and will have lower tax receipts and will likely need to borrow more.
At some point, the Treasury market will care about the level of debt and the overall interest payments.
It will be difficult if interest rates move higher despite contained inflation. If that were to happen (interest payments have already increased and have grown larger than defense spending in the Federal budget) politicians will likely be forced to make difficult decisions with respect to higher taxes and less spending.
This is a big story that has received little attention.
We will provide further details, thoughts and updates on this but for now, it is something to keep on the radar.

Source: Bloomberg. Through year-to-date 2024.
5. The Market is Now Expecting Fed Cuts at Every Meeting Beginning in March
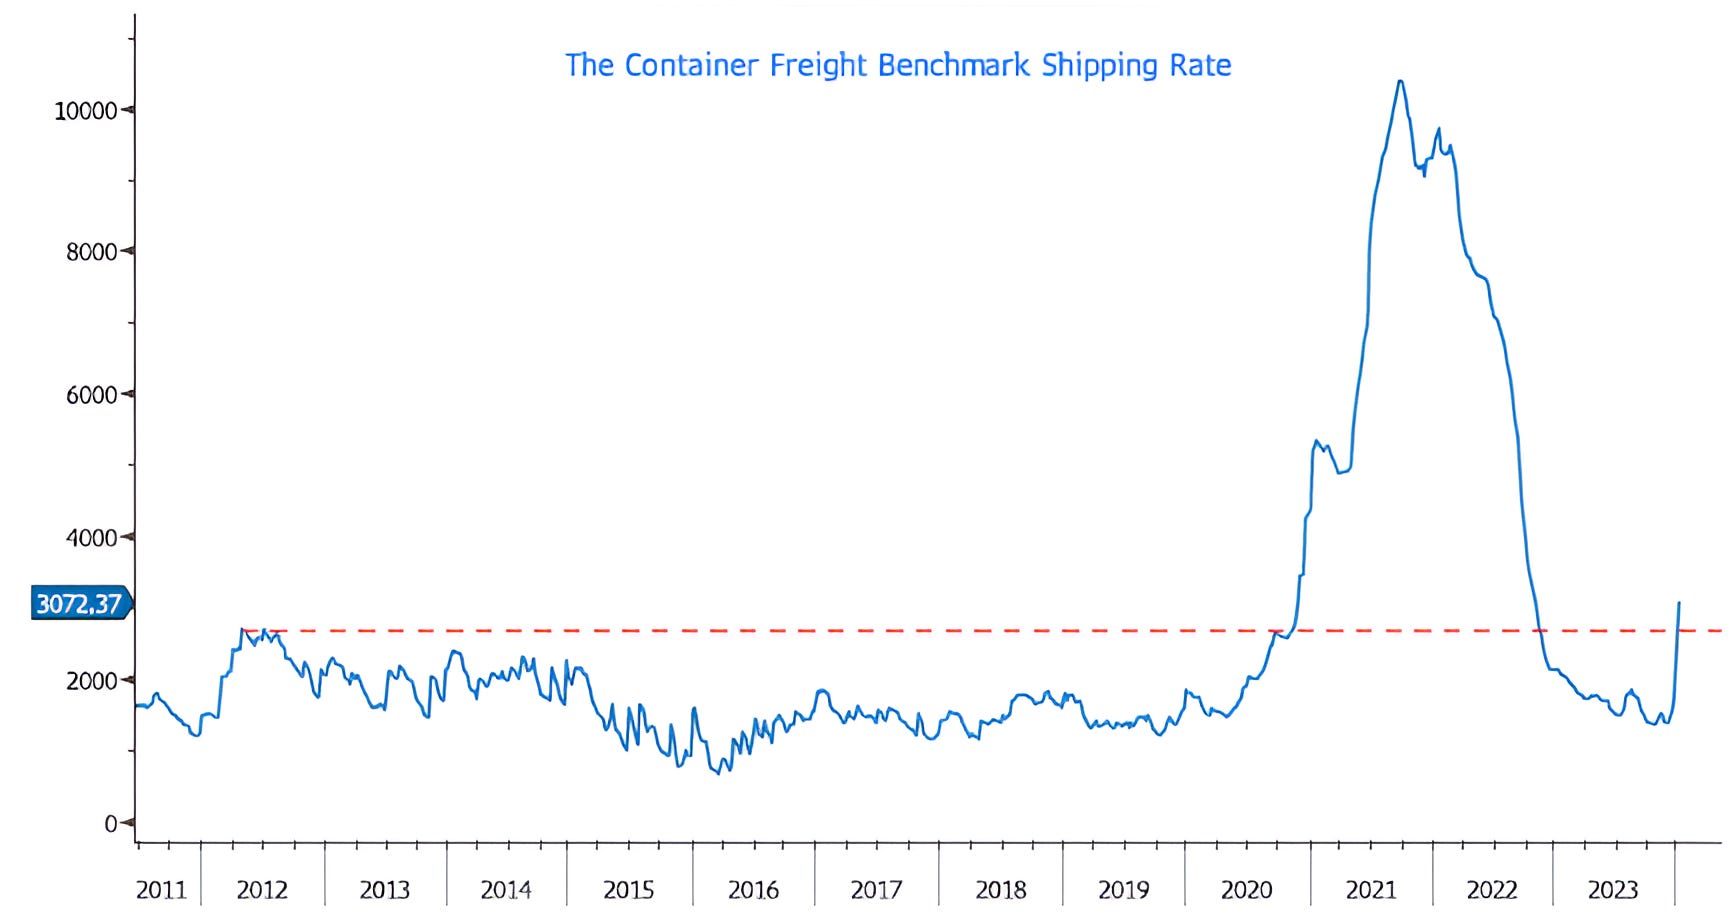
The chart below shows the number of Fed Funds cuts the market expects over the next year.
Despite mixed inflation data:
Last week’s employment report showed average hourly earnings +4.1% year over year vs. 3.9% expected and 4.0% in the prior period;
Yesterday’s consumer price index (CPI / inflation) report that came in above expectations on both the headline (3.4% vs. 3.2% expected) and the core ex-food and energy (3.9% vs. 3.8% expected); and
This morning producer price index (PPI) that was a little lower than expected, traders have incorporated and additional cut (from 6 to 7) into their expectations.
…over the past week, the market has priced in an additional Fed Funds cut.
In addition to traditional monetary easing (Fed funds cuts), there has been a growing expectation that the Fed will begin to moderate its Quantitative Tightening policy.
The outlook for easier monetary policy, in our view, was a significant driver of the Q4 equity rally and continues to be a key pillar of the equity story today.
However, as a reminder, at this point last year, the market expected the Fed to pause its rate hike cycle in March.