


The Everything Rally
The S&P 500, Nasdaq 100, Small Caps, Gold, Bitcoin, AI, Biotech, Semiconductors, Cocoa, Oil, Europe, Japan are all near or at recent or all-time highs. Even fixed income is rallying. Let's dig in...
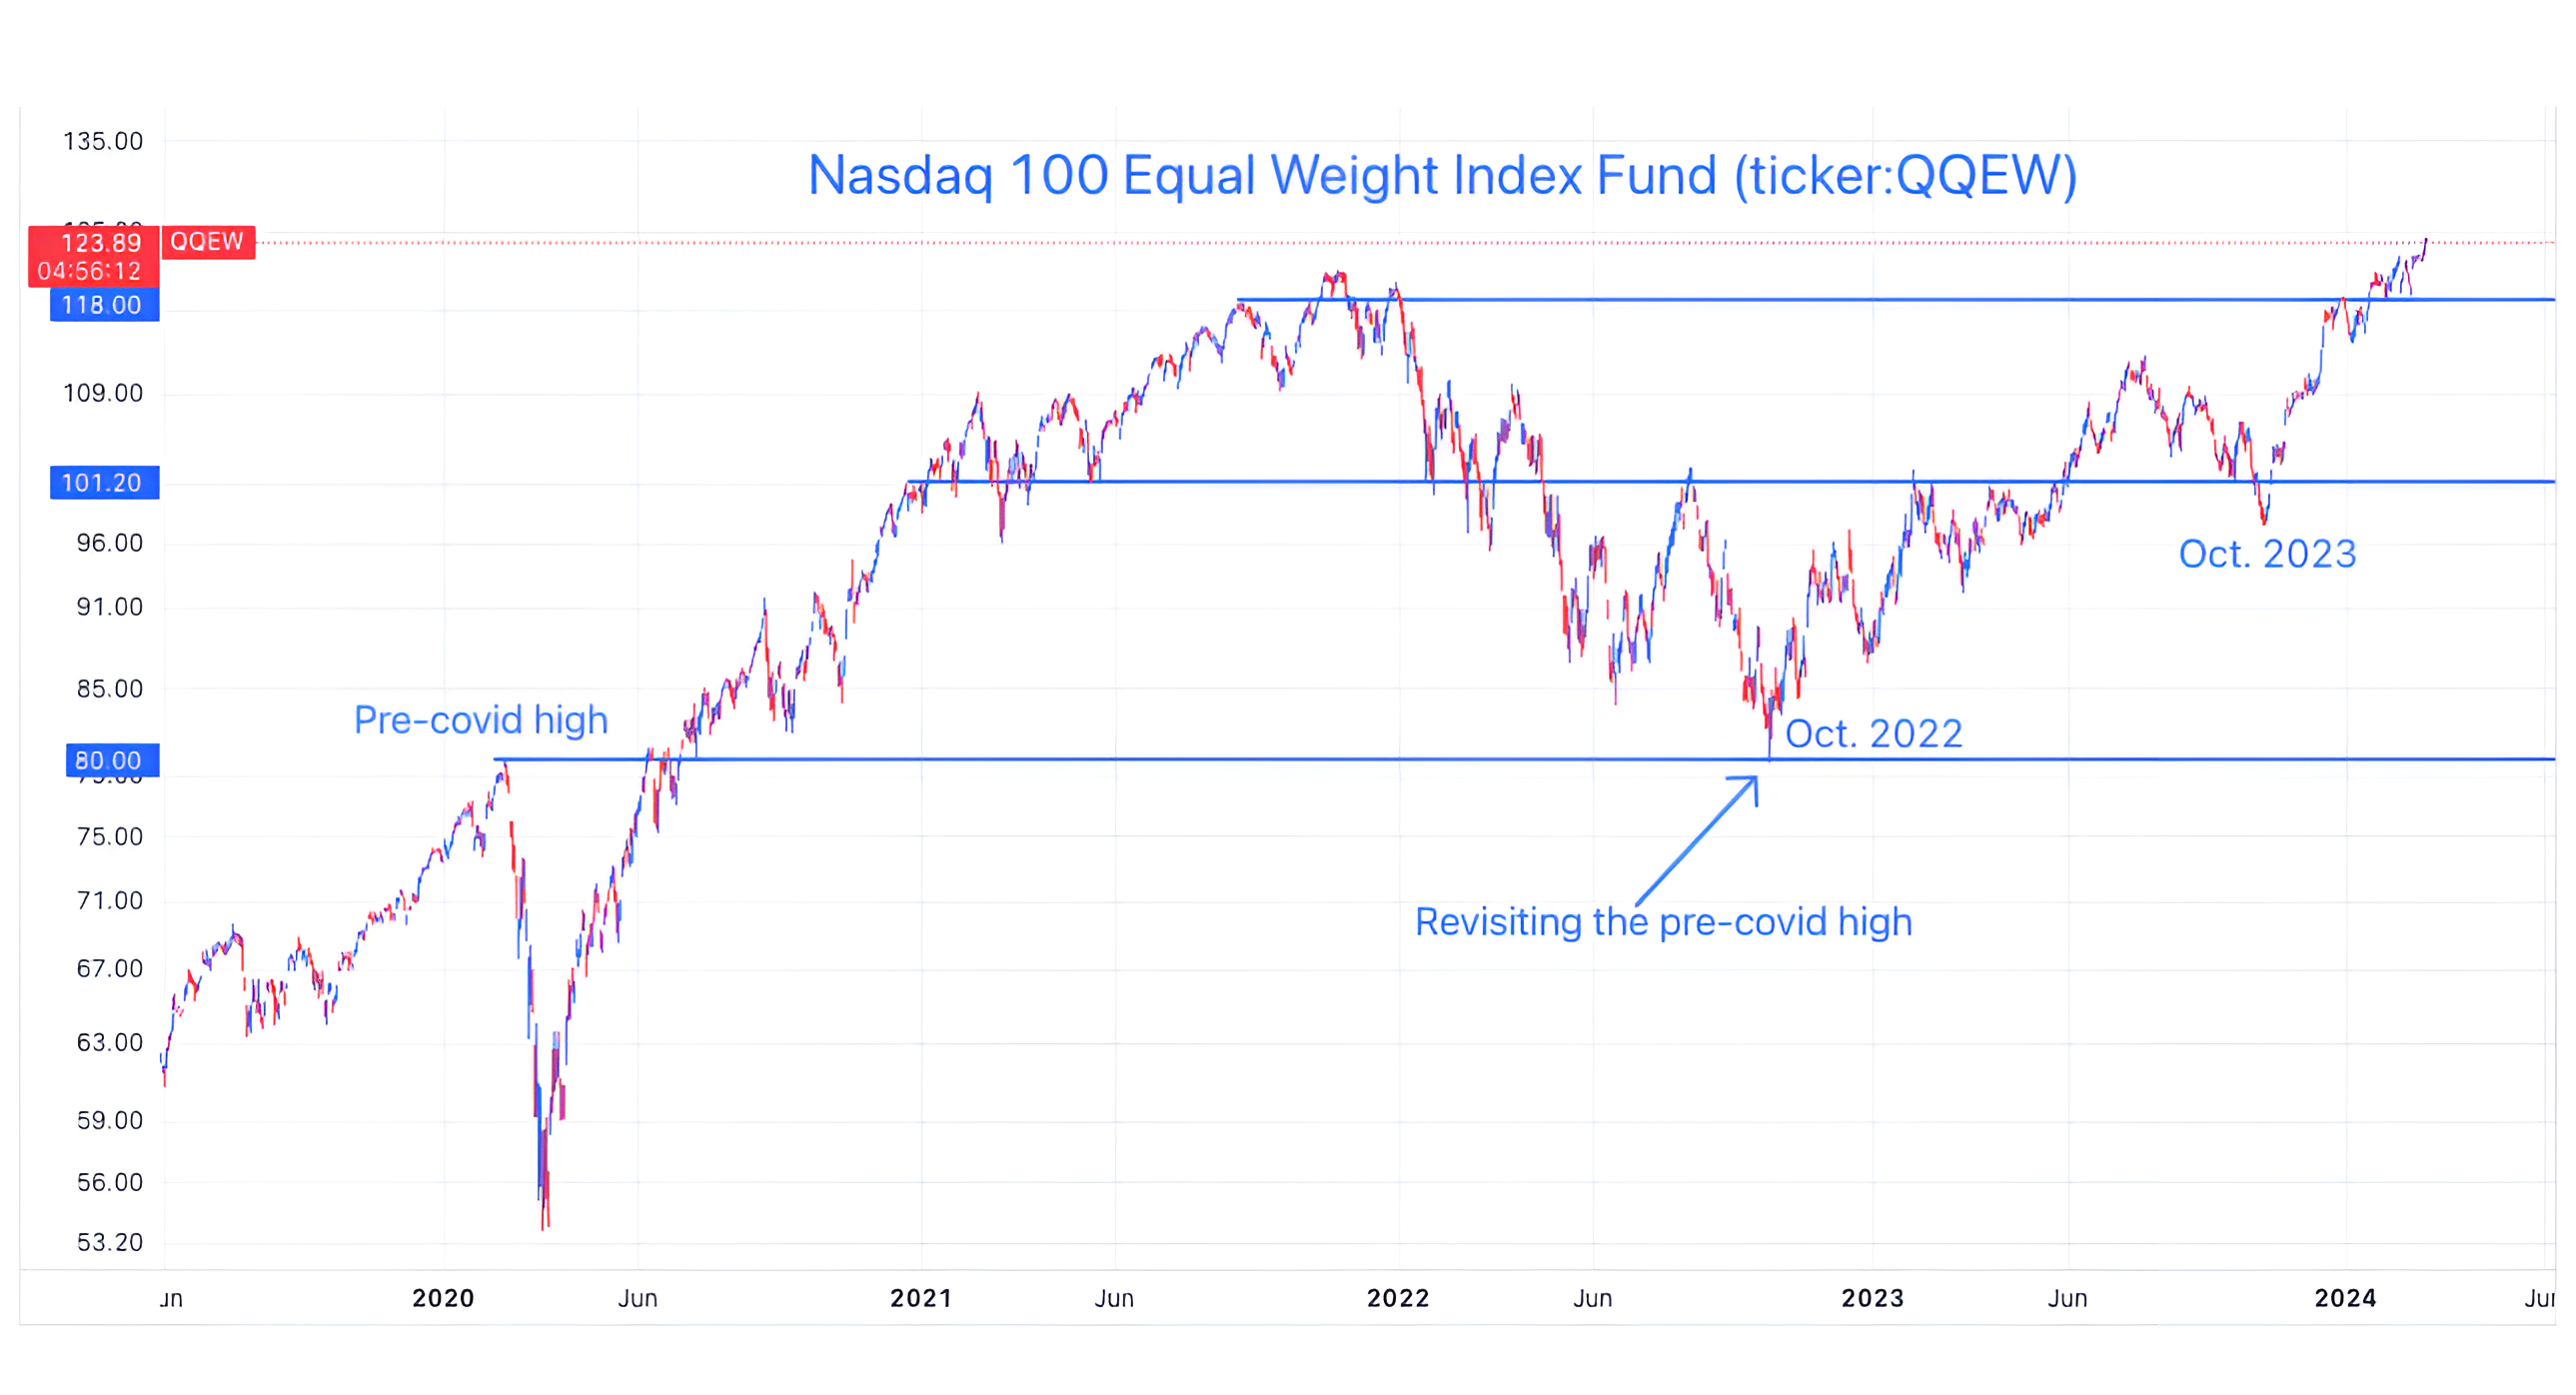
1. The Equal Weight Nasdaq 100: All-Time High
With the Equal Weight Nasdaq 100 at an all-time high, we want to reiterate that this year’s US equity rally is not limited to the “Magnificent 7.”
In addition to illustrating our point about the “Everything Rally”, there are a number of characteristics on the chart below that we believe warrant highlighting:
In October 2022, at its lows, the Equal Weight Nasdaq 100 revisited its pre-covid high (the lower horizontal blue line) nearly to the penny.
This is not one stock with simple price history, this is an index of 100 shares each trading on their own fundamentals.
While I can justify these moves by saying some large - or a group of large - quant funds and algorithms are dictating price, this still amazes me.
Although there are many that believe that the recent equity rally began in October 2023, the 3-year low of the Equal Weight Nasdaq 100 Index occurred in October 2022, at the same time as the recent low of the S&P 500.
Why is that interesting?
The US Dollar Index (dollar strength) peaked in late September 2022. (See Chart 5).
We often write that dollar strength and weakness is a key consideration when evaluating US equity markets, this is an example of why.
Finally, if the current move is sustainable (see Chart 2), based on this technical formation, it would suggest 30% upside in the Equal Weight Nasdaq 100 Index. (Past performance is not indicative of future results).
While the technical formation has taken 2.5 years to fully present itself and the upside potential, if it were to occur, would similarly take time to achieve, it is interesting to consider.
What will we look for to determine “confirmation” of the pattern?
A confirmation of the pattern for us would occur if price were to revisit (move back down) to the prior high area (top blue horizontal line) and hold that level and move higher.
We can see a “confirmation” move (as we tried to describe) in October 2023 (middle horizontal blue line), when the price of the Equal Weight Nasdaq 100 Index “revisited” the level that acted both as a floor (early 2021) and a ceiling (late 2022 / early 2023) and then moved higher.
Notably, price moved well above the the key level in 2023 and when it “revisited” it dropped slightly below before recovering and reflecting sustainability.
Clearly, the October 2023 dip in the Equal Weight Nasdaq 100 was “confirmed” as a sustainable “retest.”
(This is not a recommendation to buy or sell any security, it is not investment advice)
Source: TradingView. Through year-to-date 2024.
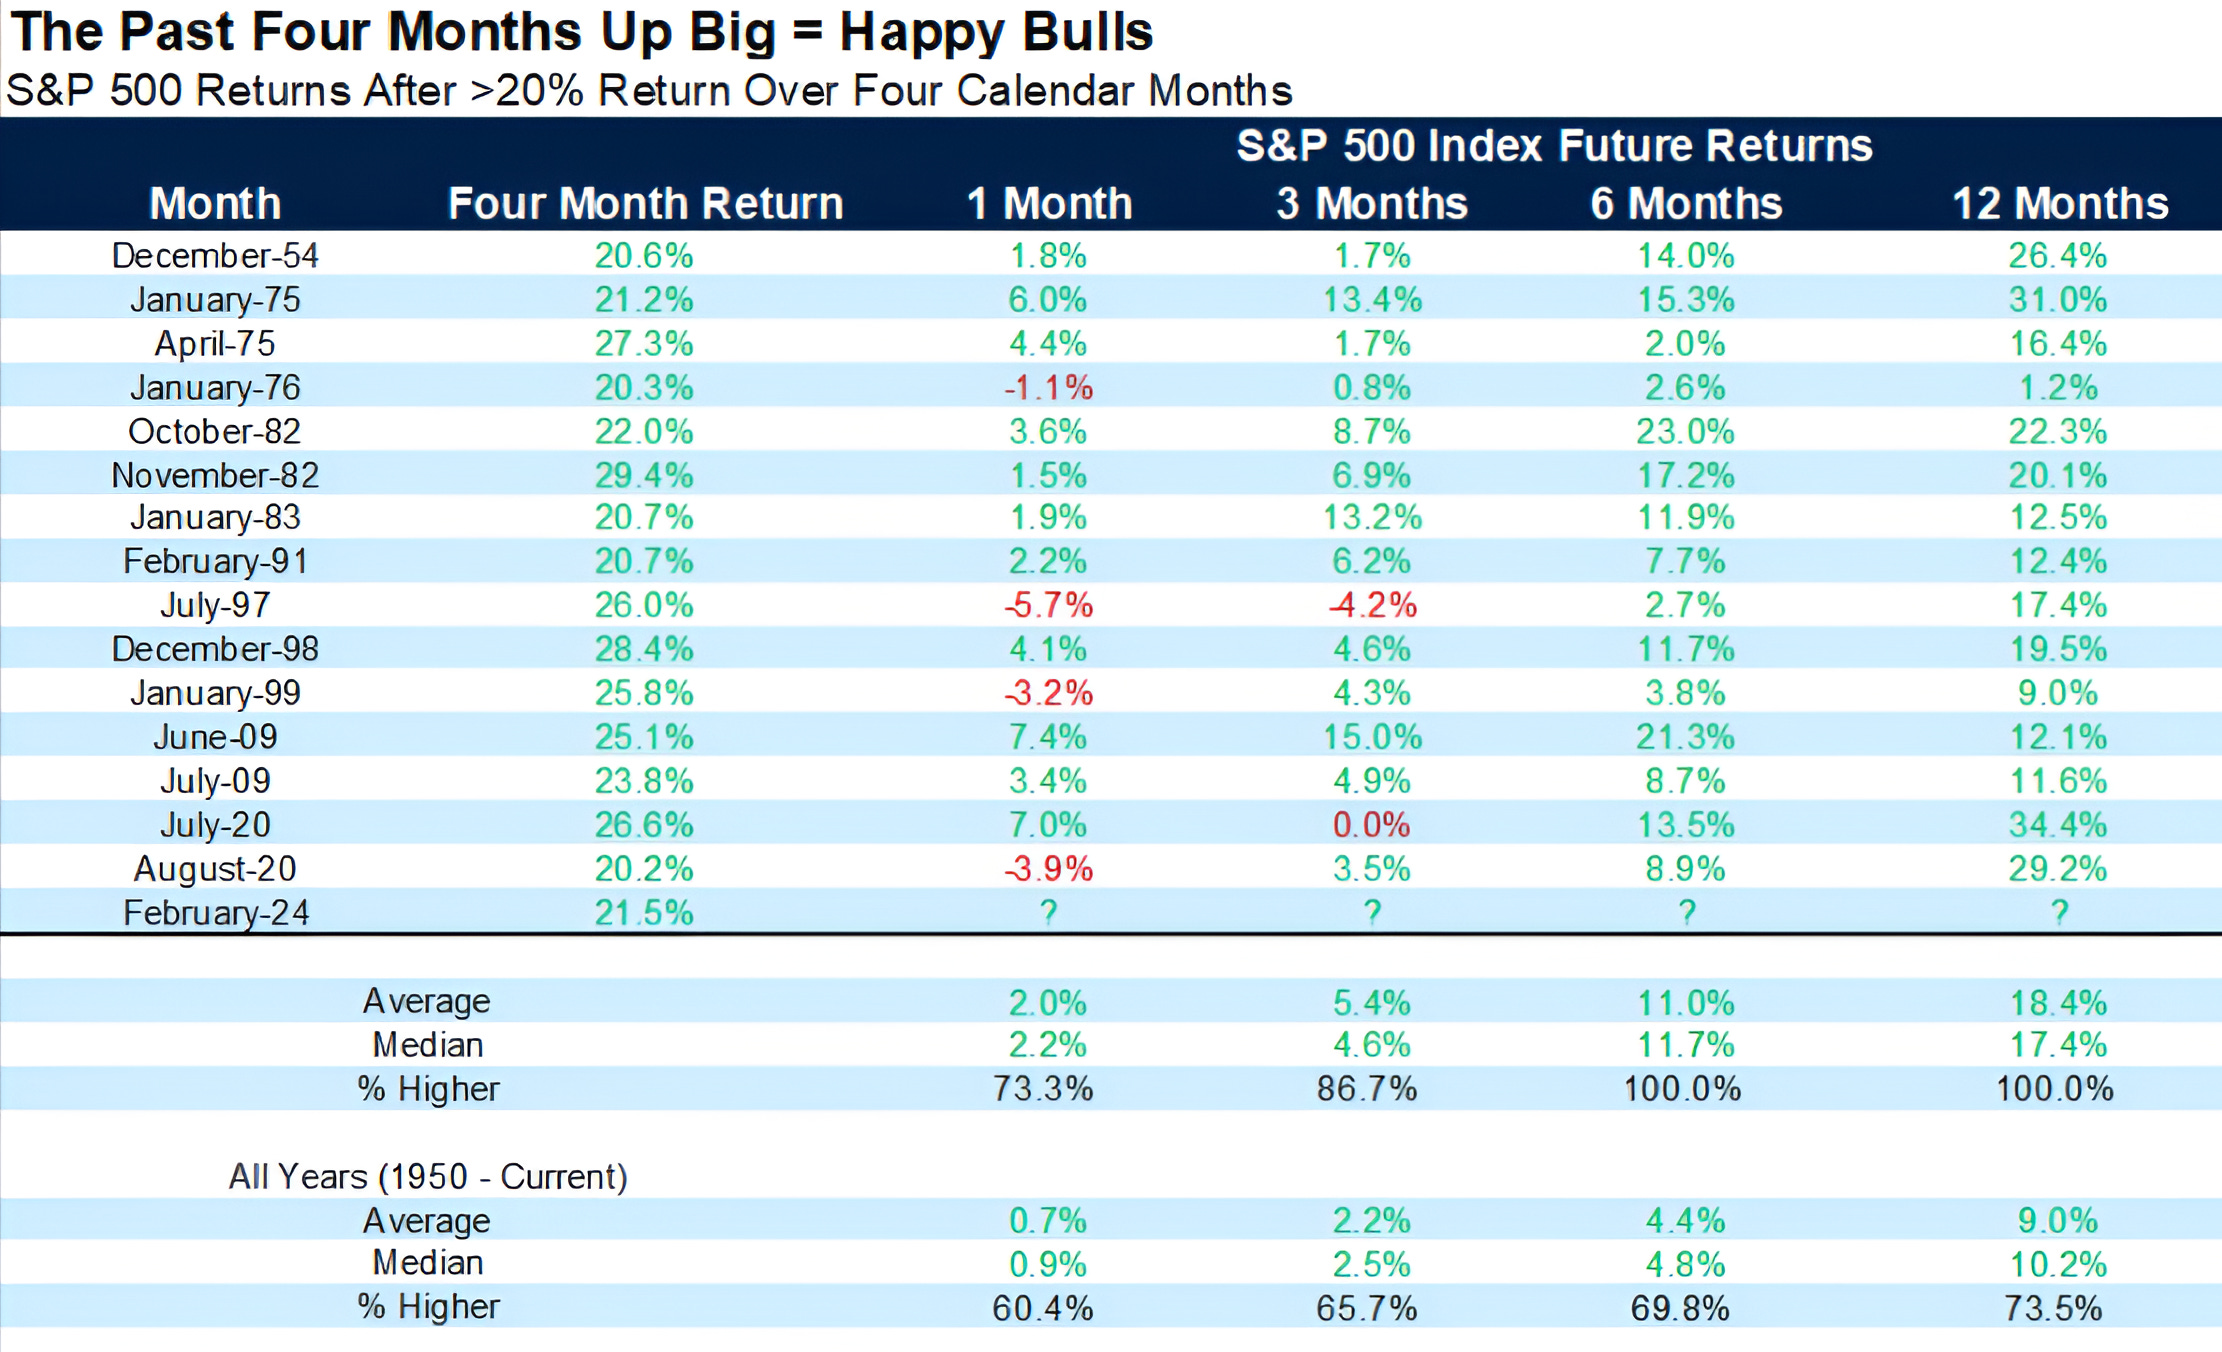
2. Strong to Quite Strong
The S&P 500 is up 21.5% over the past 4 calendar months. This has only happened 15 times since 1950.
The average returns after the S&P 500 has had a 20% return over 4 calendar months have been 11% 6-months later and 18% 12-months later. (Past performance is not indicative of future results).
The S&P 500 has not experienced a negative return in the 6 or 12-month period following a 20%+ gain over 4 calendar months. (Past performance is not indicative of future results).
Over the weekend, Bank of America raised its 2024 target for the S&P 500 from 5000 to 5400 (as a reminder Goldman raised their target to 5200 about a week ago).
The Bank of America target matches our view that we articulated on February 20:
“While our expectation for 2024 earnings is $235 (6%) growth, we think the upside in the index may be dictated by 2025 expectations (currently $275).
In the event that 2025 earnings remain around $275 (even if we do not believe they are achievable), even with slight multiple contraction, we could see a year-end S&P 500 level of 5400 (19.6x).
That said, we believe that security selection and sector weightings will continue to be significant drivers of performance.”
Similar to Bank of America, we believe that the S&P 500, after 4 strong months, could be due for a correction.
(This is not a recommendation to buy or sell any security and is not investment advice)
Source: Carson Investment Research, FactSet. Through year-to-date 2024.
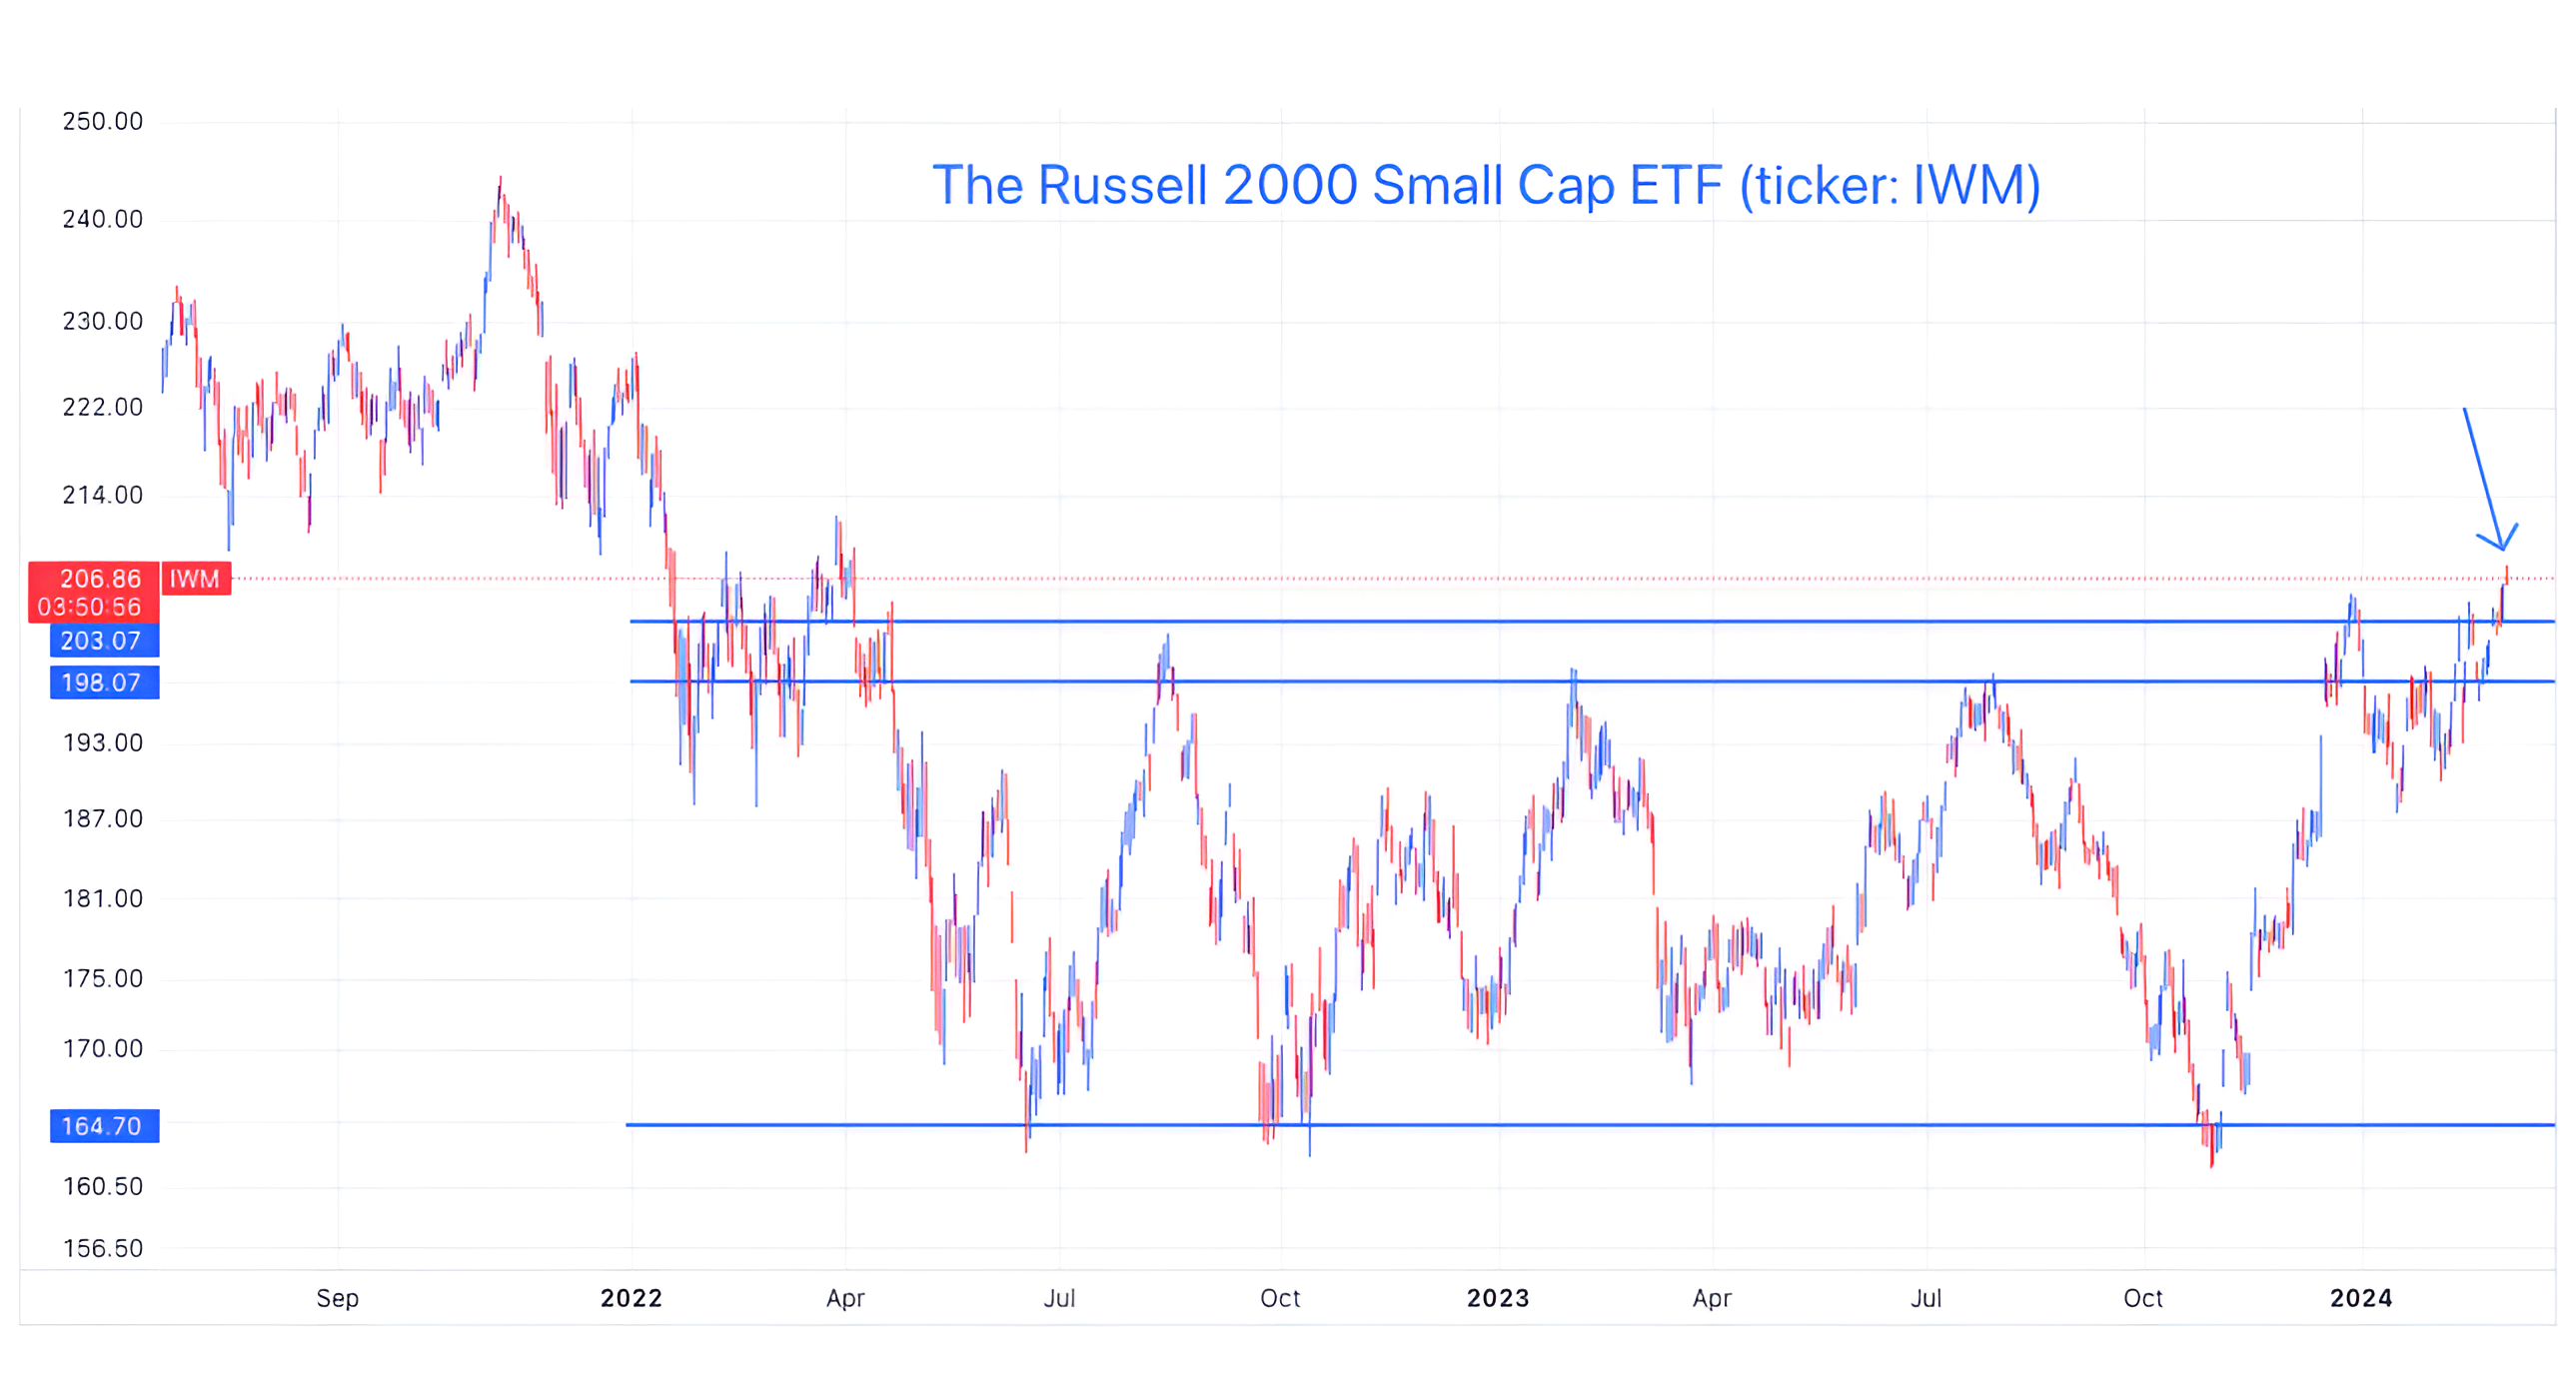
3. Welcome to the Party Pal: Small Caps
After 2+ years and several attempts, the Russell 2000 Small Caps have moved above their trading range and have hit a 52-week high.
Small caps are often seen to be more sensitive to domestic economic growth than their larger-cap cousins and any sustainable move higher may be an indication of investors perception of a soft landing.
While we are encouraged by this move, we would note that the current level is at the higher end of a former “battle zone” area (early 2022 - the earliest period of the top 2 horizontal blue lines).
As we’ve described in the past, there is substantial “market memory” in these areas and moving sustainably above areas like these can sometimes present a challenge.
Although we view the move in Small Caps as a positive and another piece of the “Everything Rally,” we want to be sure this move is sustainable and not another attempt to move higher that the market ultimately rejects.
(This is not investment advice).
Source: TradingView. Through year-to-date 2024.
4. All that Glitters…
Although it’s one of the oldest forms of currency, Gold only really only has a 53-year modern price history.
After World War 2, 44 countries met in Bretton Woods, New Hampshire and agreed to keep their currencies fixed to the dollar, and the dollar was fixed to gold. This established the dollar as the world’s reserve currency.
In 1971, there were more foreign-held dollars (because of trade and foreign aid) than the United States had gold making the US vulnerable to a run on gold. As a result, President Nixon ended the Bretton Woods international monetary system. (This is simplified - for a deeper history go here).
We believe that the post 1971 de-pegged gold behavior is likely a more relevant indication of investors attitudes and perceptions towards the precious metal than the pre-1971 history.
Many investors have considered Gold, which has little industrial use, an inflation hedge.
However, looking at the price history of the precious metal vs. US inflation indicators, it is difficult to find any consistent correlation.
I consider Gold an uncertainty hedge.
When investors become uncertain about the economy or policy, they often buy gold.
Warren Buffett has said:
“Gold is a way of going long on fear, and it’s been a pretty good way of going long on fear from time to time. But you really have to hope people become more afraid in the year or two years than they are now.
And if they become more afraid you make money, if they become less afraid you lose money. But the gold itself doesn’t produce anything.”
With the price of gold challenging its all-time highs, we might ask what investors are afraid of?
Looking at the chart, we have drawn in a “cup (the large arc) and handle (the smaller arc)” pattern.
If this pattern were to be “confirmed” by higher prices, the measured target for gold (based on technical analysis theory - not necessarily our views) would be north of $2,600 per oz.
(This is not a investment advice and is not recommendation to buy or sell any security).

Source: TradingView. Through year-to-date 2024.
5. The Key to it All: the Dollar
The Dollar is currently fighting an interesting battle.
It is at the level that marks the 0.236 Fibonacci retracement of its September 2022 to February 2023 sell-off.
This area has acted as a ceiling and a magnet for the Dollar over the past year.
We have continually highlighted that moves in the Dollar are often inverse to those in the equity market. In other words Dollar strength has often foreshadowed equity weakness and vice versa. (Past performance is not indicative of future results).
Despite this relationship, US equities have ignored the year-to-date strength in the dollar. In our view, a meaningful move higher from current levels may catch the attention of investors.
As a result, we see the resolution from the Dollar’s current battle-zone area (either higher or lower) as an important one - the Everything Rally may be depending on it.
(This is not a investment advice and is not recommendation to buy or sell any security).
