Tis Only a Flesh Wound*
Equities have had a strong rebound after Tuesday's sell-off, but as we've been highlighting there is damage under the surface, earnings / valuation are challenging and macro is tough. Let's dig in...
* For those not familiar with the iconic sword fight in Monty Python & the Holy Grail, in the scene, a fictional King Arthur fights the Black Knight who will let no one cross a bridge.
After a short battle, the Knight's left arm is completely severed. Copious amounts of blood are streaming out, but the Knight refuses to stand aside, insisting "Tis but a scratch", and fights on.
Next, his right arm is cut off, but the Knight still does not concede. "Tis but a flesh wound." The Knight ends up with both arms and legs completely cut off and still refuses passage over the bridge.
From Wikipedia: “The Black Knight suffers from unchecked overconfidence and a staunch refusal ever to give up.”
I am not sure whether the bears or the bulls are the Black Knights of this market, but I see investors committed to both sides.
With many challenging underlying conditions - questionable earnings; elevated valuations; a historic weekly win streak in the index; higher 10-Year Treasury yields; tighter than expected Fed; deteriorating support “under the surface;” stronger dollar (chart 3) (we’ve highlighted all of these) - Tuesday’s sell-off seemed like an “only a flesh wound” moment to us
In our view, the market can likely take one or two more significant one-day sell-offs.
Based on the quick recoveries over the past of the past 4.5 months, investors will be confident that the sell-off is meaningless, and that’s when a deeper draw-down can occur.
That said, we have been careful not to over-react (we learned our lesson last year with imbalances that remained while the S&P 500 rose 20%+) and to stay open-minded.
1. Data Mining, A Flesh Wound or Meaningful?
On Tuesday, over 90% of the volume in the New York Stock Exchange (NYSE) was down.
The chart below shows the times that this has occurred within 3 sessions of an S&P 500 record high.
My former analyst would tell me this is data mining or because its happened only 4 other times in the past 25 years that it is not statistically significant.
But as can be seen, these 90% down volume days that have occurred within close proximity to all-time highs have been a cautionary signal in the past. (Past performance is not indicative of future results).
All of that said, on the other side of the ledger, the past two days have seen a rapid recovery - today had 83% of positive volume while yesterday was a 79.5% positive volume day.
Two 80%+ upside days after a 90% downside day are said to be significant (and bullish). (h/t Walter Deemer).
Does yesterday’s 79.5% count?
I am not sure where I come out on all of this.
However, last year when signals like these were screaming that the market would head higher, while economists were calling for a recession and fundamentals were challenging (valuations were elevated and there was no earnings growth) - I learned to at least acknowledge the technicals.
While I am skeptical of the underpinnings of the current equity market and it often feels as though it is built on a foundation of quicksand, I have been careful not to over-react.
Like Chuck Prince, the former CEO of Citigroup said in 2007, “As long as the music is playing, you’ve got to get up and dance.”
Well, the music still seems to be playing, we are continuing to dance, but we have our eyes on the seats just in case the music stops.
(This is not investment advice)
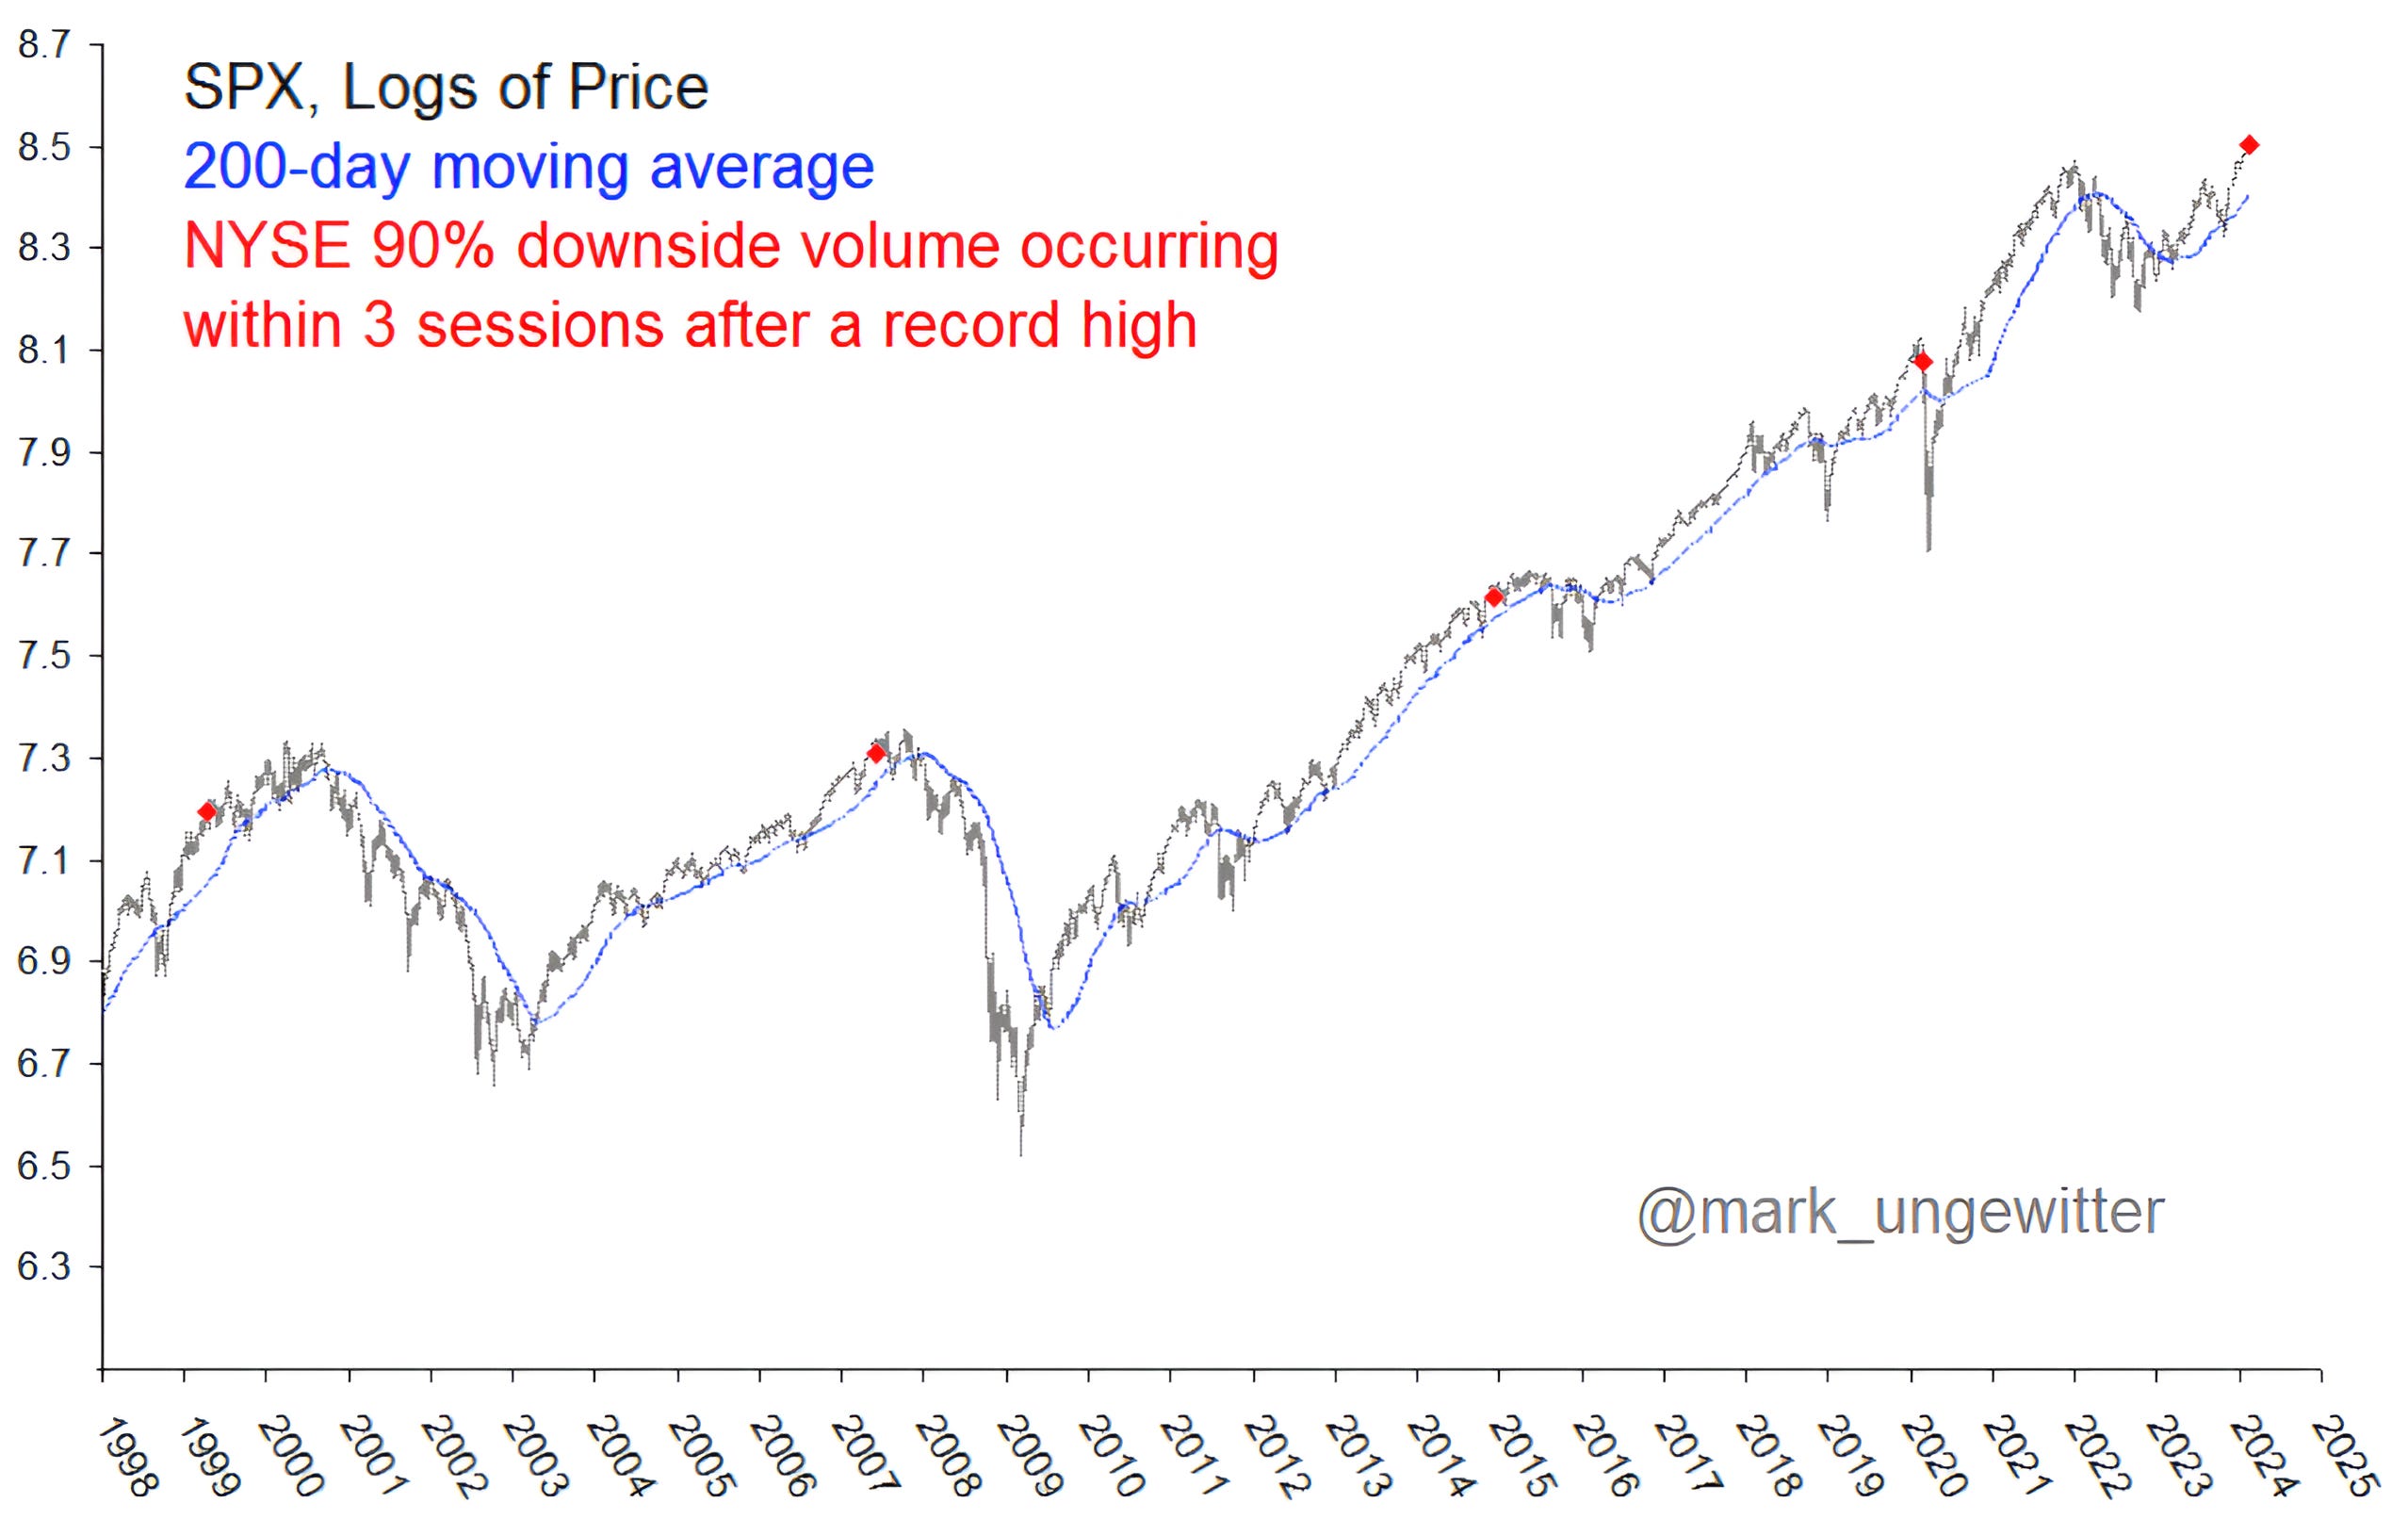
Source: Mark Ungewitter on X. Through February 13, 2024.
2. Canary in a Coal Mine or Nothing?
Truthfully - I’m not sure.
Despite ubertight (a technical term) credit spreads, a default cycle has begun according to Apollo’s Chief Economist, Torsten Slok.
Please note, these are speculative grade credits, and we will need to watch a) whether default rates continue to move higher and b) if challenges begin to transcend into higher credits.
For now, definitely something to keep on our radar.

Source: Apollo Chief Economist and Moody’s Analytics. Through January, 2024.
3. Watching the Dollar…
Below is a chart of the Dollar Index (DXY).
During the first half of 2022, as the dollar strengthened, the S&P 500 sold off.
As the dollar peaked in September 2022, the number of 52-week lows in the NYSE stopped growing and the S&P 500 stabilized as some sectors bottomed.
More recently, from July 2023 to October 2023, as the dollar strengthened, the S&P 500 once again fell.
With the peak in the dollar, equities recovered.
In other words, the dollar has been inversely correlated with US equities. (PAST PERFORMANCE IS NOT INDICATIVE OF FUTURE RESULTS).
In the most recent period, the dollar bottomed at the end of December. This was nearly concurrent with the peak in 52-week highs. However, we have seen no weakness in the headline index.
The dollar has recently moved above a battle zone (the middle blue shaded area) that has acted as both a floor and a ceiling over the past two years.
We have drawn in a reverse “head and shoulders” formation (the three light green curves on the far right of the chart).
If this technical pattern were to be confirmed, the measured move of the dollar (based on technical analysis) would be back to the October high and the top blue shaded area.
In our view, if the reverse “head and shoulders” formation were to be confirmed and the dollar moves higher in accordance with the technical pattern, it could will likely put downward pressure on US equities.

Source: Bloomberg. Through year-to-date 2024.
4. Chinese Population
Ever since reading Jurassic Park - a book about gene splicing and chaos theory - I have been intrigued by the challenge of unintended consequences.
In fact, along with supply and demand, the idea of unintended consequences is one of the few rules of economics (although it applies across sciences) in which I believe.
In 1980, China implemented its “one child policy.”
From the Wall Street Journal:
“A Moscow-trained missile scientist led the push for China’s policy, based on tables of calculations that applied mathematical models used to calculate rocket trajectories to population growth.”
How could that go wrong?
Last year, births in China dropped by 500,000.
“Officials cited a quickly shrinking number of women of childbearing age—more than three million fewer than a year earlier—and acknowledged “changes in people’s thinking about births, postponement of marriage and childbirth.”
The modeling failed to take into account the traditional preference for sons. If couples could only have one child, they would prefer to have a boy.
Young women are now at the core of China’s demographic dilemma. They are increasingly reluctant to have children—and there are fewer of them every year.
Following the data release, researchers from Victoria University in Australia and the Shanghai Academy of Social Sciences predicted that China will have just 525 million people by the end of the century. That’s down from their previous forecast of 597 million and a precipitous drop from 1.4 billion now.”
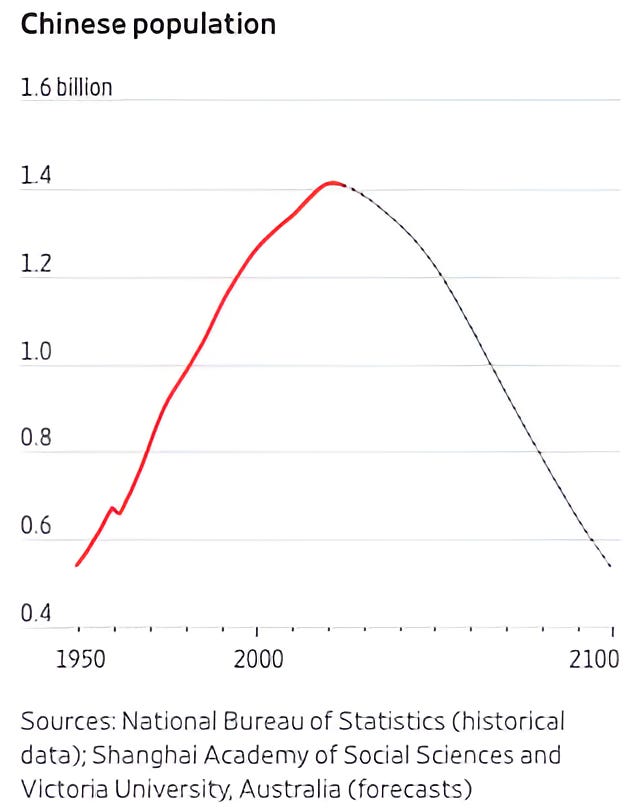
Source: Wall Street Journal. Through year-to-date 2024.
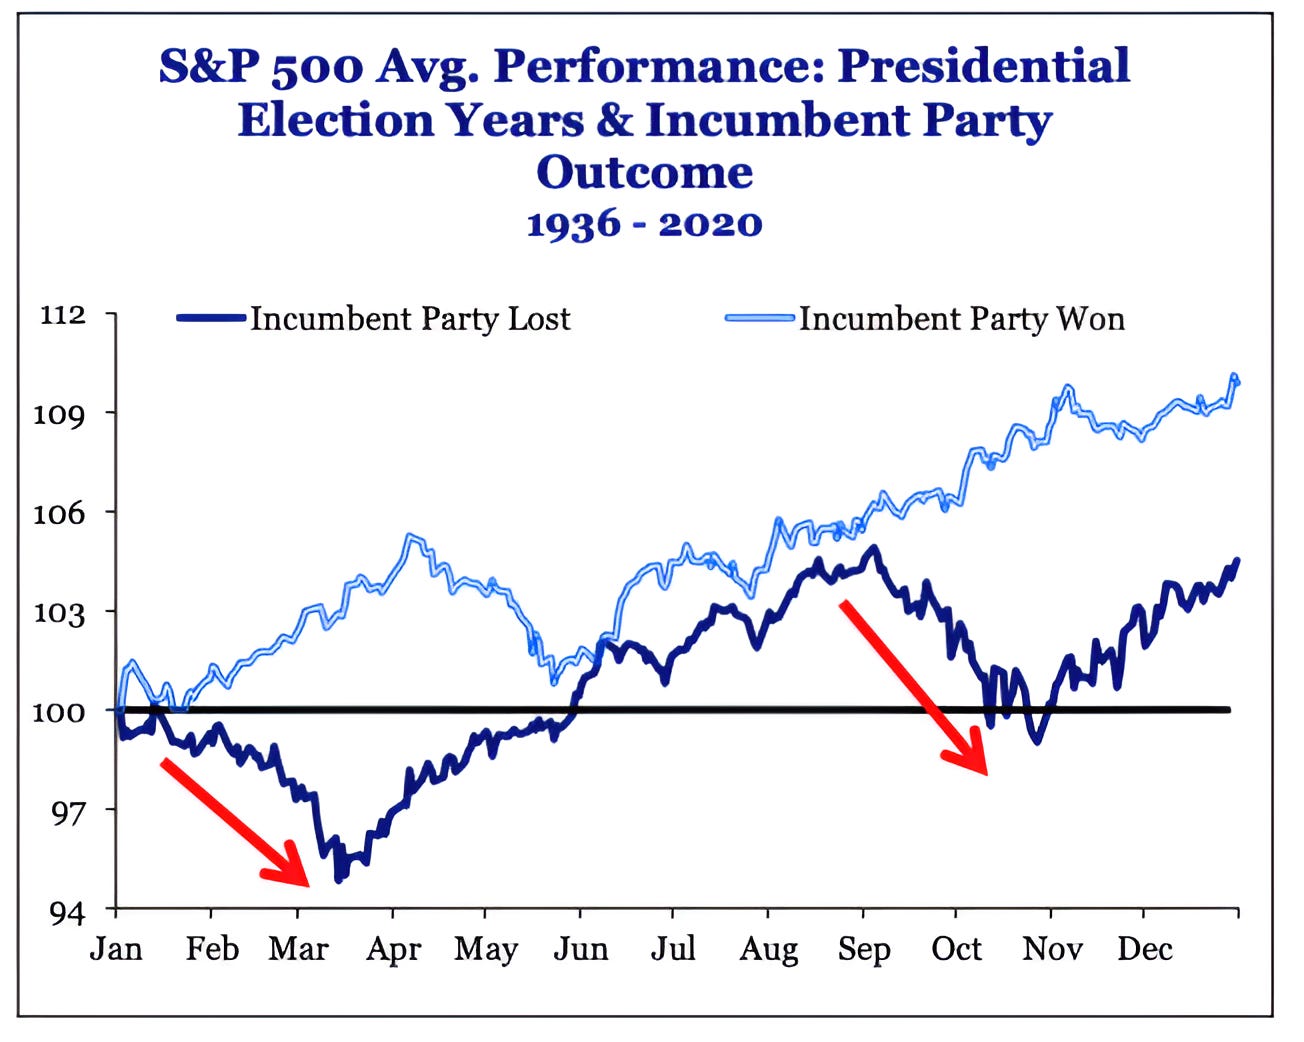
5. Do Market’s Dictate Presidential Elections or Do Presidential Elections Dictate Markets?
The chart below from Strategas’ Dan Clifton (the best independent research house and the best Washington strategist - by far) is incredible.
We have shown the election year seasonality chart several times and highlighted the S&P 500 softness in February. (Past performance is not indicative of future results).
The chart below breaks down the election year equity cycle into those years in which the incumbent party has has won or lost.
While I am not sure if this is predictive, reactive or meaningless in the current environment, I wanted to share it.
We have also shown the last two weeks of February are the weakest on the calendar (h/t Goldman Sachs). (Past performance is not indicative of future results).
As we always write when highlighting seasonality, this is not something that will dictate our investment view or positioning, but it is something of which we want to be aware.