


Valuation is Elevated. Does It Matter?
Yesterday, we reviewed earnings and earnings expectations. Today, we wanted to look at valuation.
1. The S&P 500 is Trading at a Premium Valuation
We often say that equity valuation is a measure of risk rather than a catalyst.
What this means is that just because stock or index appears expensive doesn’t mean it will go down and simply because an asset seems cheap, it doesn’t mean that price will move higher.
A high valuation does, however, mean that there’s a long-way to fall in a “risk-off” environment.
Looking at the valuation of the S&P 500, below, it is nearly 1 standard deviation above the long-term average and is near its highest levels outside of the two valuation bubble periods (dot-com and post-covid) of the last 25 years.
Still not a catalyst.
That said, from current levels, we see limited scope for significant multiple expansion.
On the other hand, in the event of bad news (earnings disappointments, inflation fears, growth slowdown / recession), valuation multiples could contract back towards the 15x PE that the S&P 500 had in September 2022 (the low of the current cycle). To be clear, this is not our current expectation, but a possibility.
That said, thus far, the PE expansion of the current period has been normal - see Chart 3. (Past performance is not indicative of future results).

Source: Bloomberg. Through year-to-date 2024.
2. Another Way to Consider S&P 500 Valuation
As can be seen on the chart below, the S&P 500 is at the 90th percentile of its historical valuation range.
Despite the fact that most other regions are both less expensive than the US and less expensive relative to their respective historical valuations, these conditions have been in place for some time and have not acted as a catalyst for performance (absolute or relative). (Past performance is not indicative of future results).
Later in the week, we will review other regions to see if we can identify areas where we can identify potential opportunity.

Source: Goldman Sachs. Isabelnet.com. Through year-to-date 2024.
3. Valuation Often Expands Before Earnings Growth “Kicks In”
Below is a chart that shows PE multiple contraction and expansion around significant S&P 500 sell-off and recovery cycles.
The low during the current cycle occurred in September 2022.
On average, the first year of a bull market produces a 40-50% multiple expansion as the market anticipates the earnings bottom that typically follows a few quarters after the low. (Past performance is not indicative of future results).
As we showed yesterday, S&P 500 earnings growth for 2023 is expected to be around 1% while growth in 2024 is forecast to be 10-11%.
What this means is that barring a recession or other negative surprise, S&P 500 valuation may remain relatively stable with equity market appreciation driven by earnings growth.

Source: Fidelity, Bloomberg, Haver Analytics, FactSet. Through year-to-date 2024.
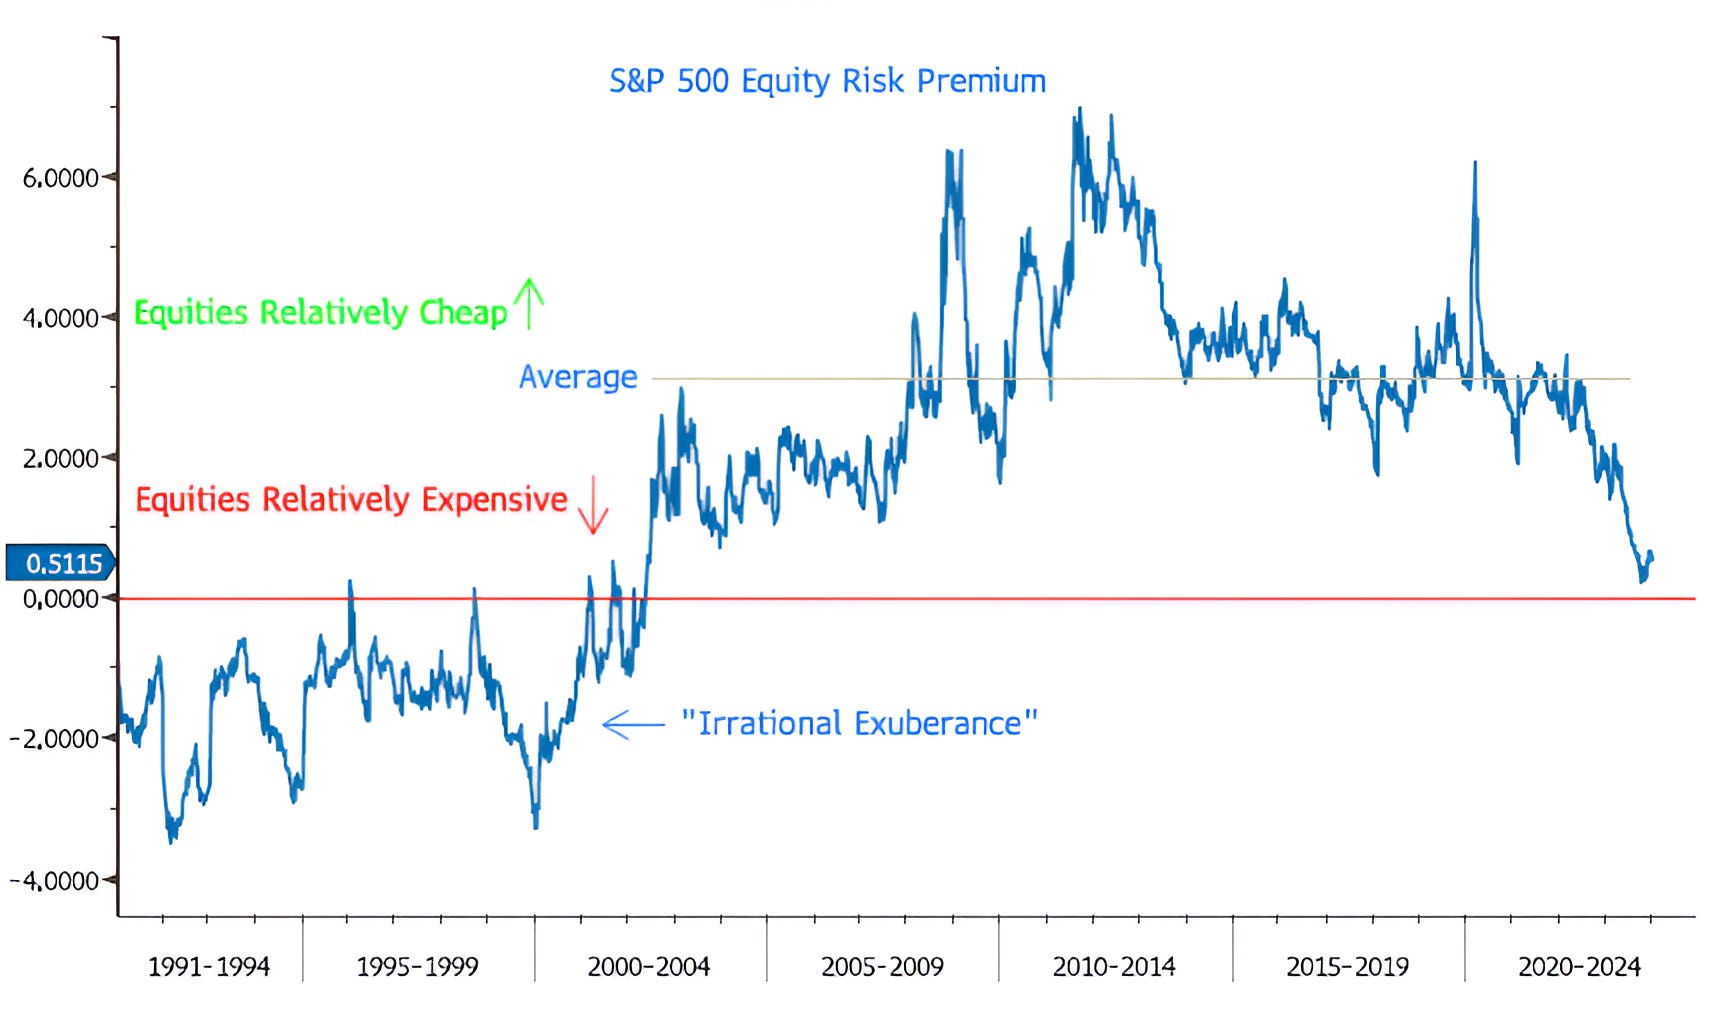
4. Equity Risk Premium
Equity risk premium compares the valuation (PE) of equities to the risk free rate (typically, and in the case below, the 10 Year US Treasury yield).
By comparing the relative valuation of equities to a measure of fixed income, we can, at any point in the cycle, as asset allocators, make more informed investment decisions.
However, as stated above, valuation - even relative valuation in this case (or in Chart 2) - is not a catalyst.
In the late 1990s, when the PE of the S&P 500 was consistently over 20x and 10-Year US Treasury yields ranged from 5.5-6.5%, the Equity Risk Premium was negative. In 1996, Alan Greenspan famously characterized this as “Irrational Exuberance.”
However, as investors from 1996 to 2000 learned, the market can remain irrational longer than one might expect (and that many can remain solvent).
From March 1996 to 2000, while S&P 500 valuations were “irrationally exuberant” relative to Treasuries, equity investors made 131% or 23% per year vs. 26% or 6% annually in Treasuries.
That said, it is notable that the current Equity Premium is the most expensive relative valuation of the S&P 500 to 10-Year US Treasuries since the end of the dot-com bubble.
At some point, as in the game of musical chairs, the music will stop.
For the time being, however, we want to be aware and vigilant but not over-react.
Source: Bloomberg. Through year-to-date 2024.
5. One Final Chart on Valuation
The Chart below is similar to Chart 1, however, instead of considering the market-cap weighted “typical” S&P 500, it provides the historical valuation of the Equal Weight S&P 500.
In this index - as its name would imply - each of the 500 members of the Index are ascribed a weight of 0.2% rather than disproportionate weightings in the S&P 500 where the top 10 holdings currently represent nearly 31% of the Index.
We view the chart below as representative of the valuation of the average stock.
Currently, the average stock is trading at 15.7x expected earnings which is below the 14-year median. (There is less data on the Equal Weight Index).
The point here is that while all signs point to the S&P 500 carrying a premium valuation, that may be the result of those top 10 shares or simply the Magnificent 7.
“Underneath the surface” valuation seems more reasonable.
Rather than see a market sell-off in 2024, we may simply see a market rotation.
We’re keeping an open mind!
