


Another Brick in the Wall
After last weeks sell-off and today's bounce, we are entering the busiest week of Q1 S&P 500 earnings season. Despite the fundamental news, we cannot forget about the macro. Let's dig in...
At the conclusion of our introduction on Friday, I wrote: “Where does that leave us - we see the 4800 area (the 2022 high) on the S&P 500 as the key battle zone that will likely be tested.”
Upon re-reading that, I should have included that, in our view, when (if) that level is tested (if not sooner), the Fed and Treasury will provide the “stealth stimulus” that we have been highlighting and help lead the S&P 500 up to our 5400 year-end target.
It would be typical, given seasonality, for the current volatility to last into May.
1. How it Started, How it’s Going…the Nasdaq 100

Source: TradingView. Through year-to-date 2024.
On Friday, we highlighted the path of the rally and recent correction in the S&P 500.
Above we show a similar chart for the Nasdaq 100 ETF (ticker: QQQ).
While the S&P 500 has corrected 5.5%, the Nasdaq 100 (and the ETF in the case above) has experienced a March 25 peak to last Friday low decline of 8%.
Where do we go from here?
Similar to the S&P 500, we wouldn’t be surprised to see an oversold bounce.
There are a number of indicators that we follow to indicate an oversold condition, but the percent of S&P 500 shares that were at their 20-day lows last week nearly hit 60% and this is an important metric in our work.
With the Nasdaq 100 ETF, we view the $423 area (top horizontal light blue line on the chart above) as a likely “battle zone.”
This is the 0.236 retracement level of the October 2023 to March 2024 rally. (Again, I can’t tell you why or how these Fibonacci retracement levels are important, I can only tell you that in my experience, quite often, they are).
We continue to believe that the November 2021 high (like the January 2022 high in the S&P 500) will be the real test.
Interestingly (maybe only for me), the November 2021 high in the $405-$407 zone on the Nasdaq 100 ETF coincides with 0.236 retracement level of the October 2022 to March 2024 rally and the 0.382 retracement level of the October 2023 to March 2024 rally.
These clusters of retracement areas often provide stable “floors” - the question is will the Nasdaq 100 ETF, move down to that area.
If the Nasdaq 100 ETF were to fall to that area, it would represent a nearly 10% correction which would be normal and healthy.
We will continue to watch, but despite today’s bounce, in our view, the volatility that showed up last week (there were cracks under the service prior), is likely not over.
(This is not a recommendation to buy or sell any security and is not investment advice).
2. The Busiest Week of Earnings Season!
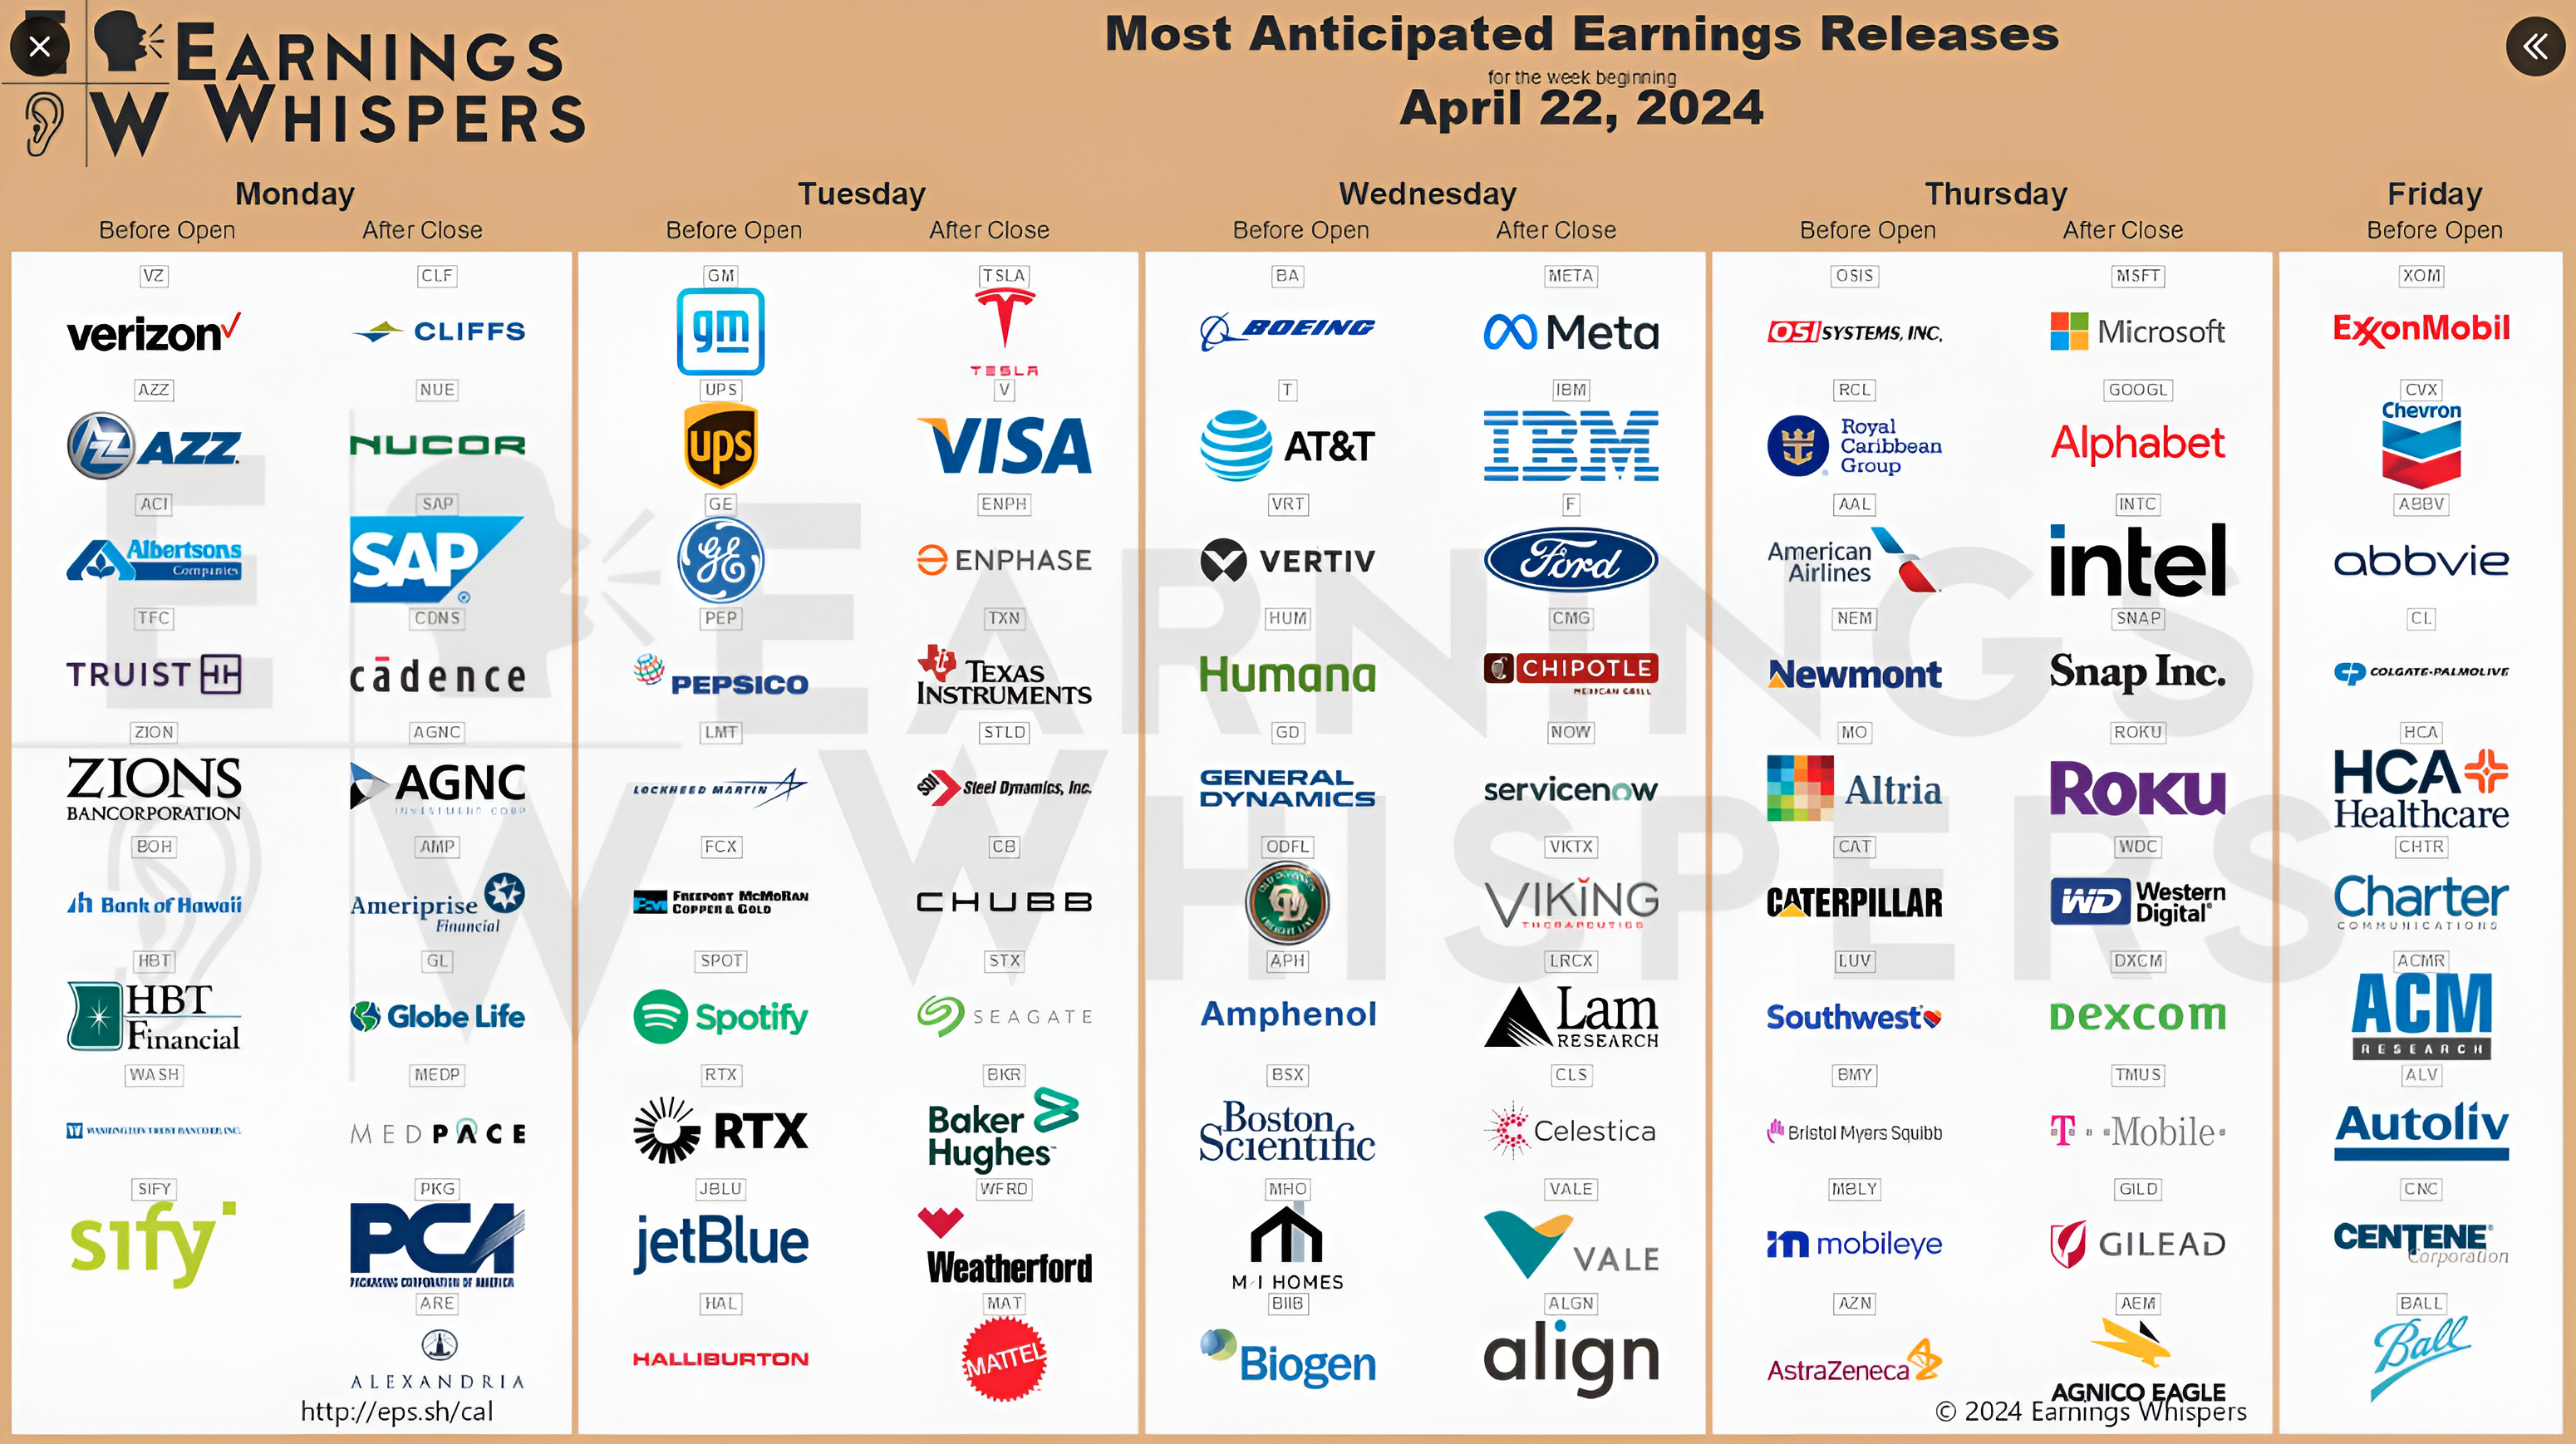
Source: Earnings Whispers. Through year-to-date 2024.
This week, 159 companies in the S&P 500 representing 33% of the weight of the index report earnings.
Last week, when ASML, one of the companies whose earnings releases we previewed as significant, announced Q1 results and an outlook that was below expectations, it was seen as a downward catalyst on an already fragile market.
This week, Meta (Facebook); Alphabet (Google) and Microsoft - three of the Magnificent 7 stocks - are reporting.
What is more important than these companies Magnificent 7 membership is the fact that these are three of the most significant AI “hyper-scalers.”
These are the companies that buy Nvidia (and other) semiconductors that run large language models (LLM) to train artificial intelligence.
Friday’s tech sell-off (led by Nvidia and SMCI - two AI related semiconductor companies), in our view, represented the concern that Q1 results could diminish enthusiasm around the current AI investment cycle amidst extremely crowded positioning.
On Friday, when SMCI didn’t pre-announce earnings - a consistent behavior of the company when things have been “better-than-expected” - it wiped out $200 billion from Nvidia’s market cap.
This, in our view, speaks to investors’ degree of anxiety of an AI infrastructure slowdown and underscores just how important commentary regarding hyper-scalers capex plans will be this week.
Although Magnificent 3 will generate the most earnings attention this week, UPS, a bell-weather stock in the transport industry will provide insight on shipments, while Visa, recently added to the financial sector, will give a read on consumer spending.
Finally, on Friday, Exxon and Chevron the two biggest positions in the energy sector, the best performing sector year-to-date, will release results.
Sometimes the mood and positioning of the market going into a week of earnings is as important in how earnings are received as the earnings themselves.
We highlighted the solid results and sell-off in JP Morgan that started earnings season. Last week, despite a challenging mood, the Netflix subscriber growth was impressive and shares fell. In our view, this was due to positioning, the rally into earnings season and the overall mood (shoot first, ask questions later).
Given last week’s sell-off, perhaps this week’s reaction to earnings will be more investor friendly.
Buckle-up!
(This is not a recommendation to buy or sell any security and is not investment advice).
3. What a Difference a Week Makes!

Source: Charlie Bilello. Through year-to-date 2024.
The chart above shows the maximum intra-year drawdown (DD) and end of year return from 1928 through last Friday (year-to-date).
Michael Santoli a CNBC contributor provided an eloquent description of equity market drawdowns:
“The work of a pullback in a bull market is to unwind over-aggressive positioning, drain excess optimism, reset expectations and take prices down to meet fundamental buyers’ conviction.”
10 days ago (really 5 trading days ago, not including today), we wrote about how small the drawdown in the S&P 500 had been to that point in the year. (here)
Well, we can cross that off of our list of concerns things to watch.
Through last Friday, the drawdown in the S&P 500 was 5.5% not considering dividends or intraday moves.
It is now clear that 2024 will not be another 1995 or 2017, the two years that we had previously cited as the only years with drawdowns less than 3%.
The median intra-year drawdown since 1928 is -13%.
For the most part, as long as the intra-year drawdown has been less than 20%, the year over-all has positive. (Past performance is not indicative of future results).
The key for us will be, given optimistic earnings expectations (particularly in Q4 and beyond) and elevated valuations, based on the description of drawdowns from Michael Santoli (above), where will prices meet fundamental buyers’ conviction.
(This is not investment advice or a recommendation to buy or sell any security).
4. Do Higher Rates Lead to Higher Inflation?
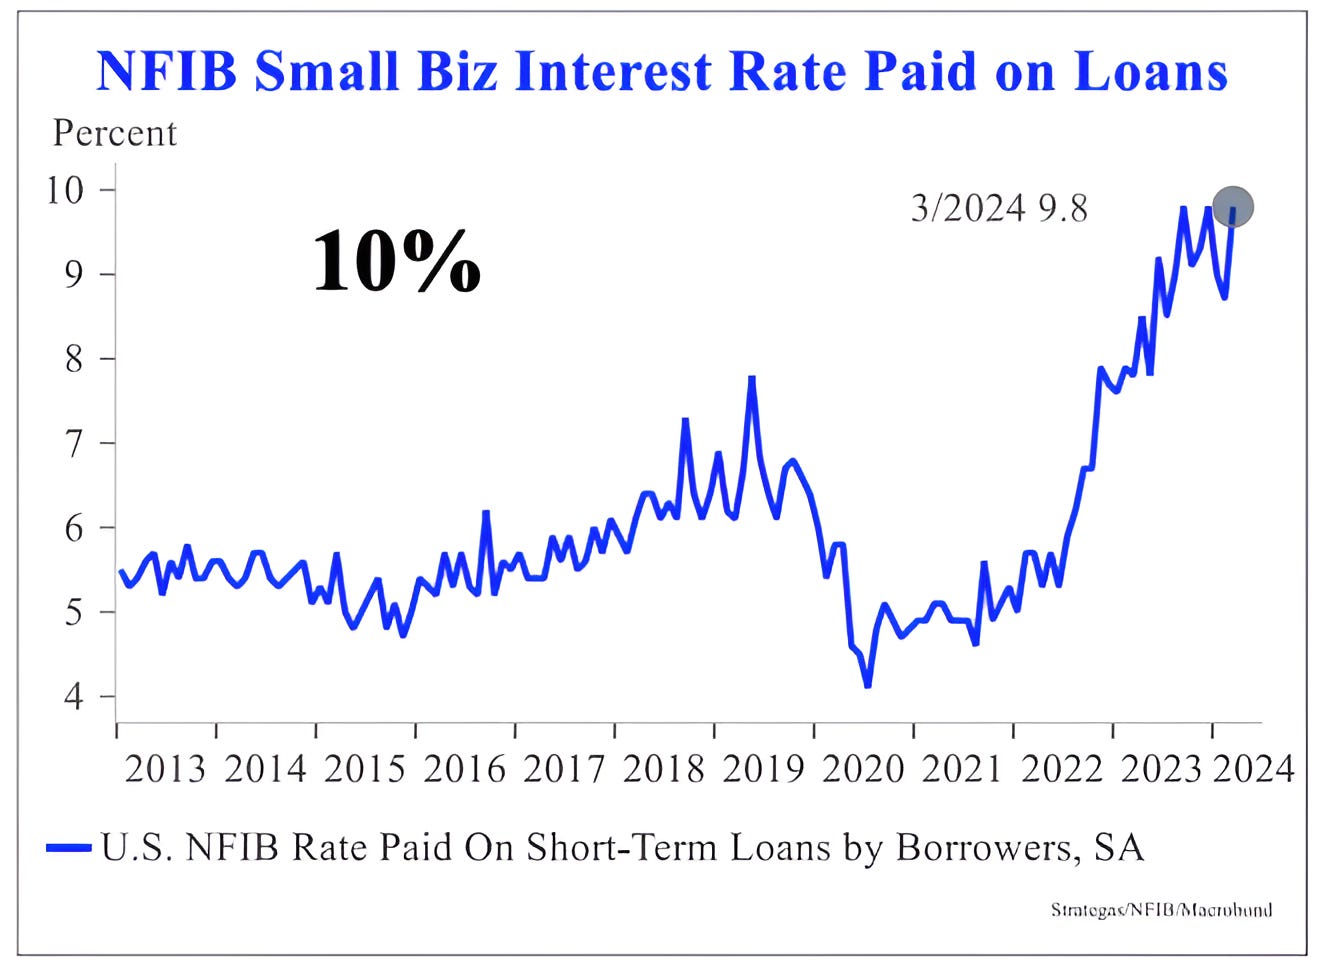
Source: Strategas, NFIB, Macrobund. Through year-to-date 2024.
On April 12, we questioned the traditional concept of the relationship between monetary policy and inflation. (here)
Conventional economists believe that, all else equal, higher interest rates can lead to lower inflation and vice versa.
At the time, I did not realize that a few days earlier Jack Manley at JPMorgan Chase had espoused a similar view.
According to Manley, “A lot of what’s going on with inflation today can be linked very closely with the level of interest rates.”
In addition, NZS Capital wrote about this concept a year ago. What they said:
“Fueled by artificially low rates, private equity acquired a record $32B of food brands in 2021, much of which was funded by floating-rate loans.
In many cases, the interest owed on these loans has tripled over the last two years.
Because leverage is so high across the economy, the Fed raising rates 5% has caused interest expense to be a chief inflationary input, prompting companies to raise prices to pay their debts.
Thus, higher rates are actually driving inflation in some cases.”
What we wrote was, whereas interest rates often seem to impact supply, Fiscal spending can alter demand.
When we add aggressive fiscal spending to a high interest rate / tight monetary environment, we are essentially increasing demand (for apartments, goods, services etc.) to tightly supplied markets.
Higher demand against tight supply, all else equal leads to higher prices.
After last weeks US spending bill (fiscal stimulus) was passed against somewhat disappointing tax receipts (which will increase the deficit), the demand side of the equation (in our simplistic model) is unlikely to be reduced.
We believe that the release valve will be to “stimulate” supply by providing non-traditional liquidity (rather than reducing Fed funds) such as ending (or at least slowing) Quantitative Tightening (“QT”) and using funds from the Reverse Repo (RRP) and Treasury General Account (“TGA”) in what we have called stealth stimulus.
(This is not a recommendation to buy or sell any security)
5. WWCD - What Will China Do?

Source: Steno Research, Bloomberg, Macrobond. Through year-to-date 2024.
On Friday, we wrote about Chinese stimulus as a potential catalyst in the rotation from Tech / AI to cyclical shares that occurred in late January / early February.
As can be seen from the chart above, China seems to be stockpiling copper at a pace outside of its historical norm.
While one theory around this is that China is increasing its commodity reserves - copper, oil and gold - before devaluing its currency, there are those (Louis Gave from Gavekal) that believe a devaluation would work against China’s goal of having the Renminbi (RMB) become a reserve currency.
According to Louis Gave:
“I don’t think foreigners get Xi’s desire to be a “great power” once again.
But you can’t be a great power with a weak currency. And you definitely can NOT be a great power if you settle your trade in your rival power’s currency.
Xi is playing for keeps. He will impose all the pain in the world on the Chinese economy before devaluing meaningfully.
If you think Xi cares about anything but making China great again, you are not listening to him. The great thing about China’s leaders is they say what they do and do what they say.
The risk for the world is not that RMB goes to 9. It is that it goes to 5. [It is currently around 7].”
If this were to happen, it would likely be good for Chinese equities, energy and gold and would be difficult for Treasuries (yields higher).
I present this not necessarily because it’s aligned with a view I hold, but rather because it is a very interesting macro view (RMB strength) from a China expert (Louis Gave) that is counter to what seems to be the consensus outlook (RMB devaluation), and it likely deserves consideration in any long-term portfolio allocation.
(This is not a investment advice and is not recommendation to buy or sell any security).