


Can't Find My Way Home...
This is the time in the quarter when the macro (inflation, Fed, etc.) hands the baton to the micro (earnings). With many indicators sitting at critical levels, we'll see how it goes. Let's dig in...
1. Is the Traditional View of the Relationship Between Interest Rates and Inflation Wrong?

Source: Apollo Chief Economist / Bloomberg. Through year-to-date 2024.
The traditional economic view of the relationship between interest rates and inflation is that, all else equal, lower interest rates equal higher inflation and higher interest rates leads to lower inflation.
What if this is wrong?
As an example, let’s say I own an apartment building with 10 apartments, interest rates move higher (to curb inflation) and I have to refinance my loan.
My loan now costs me $1,000 more a year.
In year 1, rents are going up $100 each. My renters are going to go to work and request a raise, the price for the goods that their businesses sell are going to go up to fund their salary increases and the economy is in an inflationary spiral that began with higher interest rates.
On the other hand if we cut rates - let’s say to 0%. There is maximum capital available not only to fund profitless ideas, but also to build additional manufacturing capacity.
Given cheap financing, there is the potential for new entrants to enter industries. All of the additional supply brings prices down.
Could this be why Japan was never able to achieve any meaningful inflation with 0% interest rates?
Is this why every so often between 2010 and 2020, economists in the US became concerned about deflation?
Is this possibly one of the reasons why Brazil consistently has to fight inflation despite often having very high interest rates?
Whereas interest rates often seem to impact supply, Fiscal spending can alter demand.
When we add aggressive fiscal spending to a high interest rate / tight monetary environment, we are essentially increasing demand (for apartments, goods, services etc.) to tightly supplied markets.
Higher demand against tight supply, all else equal leads to higher prices.
Historically, once there has been an inflation print above 6% (across countries), 87% of the time, there has been a second inflationary wave. (Source: Strategas). (Past performance is not indicative of future results).
The chart above maps the current cycle agains the inflation cycle in the US in the 1970s (one of the periods in the 87% study).
The inflation of the 1970s as we know was killed by a combination of very high interest rates and a restrictive fiscal policy (few remember or credit the fiscal side).
This is not meant to be a definitive argument about interest rates and inflation, but rather food for thought before the weekend.
(Also, need to credit my former boss Harvey Hirschhorn for this idea. Not only a great investor and allocator, but identified some of the inconsistencies between interest rates and inflation over 10 years ago.)
(This is not a recommendation to buy or sell any security and is not investment advice).
2. A Look at the Nasdaq 100: If You Thought This Week Was Tough…

Source: TradingView. Through year-to-date 2024.
The Nasdaq 100 was down less than 1% this week and is down 2.5% from its all time high 3-weeks ago.
Somehow, its feels a lot worse.
That’s the way sell-offs go. Often it feels as if your portfolio is doing worse than the index (even when it’s not).
(This likely has to do with Daniel Kahneman’s studies on investor psychology and loss aversion).
With that in mind, the Nasdaq is sitting at a level it first hit in mid-February.
(As an aside, there’s another mid-February reference - I promise to try to figure out what happened in late January / early February that changed so many of the charts and relationships we follow).
For the first time since propelling off of its October 2023 low, the Nasdaq 100 has met up with its 50-day moving average (the S&P 500 is experiencing the same dynamic).
Earnings are now taking the spotlight from inflation and the Fed to help guide market direction.
As we highlighted on Tuesday (here) the outlook for earnings is becoming more demanding.
Expectations for Q1 are likely sufficiently suppressed that companies can exceed them. However, as we look forward growth estimates seem unrealistic.
Will analysts continue with the game of “cut and roll?” (Cutting near-term estimates but adding to longer-term, leading to stable next 12 months earnings). Will investors begin to care?
With elevated valuations, we have characterized the market as fragile.
Given the combination of higher than expected inflation, higher 10-Year yields and the stronger US dollar (chart 5, below), the resilience in equities is impressive.
Often if an asset or a price doesn’t do what you would expect given the circumstance, it’s critical to pay attention.
If the Nasdaq 100 and the S&P 500 can remain above their respective 50-day moving averages, we will review our assumptions.
If the indexes fall below their respective 50-day moving averages, we believe the November 2021 and January 2022 highs on the Nasdaq 100 (top horizontal blue line) and the S&P 500, respectively are possible target levels.
This would mean a 9% move lower in the Nasdaq 100 and a 7.5% drop in the S&P 500 (back to 4800). (Not a prediction).
Like the 2.5% fall in the Nasdaq 100 over the past three weeks, if these drawdowns were to occur, they would feel a lot worse than they actually are.
(This is not a recommendation to buy or sell any security).
3. Putting 2024 in Perspective

Source: Carson Research. Through year-to-date 2024.
Prior to the past couple of days, the greatest peak to trough drawdown in the S&P 500 during 2024 was 2%. (It’s now about 2.6%).
Since 1990, 1995 experienced the smallest maximum drawdown of any year at 2.5% (Alan Greenspan executed a soft landing after the surprise tightening in 1994).
2017 had the second smallest maximum drawdown of 2.8%.
The average peak to bottom drop over the past 35 years has been around 14%. Even in some of the best years a 5-10% drawdown has been typical.
(Past performance is not indicative of future results and is not investment advice).
4. Cutting the Cord: Charter Communications
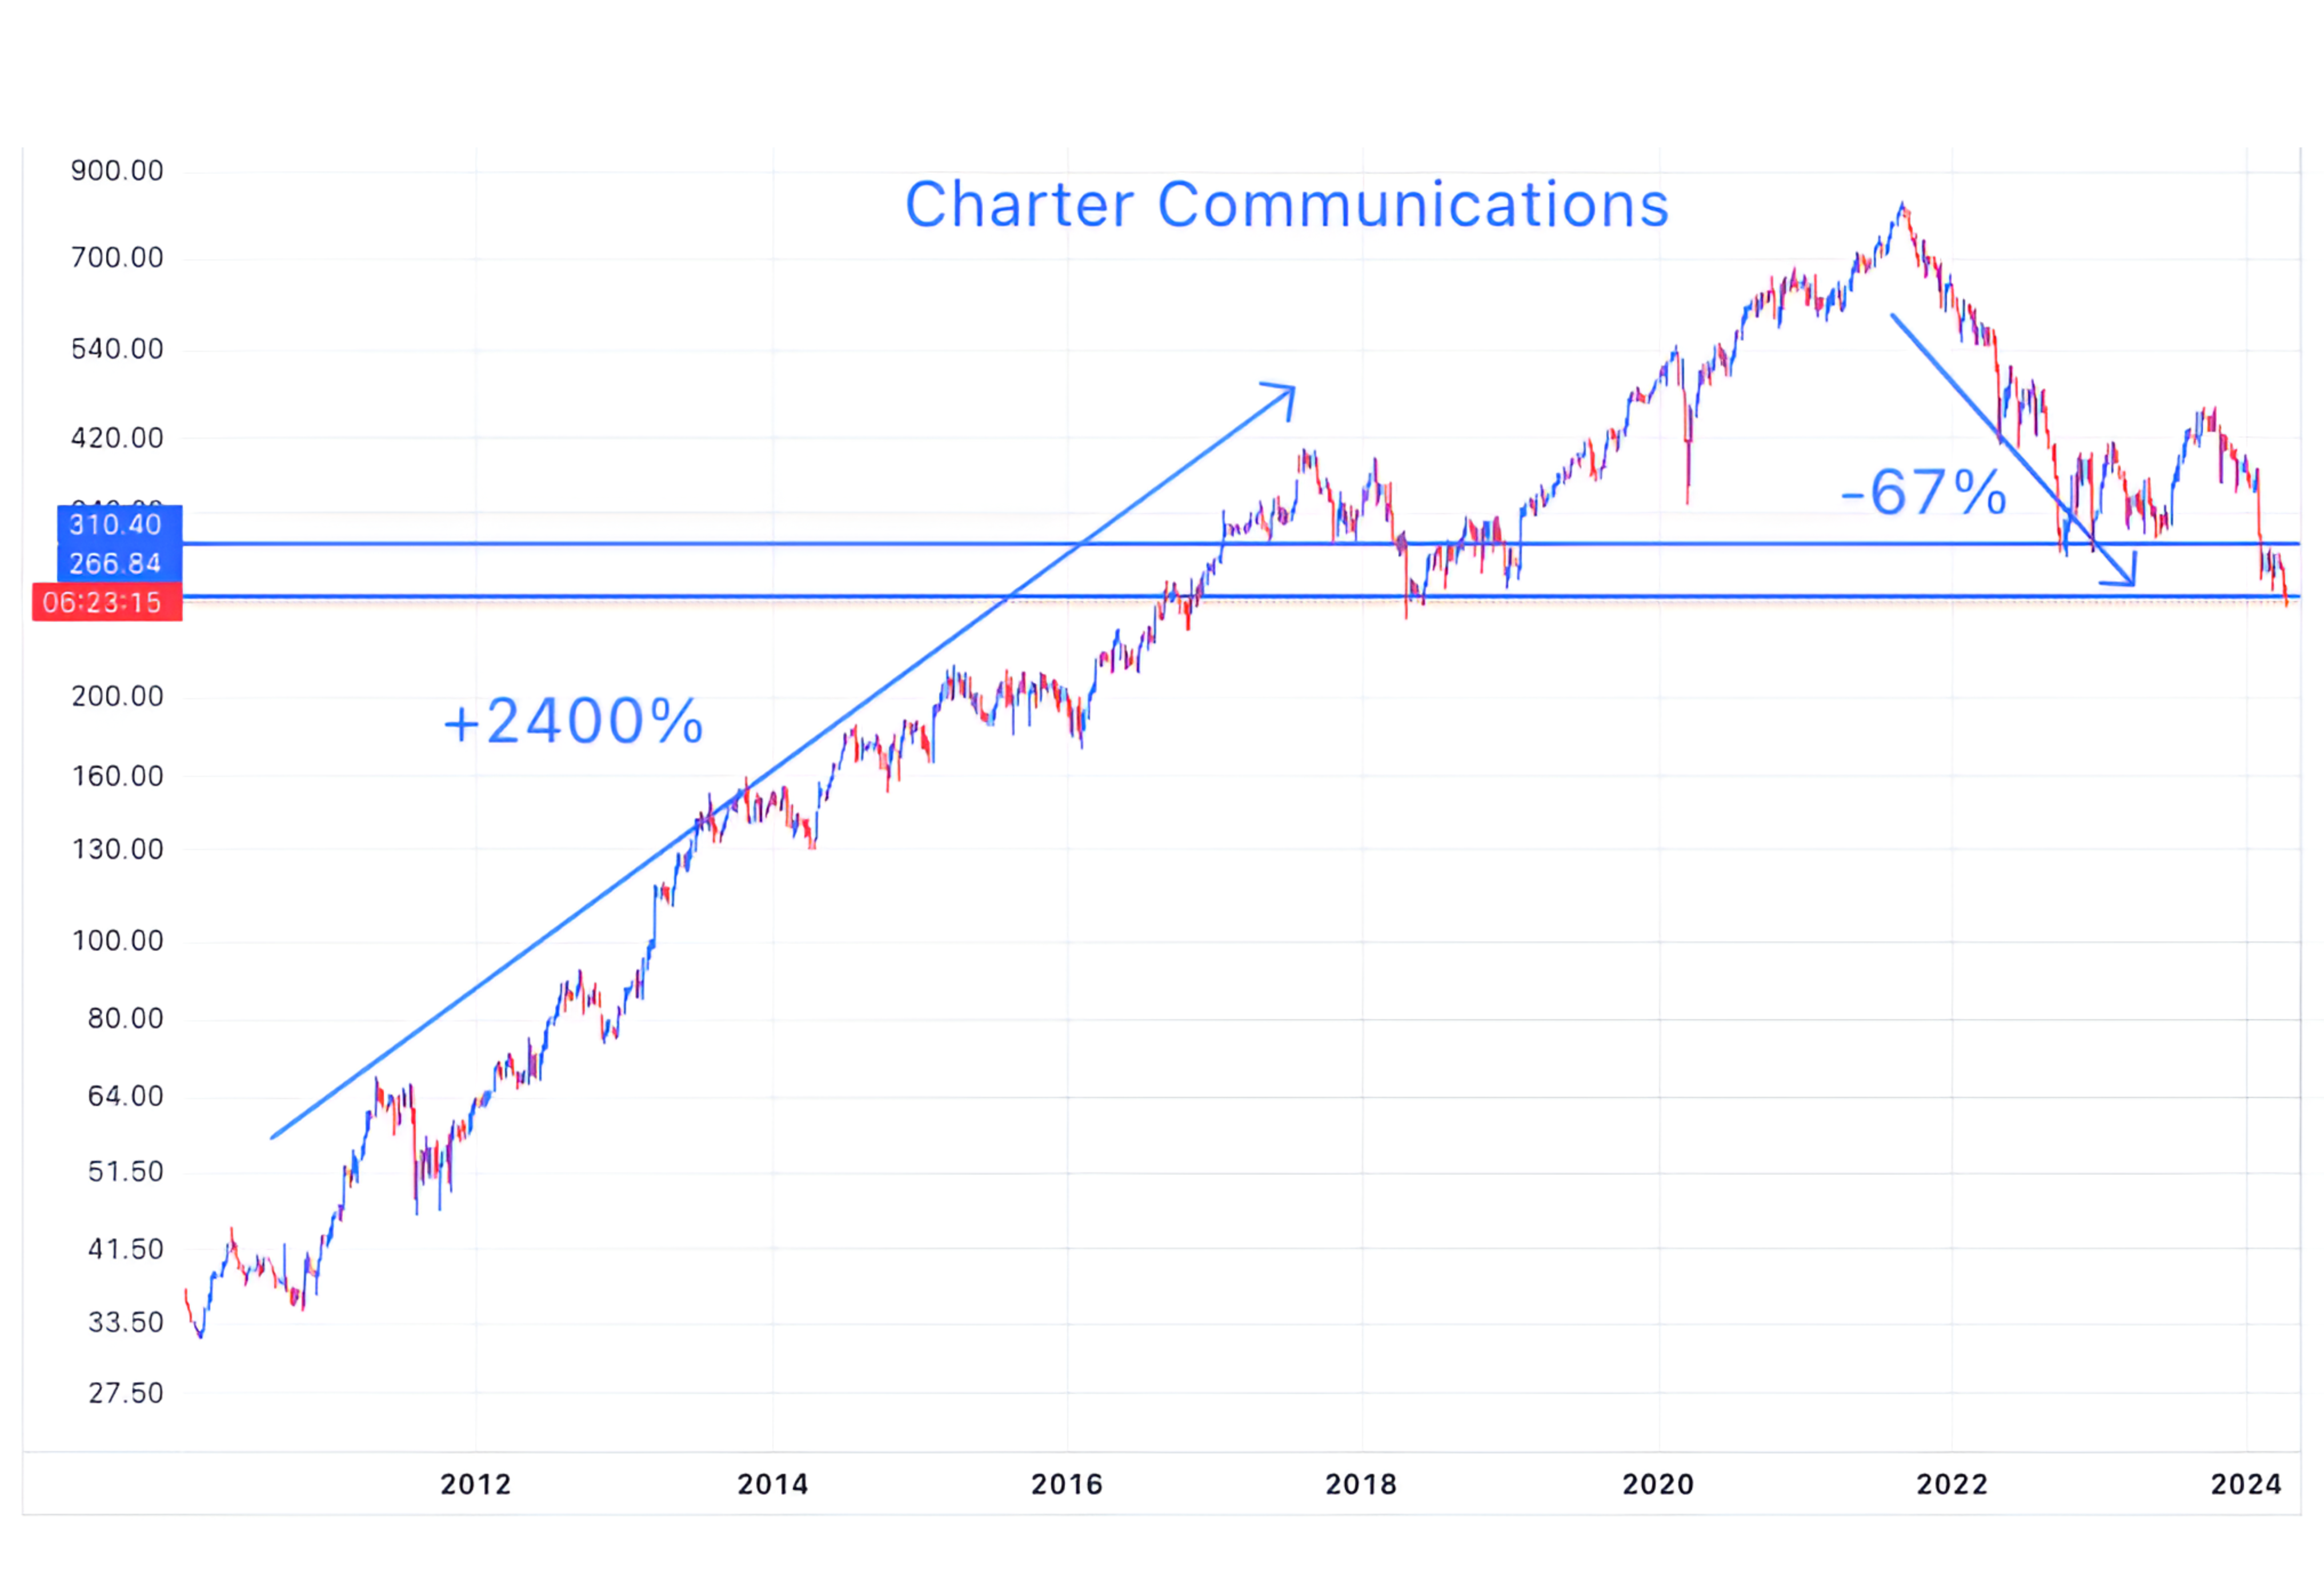
Source: TradingView. Through year-to-date 2024.
Charter Communications (ticker: CHTR) through its “Spectrum” unit is one of the largest US cable and broadband providers.
In general, the cable industry in the US is a duopoly and despite continuing investment requirements (capex), it has always provided attractive cash flows.
However, as customers have “cut the cord” some industry dynamics have changed.
In 2023, Charter (Spectrum) over-took Comcast to be the largest cable provider. However, this wasn’t due to growth.
Spectrum’s jump to the number one spot was achieved by not losing as many customers as Comcast.
Charter lost more than 1 million cable customers in 2023. However, Comcast lost over 2 million.
Over the past 10 years when the Charter and Comcast were losing cable customers, those customers were signing up for broadband internet service. This resulted in lower revenues but high margins and consistent cash flow growth.
However, during 2023 both Charter and Comcast also lost broadband subscribers.
This was most likely due to competition from cellular data (ATT, Verizon and T-Mobile).
At some point, with an easier Federal Trade Commission (the group that allows mergers to go through based on competition etc), we will likely see consolidation (mergers) between the legacy cable companies and the legacy telecomm companies.
After falling 67% from its September 2021 high, Charter is trading at 9x earnings.
While we don’t like to catch falling knives, we will look for stabilization in the shares, which, to us, will be an indication that large institutions are looking at a reversal of the negative dynamic in the cable / broadband space.
(This is not a recommendation to buy or sell any security)
5. The Dollar

Source: TradingView. Through year-to-date 2024.
We have continued to highlight the US dollar Index as strength in the currency has often been inverse to equity market performance.
In other words Dollar strength has often foreshadowed equity weakness and vice versa. (Past performance is not indicative of future results).
Despite this relationship, up to this week, US equities have ignored the year-to-date strength in the dollar.
As the dollar has now moved meaningfully through the $104.90 level, the October 2023 high above $107 looks like a possible destination.
From July to October 2023, when the dollar strengthened, the S&P 500 fell just over 10%. (Past performance is not indicative of future results).
Dollar strength may be an additional headwind to equity markets.
(This is not a investment advice and is not recommendation to buy or sell any security).