Don't Call it a Comeback, I've Been Here Before
With a significant inflation print and Fed minutes coming tomorrow, a number of assets and relationships we follow are back at levels that have been significant in the past. Let's dig in...
1. Bounce or Collapse?
The chart below shows the Nasdaq 100 relative to the S&P 500.
When the chart is moving higher, the Nasdaq 100 is outperforming and, when the chart is moving lower, the S&P 500 is outperforming.
This relationship peaked at the end of January.
In other words, the S&P 500, with all of its value sectors (Energy, Financials, Industrials, Utilities, Real Estate and Materials), has been outperforming the tech-heavy, Magnificent 7 dominated, AI related Nasdaq 100 for nearly two months.
The relationship is now at a critical juncture - the 2020 / 2021 ceiling and Q3 2023 high.
Will this relationship bounce or collapse from here?
Whichever direction investors decide to take it, the next move in the Nasdaq 100 relative to the S&P 500 will likely establish the near-term character of the US equity market.
As an aside, over the past week, we have been highlighting two key market attributes:
1) something changed at the end of January / beginning of February; and
2) a number of sectors and relationships are revisiting areas that in the past have been floors or ceilings. I always find it interesting how markets move to critical levels as they await significant data.
(This is not a recommendation to buy or sell any security and is not investment advice).
Source: TradingView. Through year-to-date 2024.
2. Earnings Expectations are Becoming More Demanding
Friday is the official start of Q1 US earnings season.
During Q1, earnings expectations for the quarter fell 2.7% while the S&P 500 earnings estimate for the year was reduced by only 0.4%.
Essentially, the reduction in Q1 earnings was replaced by an increase in Q4 expectations.
We have named this the “Cut and Roll” as analysts cut near-term forecasts and roll near-term disappointment into future earnings estimates.
As can be seen on the chart below, in order to achieve the nearly $243 in 2024 S&P 500 earnings, companies will need to grow Q4 earnings 17.5%.
However, this type of earnings growth over the past 10 years has required an exogenous event.
In 2018, US earnings growth averaged 24%.
However, this was because, the Trump tax cut passed in 2017 and moved the corporate tax rate from 35% to 21%. This had an immediate boost on S&P 500 earnings.
The other year of the past 10 with earnings growth greater than 15% was 2021.
This was the year after the covid shutdowns. Earnings growth in 2021 was primarily due to a combination of a low base - comparing earnings to the covid shutdown earnings of 2021 - and significant stimulus.
Over the last 2 quarters, earnings growth has averaged about 5%.
While the current expectation for Q1 earnings growth is 2.9%, as we wrote yesterday, companies have lowered the bar and we expect them to exceed it.
5% earnings growth for Q1 is likely a reasonable estimate.
However, our concern is not with Q1 (unless there is a significant earnings miss which we are not expecting), our focus is on Q2 and beyond.
Will the game of “cut and roll” - where analysts cut near-term estimates and roll them into back-end projections continue or will future estimates, particularly Q4, be pared back.
In our view, 5-7% earnings growth may be reasonable for 2024 (we are in a 5-7% nominal growth environment). That would lead to 2024 earnings of $230-$235.
At the same time, 2025 earnings expectations may remain at 8-10% (“cut and roll”) even if those estimates are not met.
That would mean that sitting at the end of of 2024, investors may be expecting $255-$260 in 2025 S&P 500 earnings.
If the market can maintain its 20-21x multiple - maybe a big if from where we are now but could be realistic in December with the election in the past and some year-end seasonality - that would be around 5400 on the S&P 500.
This is the year-end target and case that we presented in Chart 2 in the “Everything Rally” here despite our questions around earnings estimates and growth.
(This is not a recommendation to buy or sell any security).
Source: FactSet. Through year-to-date 2024.
3. 2-Year Treasury Yields
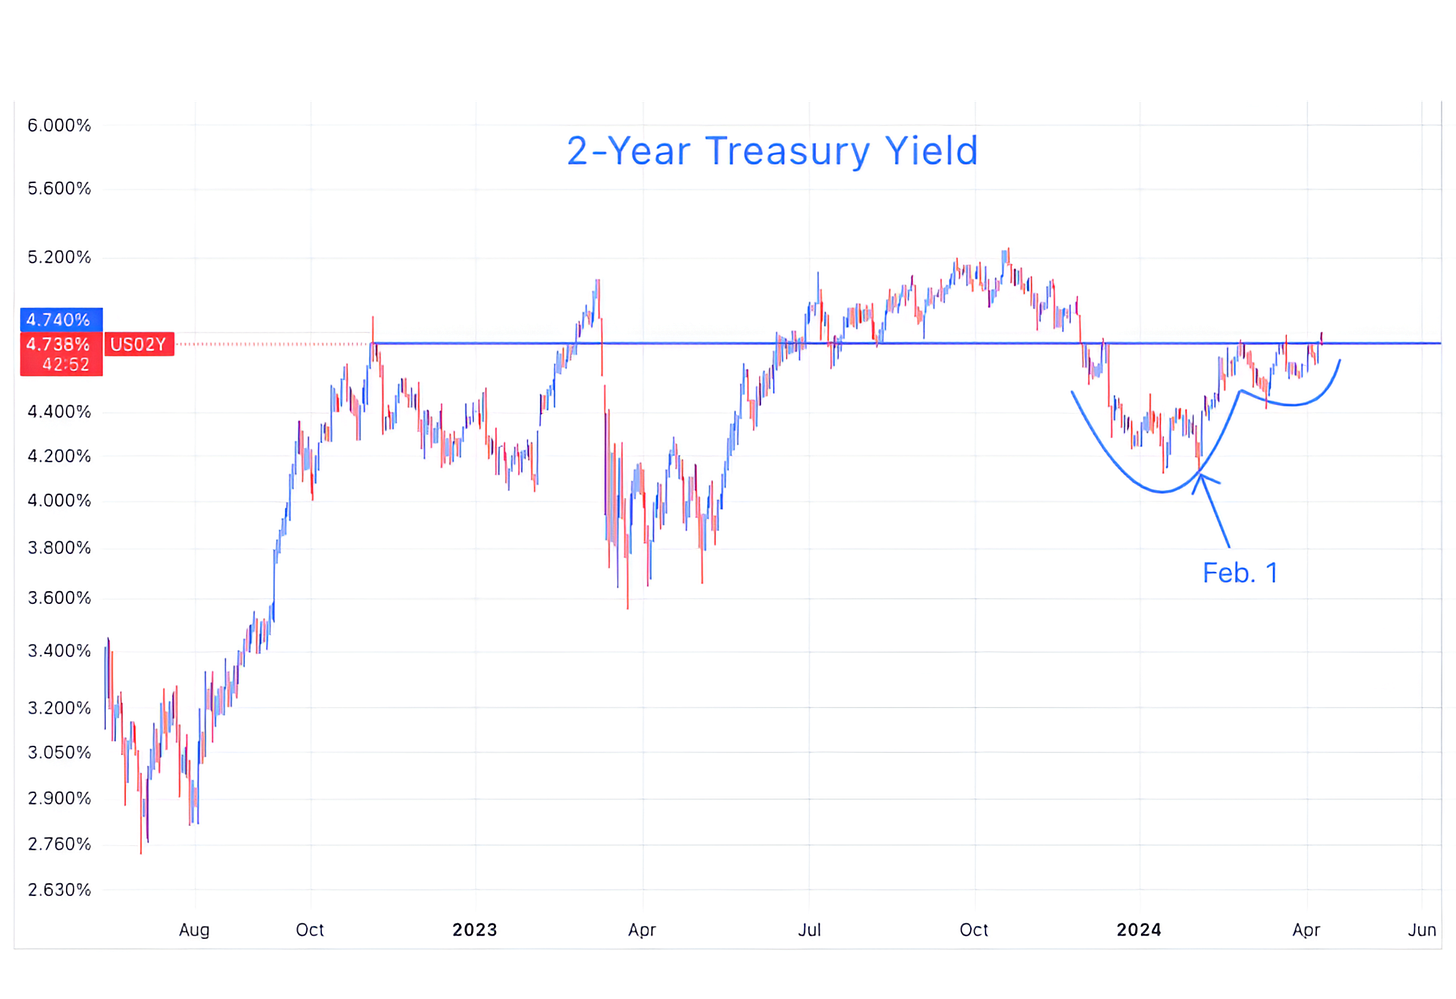
Given its short duration, the 2-Year Treasury Yield is one of the more sensitive points on the Treasury curve to Fed Funds rates expectations.
On March 1, we asked “Will the Fed’s Next Move Be a Hike?” (here).
While the 2-Year Treasury Yield has not necessarily priced in a hike, since February 1 (there’s that early February date again), it seems to have priced out two cuts over the next 2 years as it has moved from 4.20% to 4.75%.
If tomorrow’s CPI print continues the mild uptick in inflation that was exhibited in the January and February data, we wouldn’t be surprised to see 2-Year yields move back above 4.75% (the horizontal blue line).
While this might put pressure on multiples, it would be consistent with the near-term pause or correction that we have been expecting.
(This is not a recommendation to buy or sell any security and is not investment advice).
Source: TradingView. Through year-to-date 2024.
4. Interesting and Likely Some Good News Coming
Over the past year, only 37% of S&P 500 members outperformed the Index.
Typically, just over half of the members outperform.
In general, the low percent of out-performers over the past year speaks to the dominance of the mega caps and Magnificent 7 that pulled the Index higher while leaving most other shares behind.
As we have seen so far this year, the Magnificent 7 performance has become more selective (Tesla is one of the years under-performers) while there has been broader participation in general.
In our view, participation will expand and the rotation will continue as the growth in last years out-performers slows.
(This is not a recommendation to buy or sell any security)
Source: Financial Times. Through year-to-date 2024.
5. Chinese Internet Shares Back at the Battle Line
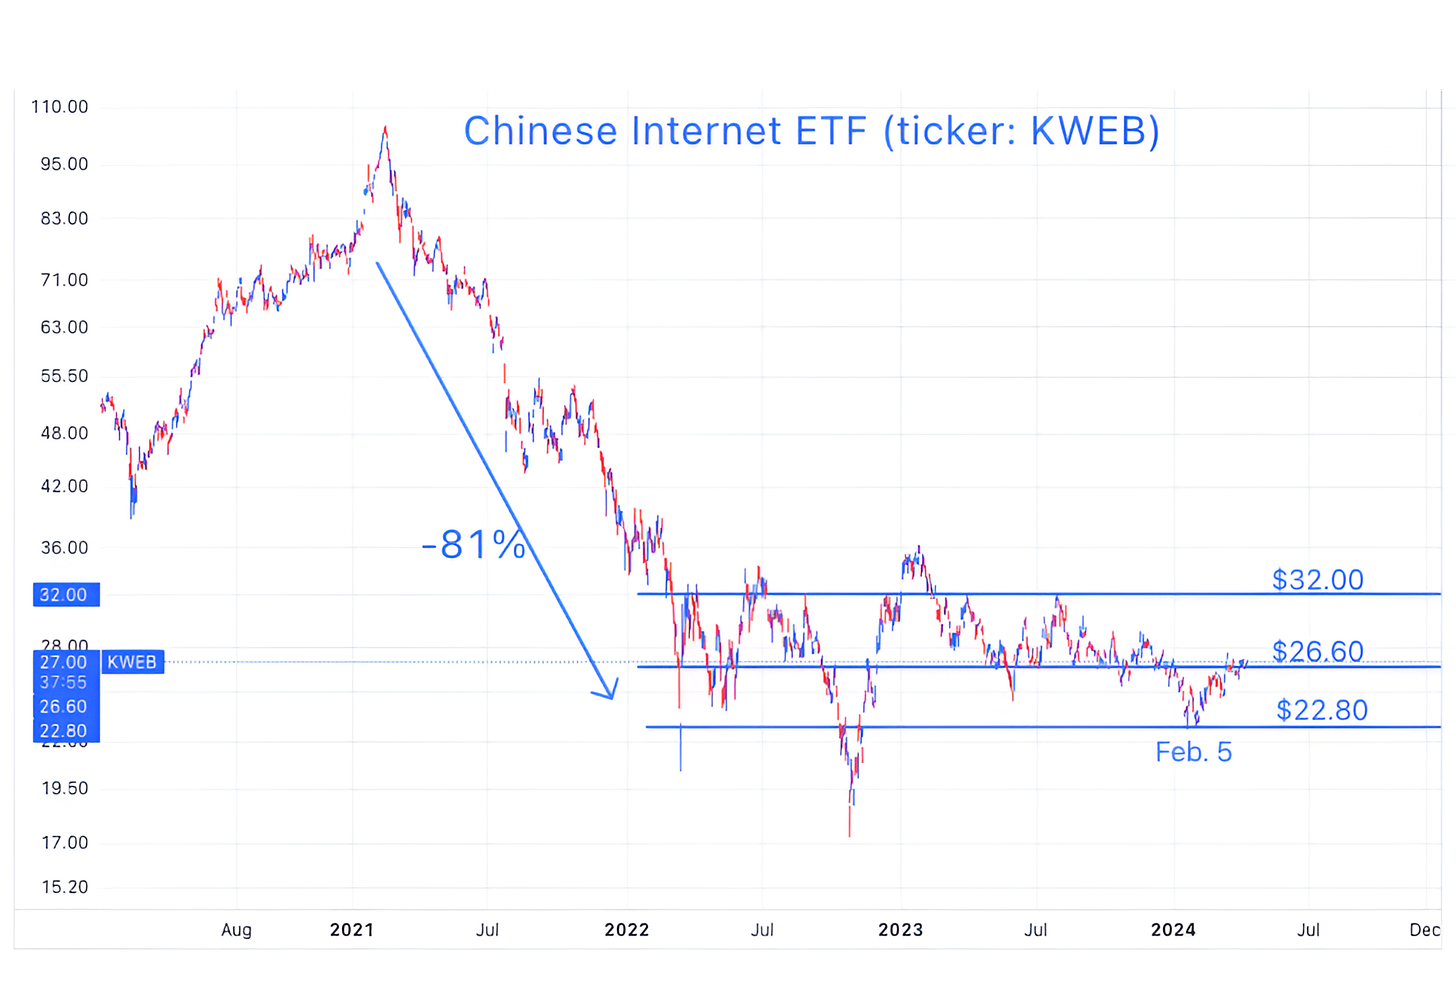
We last looked at the Chinese Internet ETF (ticker: KWEB) in chart 5 on February 6 (here).
The title of the chart was, “Looking for a Possible Bounce in Chinese Internet Shares.”
As it turned out, that day marked the recent bottom in the ETF. (I promise that our timing will not always be that good.)
At the time, we wrote:
“We are not looking for the Chinese Internet shares to move out of their current range, but if they simply rally to the redline in the chart at $26.60 that would be a 14% move higher from yesterday’s close.”
With Chinese Internet shares still out of favor and the ETF trading at $27 after playing around with the $26.60 level over the past 2 weeks, we may consider the possibility that the ETF will climb up to $32 (+19%).
Anecdotally, I received a Bloomberg alert on my phone yesterday that read “The “miracle” of China’s growth is now in the past, and India may overtake it as the engine of global economic expansion.”
With the 81% drop in Chinese Internet shares and minimal recovery, in our view this news is largely priced in.
As a reminder, the ETF is 10.2% Alibaba and 10.2% Tencent.
Alibaba is currently trading at $73 per share or 13x trailing earnings. Today, JP Morgan cut its price target for the shares to $100.
In our view, it will not take good news from China for upside, all that is required is less bad or not as bad as feared news.
As one final note, like other sectors and relationships we’ve been showing, the Chinese Internet ETF changed trend in early February.
(This is not a investment advice and is not recommendation to buy or sell any security).


