Will the Fed's Next Move Be a Hike?
Put another way, why would the Fed cut rates? Inflation metrics are stable or increasing and equities are at all time highs. It doesn't seem to be an economy that needs easing. Let's dig in...
After I sent out yesterday’s piece, I questioned if I was becoming overly complacent in my market views.
As I learned it, markets climb a wall of worry, and neither I, nor any others, seem to be presenting much to worry about.
It occurred to me that this is exactly the time to be concerned.
And then I saw this week’s cover of the Economist (“How High Can Markets Go?” here) and it confirmed to me that at least some concern is warranted.
Although there are a number of exogenous events that can negatively impact markets, central banks, liquidity and the change in perception of the next move are generally the most typical rally killers.
While I am not worried about a Fed tightening (the S&P 500 is up 15% since the first hike in 2022), I want to be sensitive to the conditions that could set the foundation for a hike and change market perceptions about the path of Fed policy.
We first began to consider the possibility of a hike 2.5 weeks ago (in chart 3 here). (“What’s New Zealand Got to, Got to Do with It?”)
Since that time, in our view, the conditions for a Fed hike (or at least higher for longer) have continued to confirm our concern:
1. Inflation data seems to be stable or increasing (chart 1);
2. Inflation expectations are increasing (chart 2);
3. The S&P 500 is at an all-time high and has moved up over 20% without a 2% decline (a rarity);
4. Purchasing manager indices seem to have bottomed and are inflecting north;
5. Employment remains full; and
6. Oil (chart 3) is moving higher.
While market participants have pushed back their expected timing of the Fed’s first cut to June (remember in early January when the market had priced with near certainty that the Fed would hike at its meeting in 2.5 weeks?), few are considering a hike.
Unless there is a significant economic slowdown or a meaningful change in the conditions above, I am not sure why the Fed would ease and, in our view, if trends continue, further tightening may be warranted.
While a hike isn’t necessarily our base case, in light of the “everything is awesome” rally, we need to consider a change in the market’s perception of Fed policy and be prepared.
Let’s look at the charts below.
1. “A Collage of Evidence”
In an interview yesterday, San Francisco Fed President Mary Daly articulated the need for “a collage of evidence” to confirm a sustainable downward trend in inflation, relying not just on published economic statistics but also on insights from business contacts.
As highlighted in our introduction - in our view, the current “collage of evidence” may warrant more of a tightening bias than an easing stance.
Yesterday, the US Bureau of Economic Analysis (BEA) released its Personal Consumption Expenditures (PCE) Index. While the headline number of 2.4% year-over-year growth (down from 2.6% in December) was innocuous and within the Fed’s target range of 2-4%, on a month-over-month basis, it was 0.3% which, if annualized, would be over 3%.
While the Fed has looked at “core” measures of inflation ex-food and energy (the core PCE came in 2.8% for January) for many years, more recently, the Fed has been focused on “Supercore” inflation (chart below).
Supercore tracks the cost of services minus energy and housing. Service costs mostly reflect labor costs but also includes costs for healthcare.
When looking at Supercore on a month-over-month basis in January, it spiked back to 0.6% which is near its highest post-pandemic levels.
Obviously, on an annualized basis, this is well above the Fed’s goals.
While some may argue that the January Supercore measure is an anomaly that will reverse itself, in my view, the “collage of inflation” evidence reflects stable to increasing inflation rather than moderating.
(This is not a recommendation to buy or sell any security, it is not investment advice)

Source: TradingView. Through year-to-date 2024.
2. “You’re Going the Wrong Way!”
The title above is a reference to a (classic) scene in the 1987 movie “Planes, Trains and Automobiles” (here) (worth a short watch over the weekend) - but it could easily be applied to inflation expectations.
Below is a chart of the market based 5-Year Breakeven Inflation levels.
The Breakeven rate is seen as the market-based expected average inflation rate in the next 5 years.
This, in my view, is the way the market prices the “collage of evidence.”
Since early December, the market has been pricing in higher inflation.
Lynx-eyed observers will note that the equity market has often acted in the opposite manner of inflation expectations.
In 2022, the S&P 500 stabilized and found a floor shortly after the 5-year breakeven rate fell below 3%.
Since that time, many of the sell-offs and rallies in the equity market, have coincided with spikes and drops in inflation expectations, respectively. (Past performance is not indicative of future results).
While the move higher in inflation expectations since early December has coincided with an equity market rally, it may be that the 2.4% level (green line), that acted as a floor in late 2021 and has recently been a ceiling, is an important one for market sentiment.
We will watch.
(This is not a recommendation to buy or sell any security and is not investment advice)

Source: TradingView. Through year-to-date 2024.
3. Oil
I know we only want to consider core (ex-food and energy) and Supercore measures of inflation; however, oil often feeds directly into headline inflation figures and inflation expectations.
We continually show the chart of West Texas Intermediate (WTI) Crude oil ($/barrel) (most recently here). At the time, we wrote:
“Oil is probing its recent ceiling level of $78 / barrel. If the oil price breaks through its recent ceiling, in our view, it would likely climb to the $85-86 range.
If this were to happen, we might see inflation expectations continue to move higher; Fed cuts become more challenging; 10-year yields move higher.”
This morning, WTI Oil moved above $80 / barrel.
We will see if it impacts inflation and inflation expectations and 10-Year Treasury yields.
We have been continually adding to our energy sector investments (5-10% of our equity portfolios) as a hedge to our overweight high-growth exposure.
(This is not investment advice)

Source: Strategas FactSet. Through year-to-date 2024.
4. Apple
Yesterday, when we wrote that we would aim to cover Apple today, we had no idea that Goldman Sachs would downgrade the shares and remove the company from its conviction list this morning. (This is not a recommendation to buy or sell any security).
When we consider Apple, we see a great company that has:
Had declining operating earnings over the past two years ($119 billion in 2022, $114b in 2023 and $118b last 12 months) while shares have rallied over 40%;
Launched no recent meaningful new products (the Apple Vision Pro will not move the needle in the near-term);
Borrowed money to buy back shares in order to boost earnings per share (fewer shares with same earnings = greater earnings per share) but this seems to be tapering down;
Expanded its PE multiple to a current level of 28x up from 22x at the end of 2022; and
Lost the biggest buyer of its shares (Berkshire Hathaway was a net seller last quarter - not because of a negative view, but it became too large of a position in the Berkshire portfolio).
To be clear, this is one of the great companies in the world, and we love the products.
In addition, we see significant potential upside over time with Apple pay and continued growth in cloud, AI and services.
Yesterday, shares were trading at $181 (middle blue line on the chart) which appeared to us to be a critical level. This morning (blue arrow) with the Goldman Sachs downgrade shares have fallen below that level.
It is possible (this is not a prediction) that shares could continue trade down to around the $166 level in a symmetrical move opposite to the positive ones we’ve been showing.
Apple is 6.3% of the S&P 500 (behind Microsoft 7.1%) and a move lower in Apple shares will be a drag on index performance.
(This is not a recommendation to buy or sell any security and is not investment advice. Please do your own due diligence.)

Source: TradingView. Through year-to-date 2024.
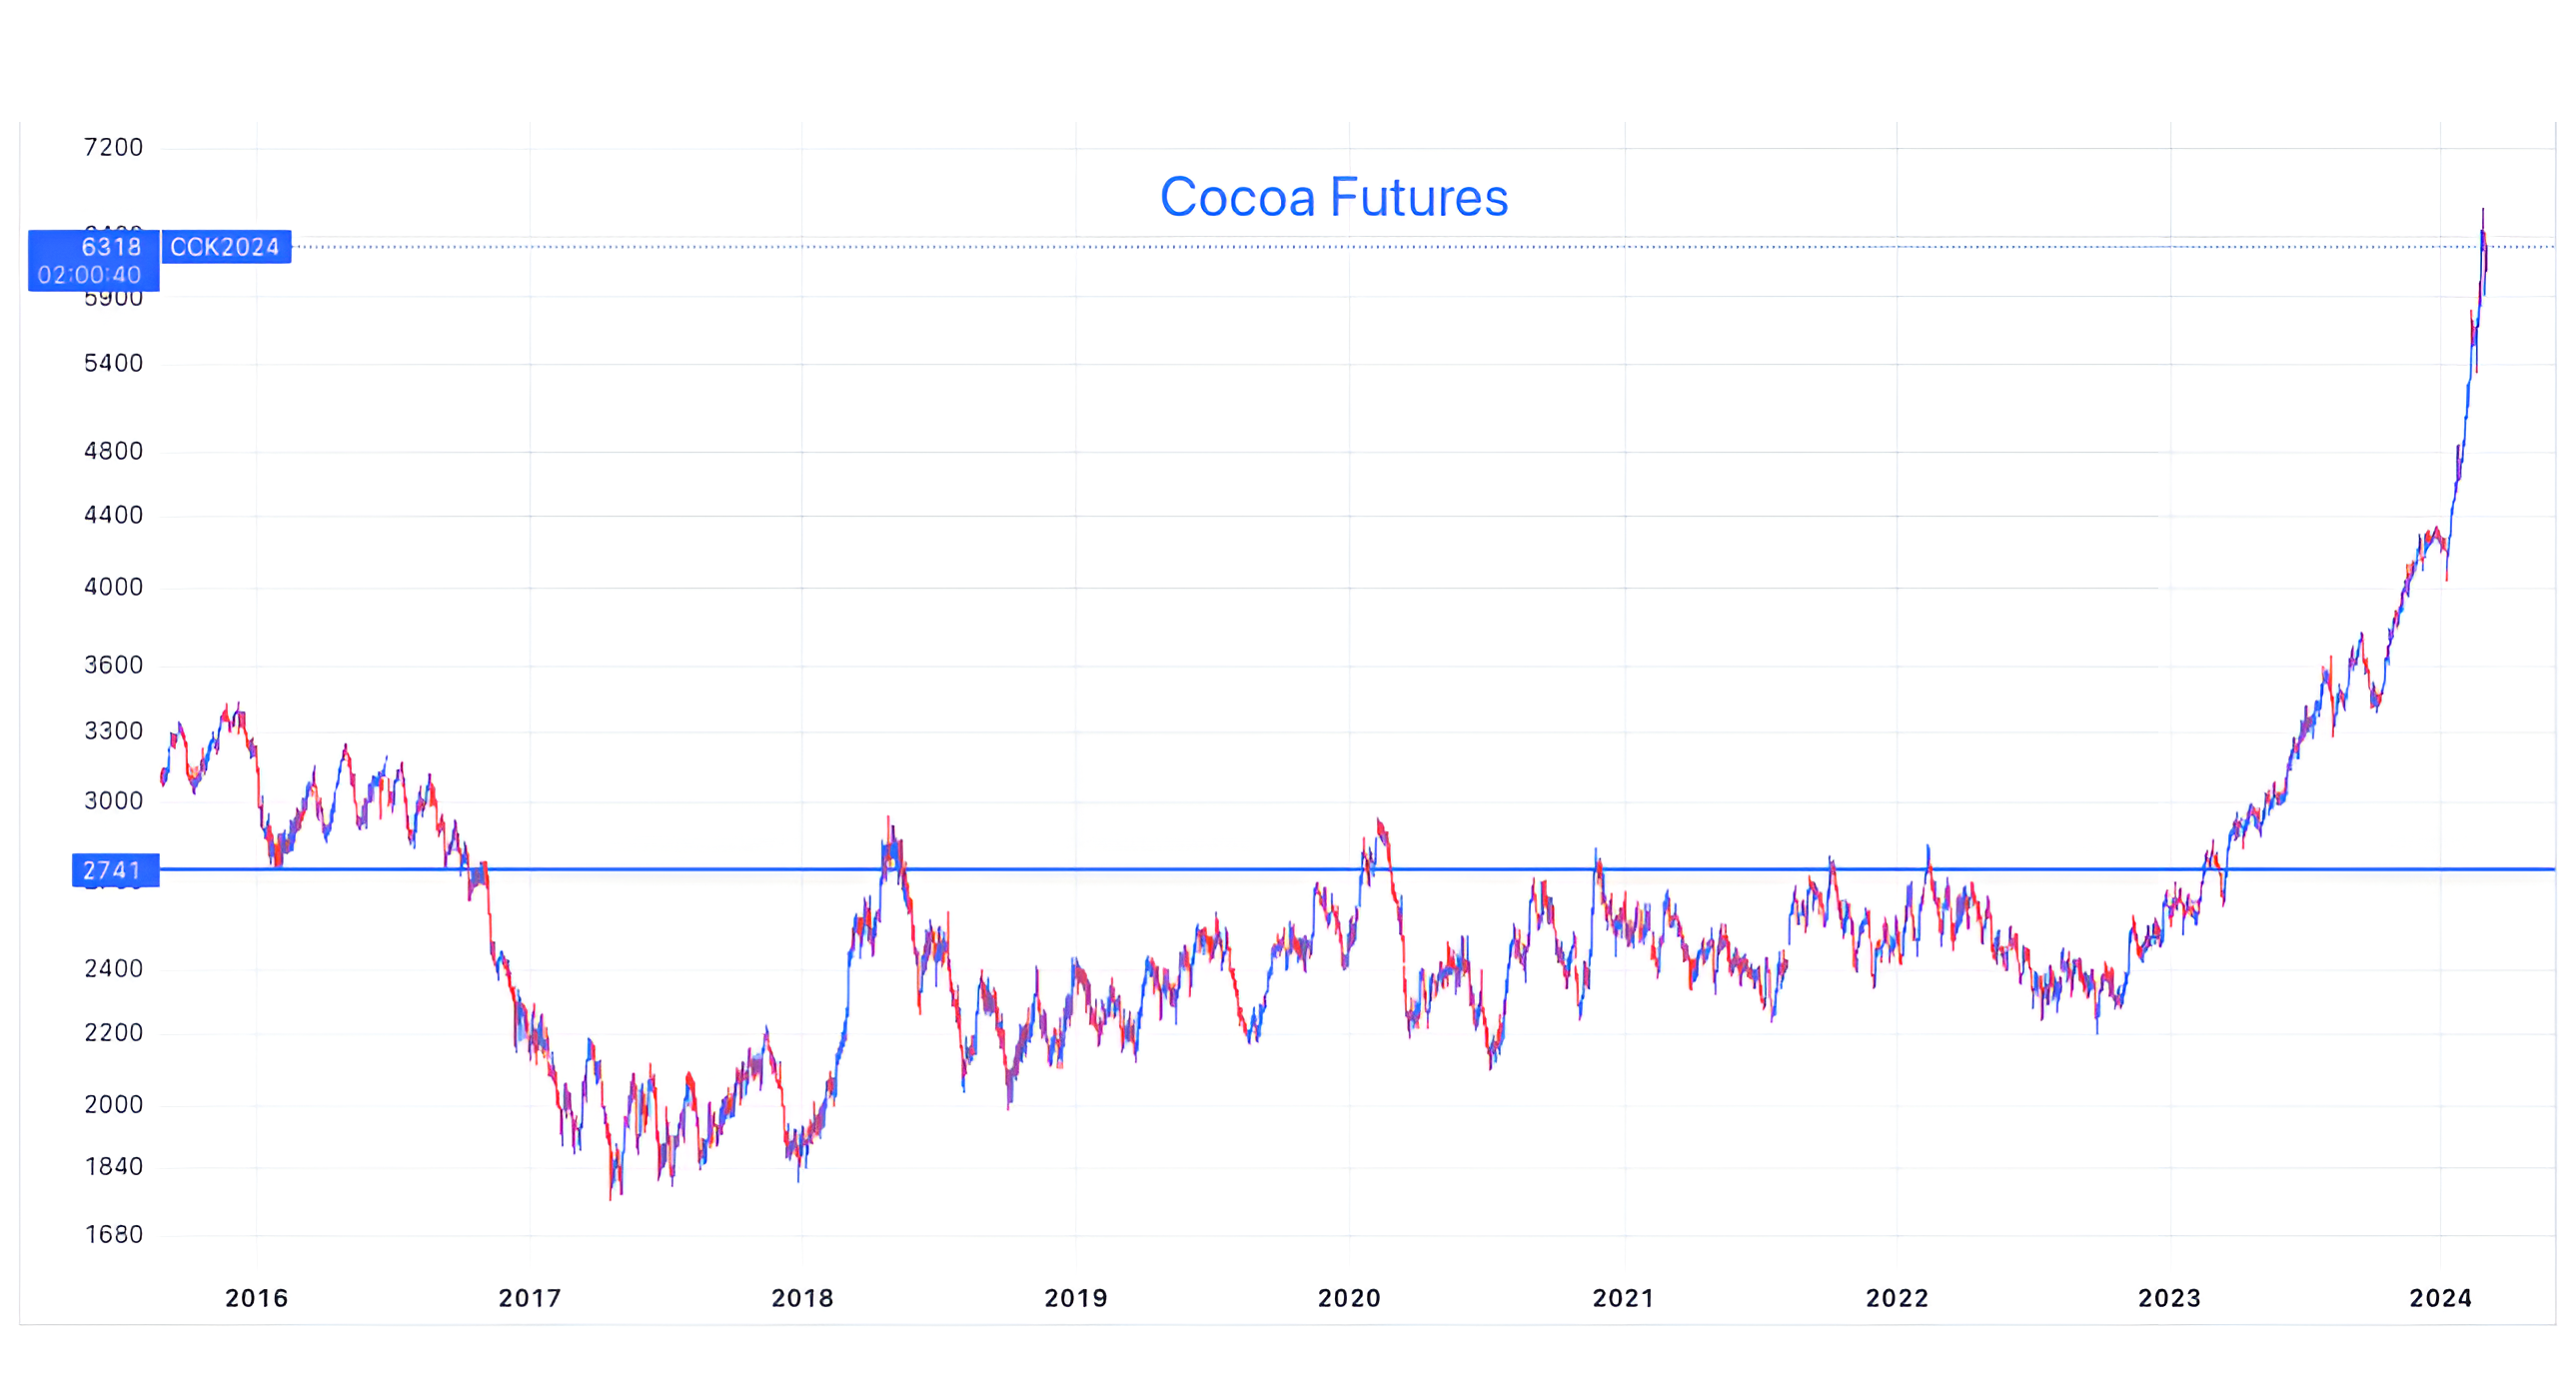
5. This One Hits Home
It’s Friday, I’m writing about inflation and, while I know at best chocolate is a minimal part of any official consumption basket, it’s a large part of mine and cocoa prices have sky-rocketed.
The proximate cause of the jump in cocoa prices has been non-favorable weather in West Africa (60% of global cocoa production) that has damaged crop yields and has led to too little supply to meet my demand.
Have a great weekend!
(This is not a investment advice and is not recommendation to buy or sell any security).