


Turning $200 to $64 billion, the Huang Way
I received several questions on Nvidia last night. Today, ahead of Nvidia's earnings, we want to focus a bit more on a key pillar of the recent move in US equity indexes. Let's dig in...
First, a story.
In 1993, when Jensen Huang (current CEO) was starting Nvidia with two other engineers, he didn’t know how to incorporate the company.
He went to a lawyer who agreed to help.
“We need some money from you so that we can price the shares and incorporate the company,” the lawyer told him.
“How much money do you have in your pocket?” he asked Huang.
Huang happened to have $200 on him. “I gave him the $200. For $200, I bought 20% of Nvidia.”
Today, Huang owns 3.6% of the company which is worth approximately $64 billion.
The picture below sums up how some traders and investors are regarding Nvidia’s earnings release this evening.
1. Happy Nvidia Earning Day to All that Observe
Today, we have included a graph of Nvidia shares since their big May earnings beat. (A more near-term look than what we showed yesterday here).
Interestingly, after the May earnings announcement, Nvidia shares traded sideways (in a 25% range) for 6 months despite two above consensus earnings reports (August and November).
Shares only began to move significantly higher and above the range at the start of this year.
Why?
We tried to describe this in Chart 5 here.
But to summarize, portfolio managers that were underweight Nvidia shares last year, for the most part, underperformed. (Said another way, it was difficult to outperform last year if you didn’t own Nvidia).
As portfolio managers returned to the office at the beginning of the year, they said to themselves, if Nvidia outperforms again and I don’t own it, I will be fired.
They bought. Regardless of valuation - they bought.
As shares went up, they needed it more because the outperformance was starting again and they needed to be in.
Is there a strong fundamental story with Nvidia - yes. But that has not been the sole driver of share performance this year (in our view).
With that said, let’s consider the consensus expectations for Nvidia’s Q4 2024 (calendar year 2023) that will be reported tonight:
Revenue is projected to be $20.55 billion for the quarter. This number has continued to creep higher over the past month. This represents year over year growth of 234% and a quarter over quarter increase of 11.6%.
The market expects Nvidia to report a gross profit of $15.5 billion with a gross margin of 75.6%. (Nice margins, particularly in hardware).
Earnings are forecast to reach $4.64 per share (a 628% year-over-year increase), also reflecting an upward revision from earlier projections.
Nvidia's guidance has remained consistent, with the company projecting revenue of about $20 billion, plus or minus 2%.
The key to the earnings report, in our view, will be the Datacenter (the heart of AI) revenues and the guidance for Q1 and full-year 2025 (fiscal year) - see chart 2.
(This is not investment advice)

Source: TradingView. Through year-to-date 2024.
2. Great Expectations! A Look at the Longer-Term
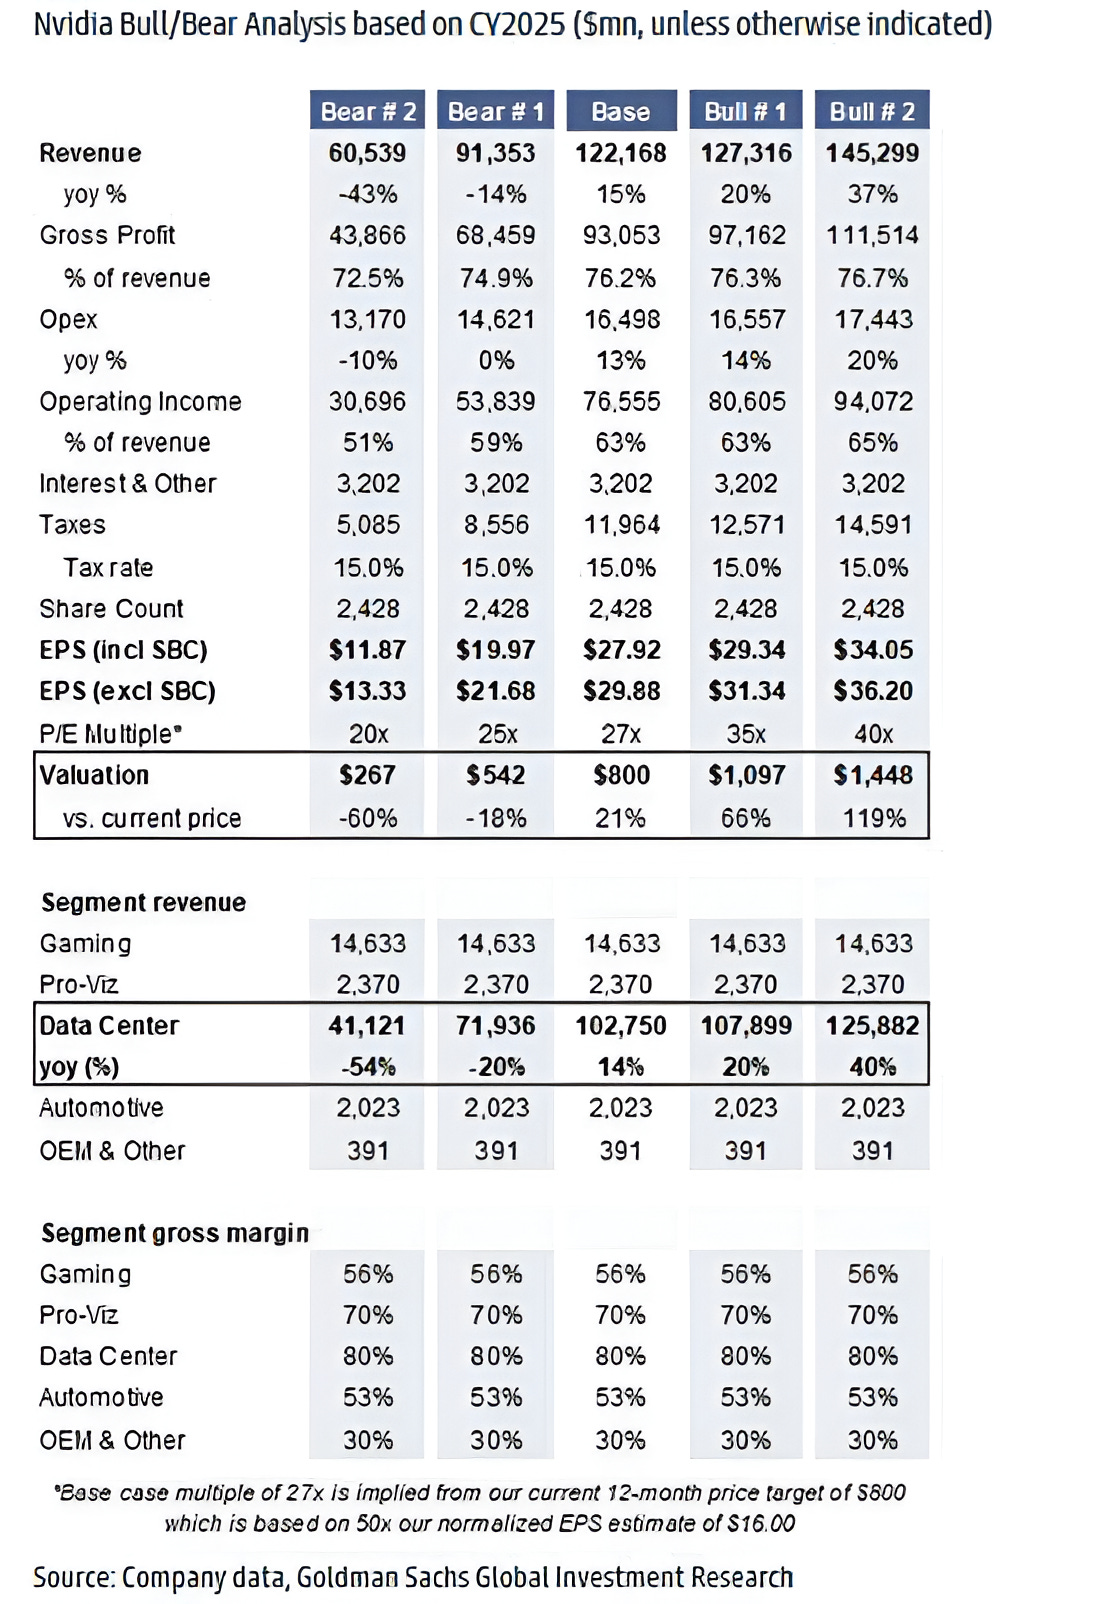
Below is a bull / bear analysis for Nvidia’s fiscal year 2025 earnings (calendar year 2024) outlook that Goldman Sachs put together.
The initial key will be next quarters revenue guide, which is expected to be in the $25-$26 billion range (up from the $20.55 b for Q4 that is expected to be announced in tonight’s earnings report).
With continued revenue growth, the $25 billion in Q1 will put the company on a path to $120-125 billion in 2025 (calendar year 2024) revenue that Goldman has indicated as their base case.
As Goldman highlighted in the Segment Revenue section, investors will be focused on the outlook for the Data Center.
It will likely take something better than the base case (bull 1 or bull 2) to push Nvidia shares higher.
Will the base case be enough to avoid a sell-off?
I think a significant sell-off is unlikely while some normal profit taking after the 50%+ 6-week run would be normal.
It is possible that similar to the period after the May 2023 earnings - shares could move sideways for an extended period (Chart 1).
Get your popcorn ready!
(This is not a recommendation to buy or sell any security and is not investment advice).
Source: Company Data and Goldman Sachs. Through February year-to-date, 2024.
3. A Reminder from Palo Alto Networks
Palo Alto Networks (ticker: PANW), a leader in enterprise security, reported earnings last night. (This is not a recommendation to buy or sell any security).
On the earnings call, Palo Alto CEO Nikesh Arora said customers were facing “spending fatigue” in cybersecurity.
Customers are finding that adding incremental products “is not necessarily driving a better security outcome for them.”
The company’s results and management commentary has put pressure on all enterprise security stocks today and Palo Alto shares are down over 25%.
I highlight this because:
Enterprise security is an area of tech where there is rarely “spending fatigue;”
According to an Evercore survey prior to earnings season, enterprise security was expected by most investors to outperform within tech given likely results;
The 25% drop in Palo Alto shares is a reminder of the drawdown potential with a disappointing outlook;
With all cyber-security names trading down in sympathy, earnings are often not only about one company.
Notably, Palo Alto was trading well above its 200-day moving average (green curved line on the chart).
Today’s sell-off has nearly reunited the pair (price and the 200-day).
Looking at the chart, it’s easy to see the importance of the 200-day as a ceiling in the 2nd half of 2022, perhaps it will be an important floor in the near future.
We will watch.
(This is not a recommendation to buy or sell any security).

Source: TradingView. Through year-to-date 2024.
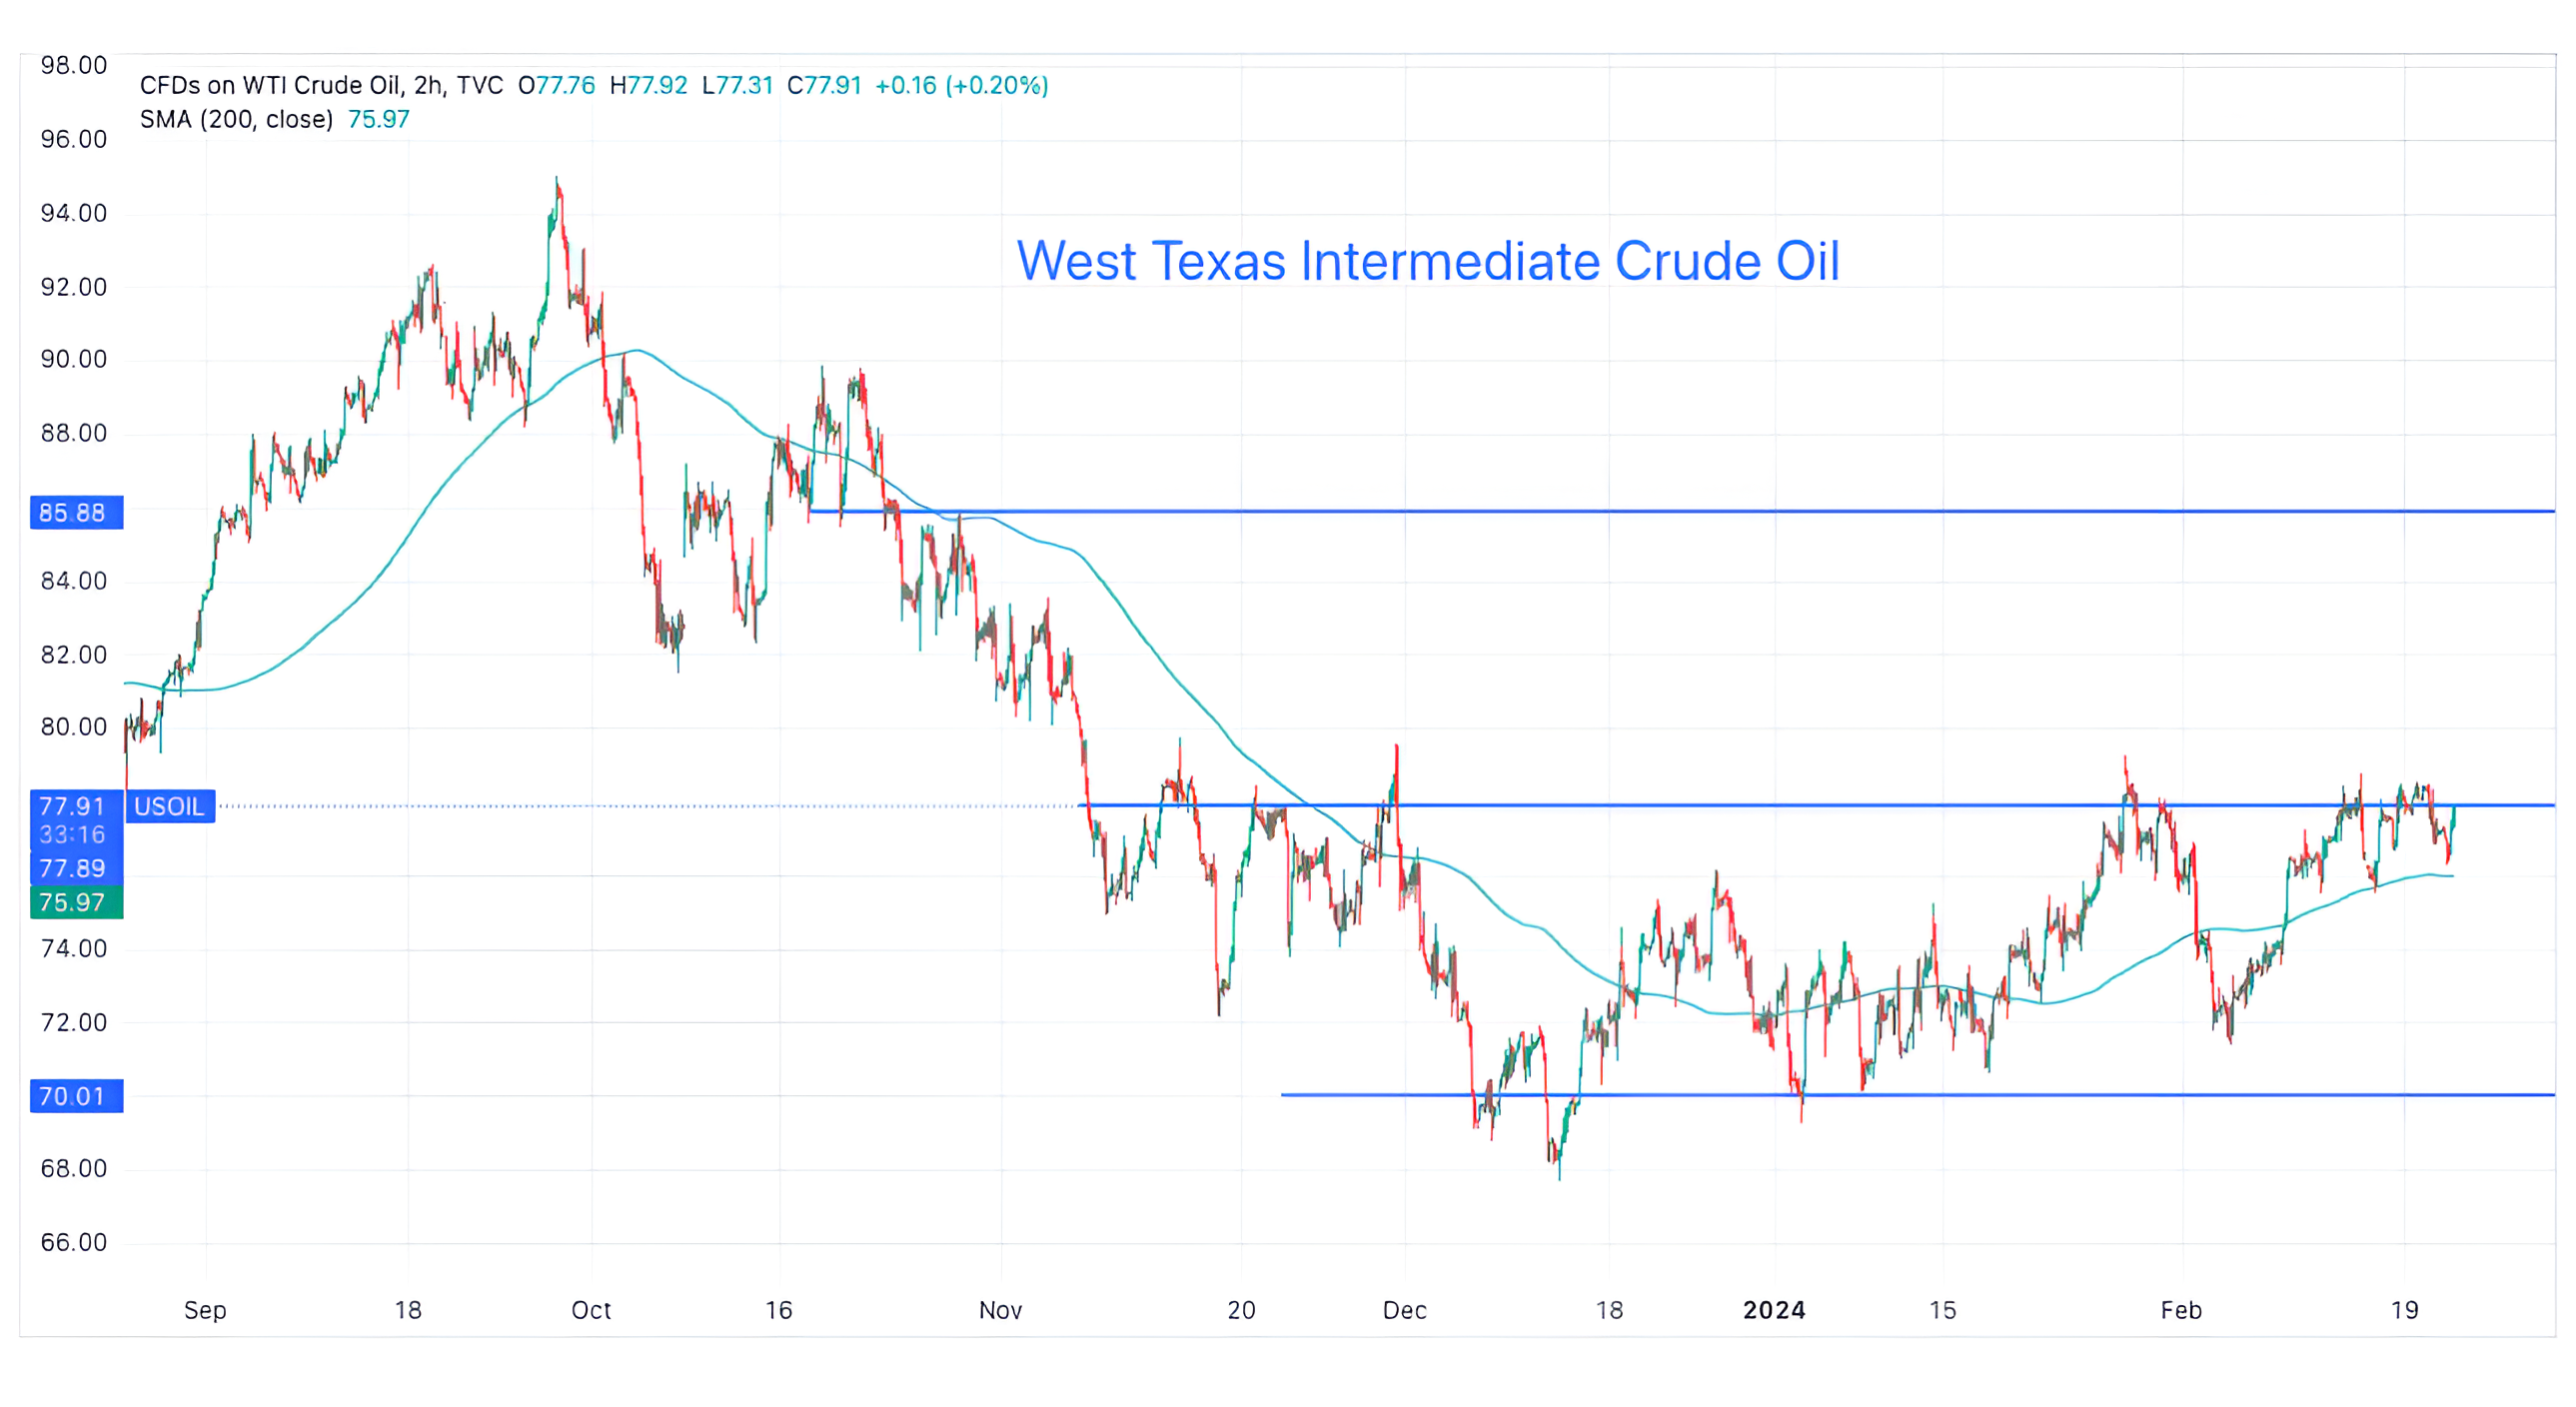
4. I Keep Looking at Oil
The chart below shows West Texas Intermediate crude oil $ / barrel.
On January 30th, the Saudi government ordered the state oil company, Aramco to halt its oil expansion plans and target maximum sustained production capacity of 12 million barrels per day (bpd), 1 million bpd below a target announced in 2020.
Aramco Chief Executive Amin Nasser said he expected oil demand to increase to 104 million bpd this year and to 105 million bpd in 2025. OPEC figures show oil demand reached a record of more than 102 million bpd last year.
If you have been watching recent merger activity in the US - Chevron / Hess; Exxon / Pioneer; Diamondback / Endeavor - the plan is not to add capacity, it is to cut costs and to buy reserves on Wall Street (where presumably management teams believe they’re cheap). (This is not a recommendation to buy or sell any security).
If demand in fact goes up 3 million barrels a day from 2023 to 2025 (in keeping with the long-term 1-1.5% per year of oil demand increase) - where will supply come from?
US supply is stable with little new development, Saudi is stopping expansion, OPEC+ (including Russia) is producing near capacity (as evidenced by the fact that many countries have not hit their quotas) and the US has drained its strategic petroleum reserve.
Oil - as can be seen on the chart below - is probing its recent ceiling level of $78 / barrel.
If the oil price breaks through its recent ceiling, in our view, it would likely climb to the $85-86 range.
If this were to happen, we might see inflation expectations continue to move higher; Fed cuts become more challenging; 10-year yields move higher (see Chart 5); and equity multiples contract - especially in the highest growth areas. (Past performance is not indicative of future results).
We have added to our favorite energy names given our view on the supply / demand dynamics in oil and as a hedge to some of our exposure to higher growth names.
(This is not investment advice).
Source: TradingView. Through year-to-date 2024.
5. 10-Year US Treasury Yields
Quietly, 10-Year US Treasury yields are up 50 basis point (0.5%) this year.
Why quietly?
Over the past two years, fixed income yields have often moved counter to equity valuations.
When 10-year US Treasury yields broke above 4.0% in late July last year, it marked a temporary top in the S&P 500 and conversely, when 10-year US Treasury hit a high of 5.0% on October 23rd, it was 4 days before the Q4 S&P 500 low. (Past performance is not indicative of future results).
However, the 50 basis point increase in 10-Year yields this year has coincided with an equity rally.
We have continued to write that, in our view, a break above the 4.3% barrier could re-open the door to 5.0% yields.
Today, 10-Year US Treasury yields are 4.3%. (We need to see a meaningful break higher to 4.35-4.40%).
In our view, higher 10-year US Treasury yields will constrain further equity upside, and like the price of oil, we want to keep this on our radar.
