I Don't Want to Wait in Vain...
As equity markets wait to splice and dice the details of Nvidia's earnings (tomorrow evening), the S&P 500 is at a level that appears to be a good place to pause. Let's dig in...
With the S&P 500 at a “measured target” (see Chart 1), it is now pausing / consolidating.
In our view, Nvidia’s earnings, which will be released tomorrow after the close, will likely set the tone for the next move in US equities.
As a reminder, Nvidia’s chips are the computational power behind AI and, in many ways, Nvidia’s blow-out earnings call last May set the foundation for the market’s ascent in the second half of the year.
Can Nvidia’s continue to surprise to the upside or have investors begun to price in the majority of the good news?
For now, we wait.
1. The S&P 500 Hit Its “Measured Target” Now What?
When I first learned about technical analysis (the study of investor psychology, money flows, price history and charts), it made little sense to me.
Why would price act in a certain way? Were there enough buyers and sellers to make certain levels important? Given charting software and algorithms was technical analysis simply a self-fulfilling prophecy?
Over time, I saw enough instances of predictable price behavior and important “levels” to convince me that, at the very least, technical analysis deserved a place along side fundamental analysis in my investment process.
In cases when my fundamental analysis was suggesting one thing - a buy or a sell - and the charts reflected the opposite, I needed to double down on my fundamental work to understand what others were seeing that I was not.
With that prelude, below is a chart of the S&P 500.
One of the tenets of technical analysis is that price action is symmetric.
It’s easy to see the 445 point drawdown from the 4580 level in August 2023 to the low of 4135 in late October.
Once the S&P 500 moved above the August high (with a battle in late November and early December) a potential target level was 445 points higher at 5125.
Although it is not shown on the chart below, this level also aligns with the Fibonacci retracement that we referred to in Chart 1 here (we didn’t show the S&P 500 but mentioned it).
As we have continued to highlight some of the more fundamental imbalances in the current market environment - lackluster earnings; elevated valuation; 10-year yields moving higher; inflation (all here); the stronger dollar (Chart 3 here); and seasonality (Chart 5 here) - this is likely a good place both technically and fundamentally for the S&P 500 to pause.
If the issues that we have been highlighting are not resolved, we would not be surprised to see a bit more of a sell-off than a pause.
The first significant downside level we would consider is 4850, below that 4800 (just above the December / January battle-zone) and ultimately 4600 level. (These are not targets, but potential levels to watch in the event of a drawdown).
Our view is that if we can identify levels in advance - it helps with what to look for in order to execute a plan. As we have written, we have raised a little cash over the past month and have bough put spreads for protection.
As a result, if our thesis that the market is stretched results in a drawdown, we want to be able to focus on opportunities rather than licking our wounds.
(This is not investment advice).
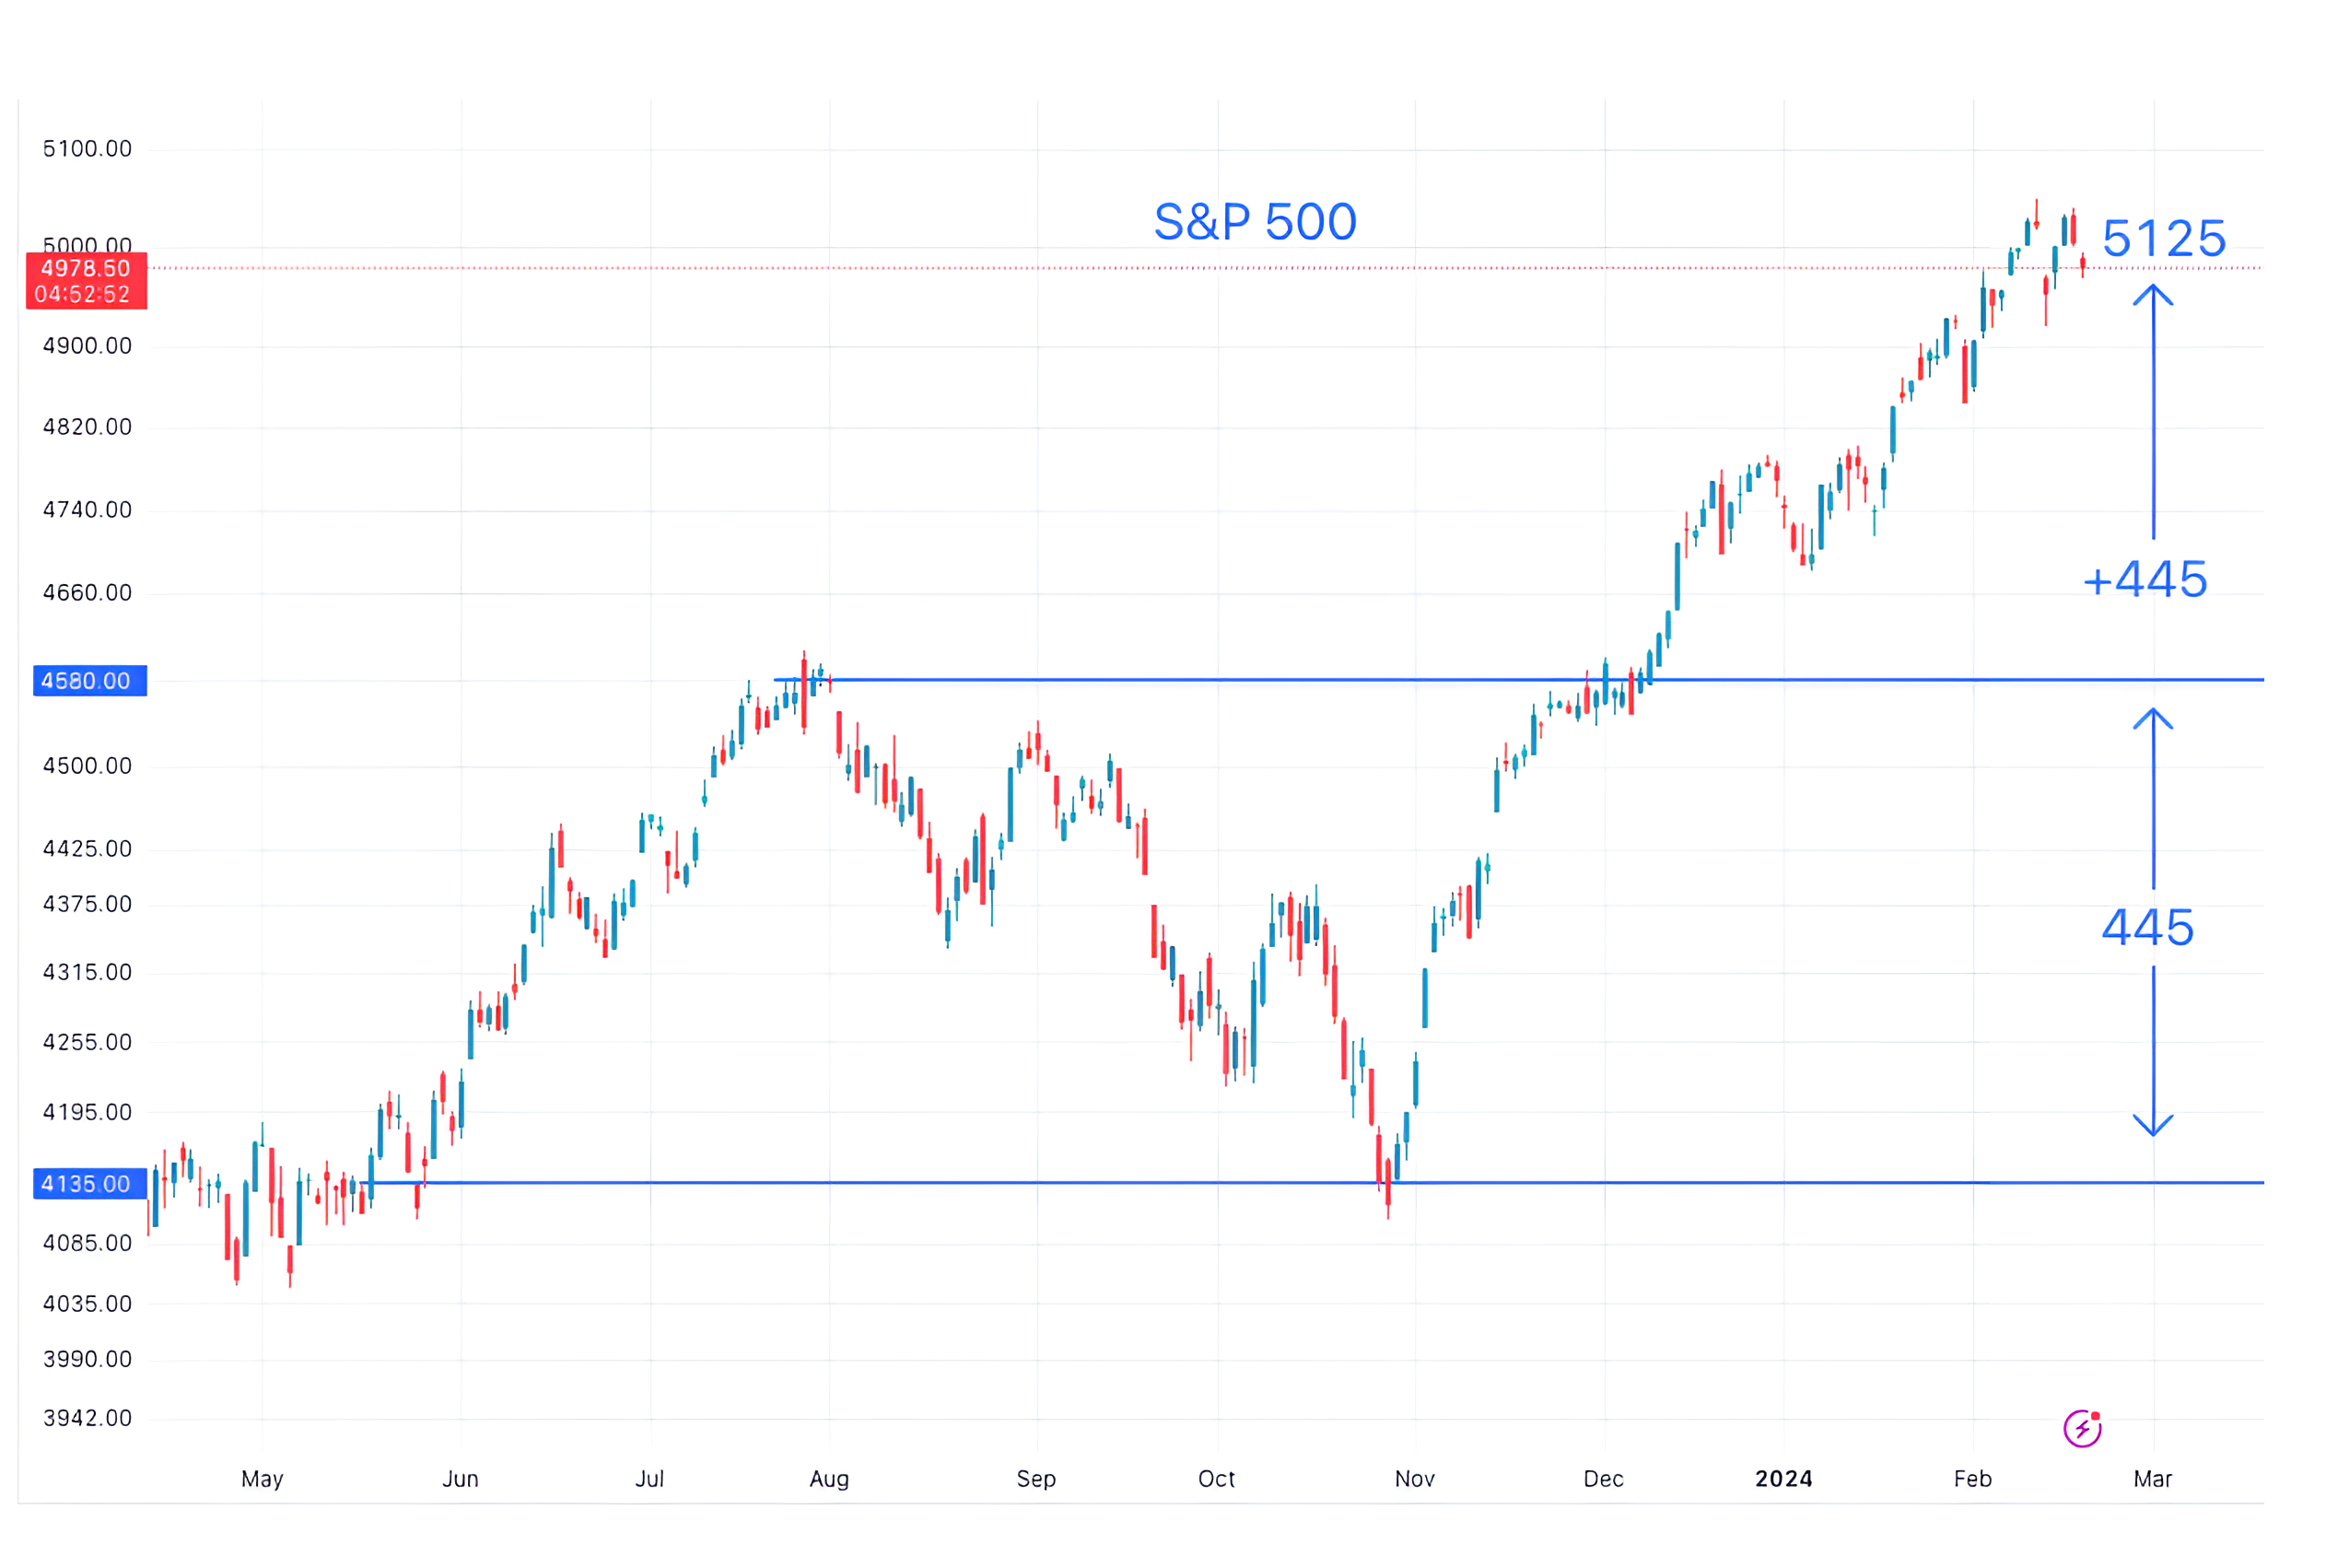
Source: TradingView. Through year-to-date 2024.
2. Don’t Worry, the 2nd Half of the Year Will be Amazing!
While Q4 2023 earnings went up slightly last week as companies reported better than expected earnings, Q1 2024 earnings expectations continued to come down.
Since December 8, earnings expectations for Q1 have dropped 3%. (As a reminder, management teams have the greatest visibility into Q1 results as we are half way through the quarter).
Over the same period, Q2 2024 expectations have dropped 2%.
Despite the drop in expectations for the first half of the year, expectations for the second half of the year have remained elevated, and full year 2024 guidance has only declined by 1%.
As can be seen on the chart below, Q3 2024 earnings are expected to increase 7.4% from the record Q3 2023 earnings period.
Q4 earnings are expected to be a new record and to increase 17.6%.
While this is possible, we would likely include ourselves in the skeptical camp.
In the meantime, those that use these projections to calculate price to expected earnings to value the index may be using an artificially high denominator resulting in a lower valuation than if a more conservative approach to future earnings were considered.
On Friday, Goldman Sachs increased its 2024 year-end target for the S&P 500 from 5100 to 5200 citing an improved earnings outlook.
Their “improved” outlook reflects 8% earnings growth which would represent $240 in earnings for the S&P 500 (based on the current estimate of 2023 earnings) which is slightly below the current consensus “bottoms-up” estimate of $242.50 calculated by FactSet and presented on the chart below.
While our expectation for 2024 earnings is $235 (6%) growth, we think the upside in the index may be dictated by 2025 expectations (currently $275).
In the event that 2025 earnings remain around $275 (even if we do not believe they are achievable), even with slight multiple contraction, we could see a year-end S&P 500 level of 5400 (19.6x).
That said, we believe that security selection and sector weightings will continue to be significant drivers of performance.
(This is not investment advice).
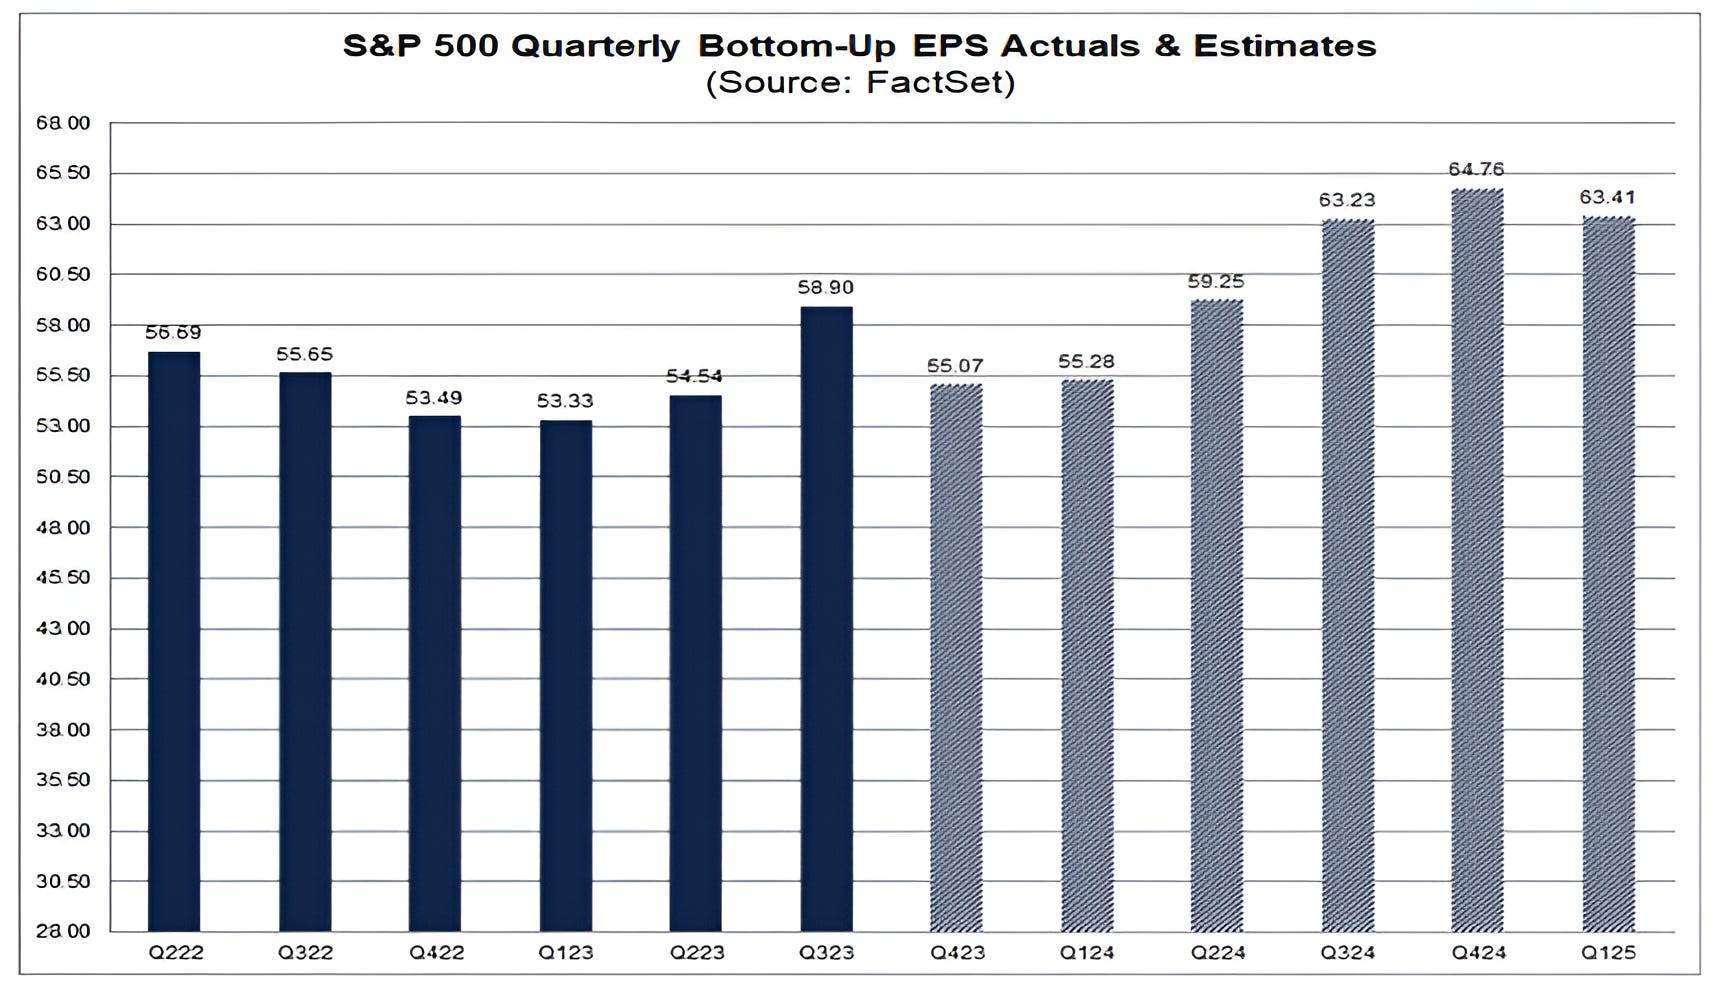
Source: FactSet. Through February 16, 2024.
3. All Nvidia, All of the Time
The big event this week for US equity markets is that Nvidia is reporting earnings tomorrow evening after the close.
(THIS IS NOT A RECOMMENDATION TO BUY OR SELL NVIDIA SHARES OR ANY OTHER SECURITY).
While we often write about the Magnificent 7 driving equity markets, Nvidia’s 400%+ return since the beginning of 2023 may have anointed it the Magnificent 1.
Nvidia’s graphic processing units (GPUs) are the best suited semiconductors for the computation requirements of large language models that power artificial intelligence (AI).
As a result, orders for Nvidia’s GPUs and the companies results over the past year have been dramatically above expectations.
The markets initial realization of the AI trend was when Nvidia announced earnings last May and provided guidance that was double estimates (the long candle on the chart below that marks the move above the middle horizontal line).
Since last May, reality has outpaced the heightened expectations and guidance has continued to move higher.
This has driven the whole AI ecosystem higher from other semiconductor companies, to data centers, to power management and cooling companies.
Nvidia, in many ways, has been the foundation for the S&P 500s 21% return since May 2023.
In other words, Nvidia’s earnings and outlook tomorrow night are important.
While we have participated in the Semiconductor rally (here), we think data is going to be an increasingly important asset (what the large language models train on) and the software that participates in or benefits from AI (including biotech) may be the next leg of significant alpha generation. (We will revisit this thesis).
I have included annotations on the chart similar to those in Chart 1.
We can see that Nvidia, for a time, was constrained by the symmetric upside at around the $500 level (the range looks smaller because it is a logarithmic chart), but was able to break through.
Not shown on the chart is that Nvidia shares have hit their 2.618 Fibonacci extension of their 2022 sell-off. Yes, that’s a thing.
While all of these technical levels may be meaningful, the true test, in our view, will come from the fundamentals.
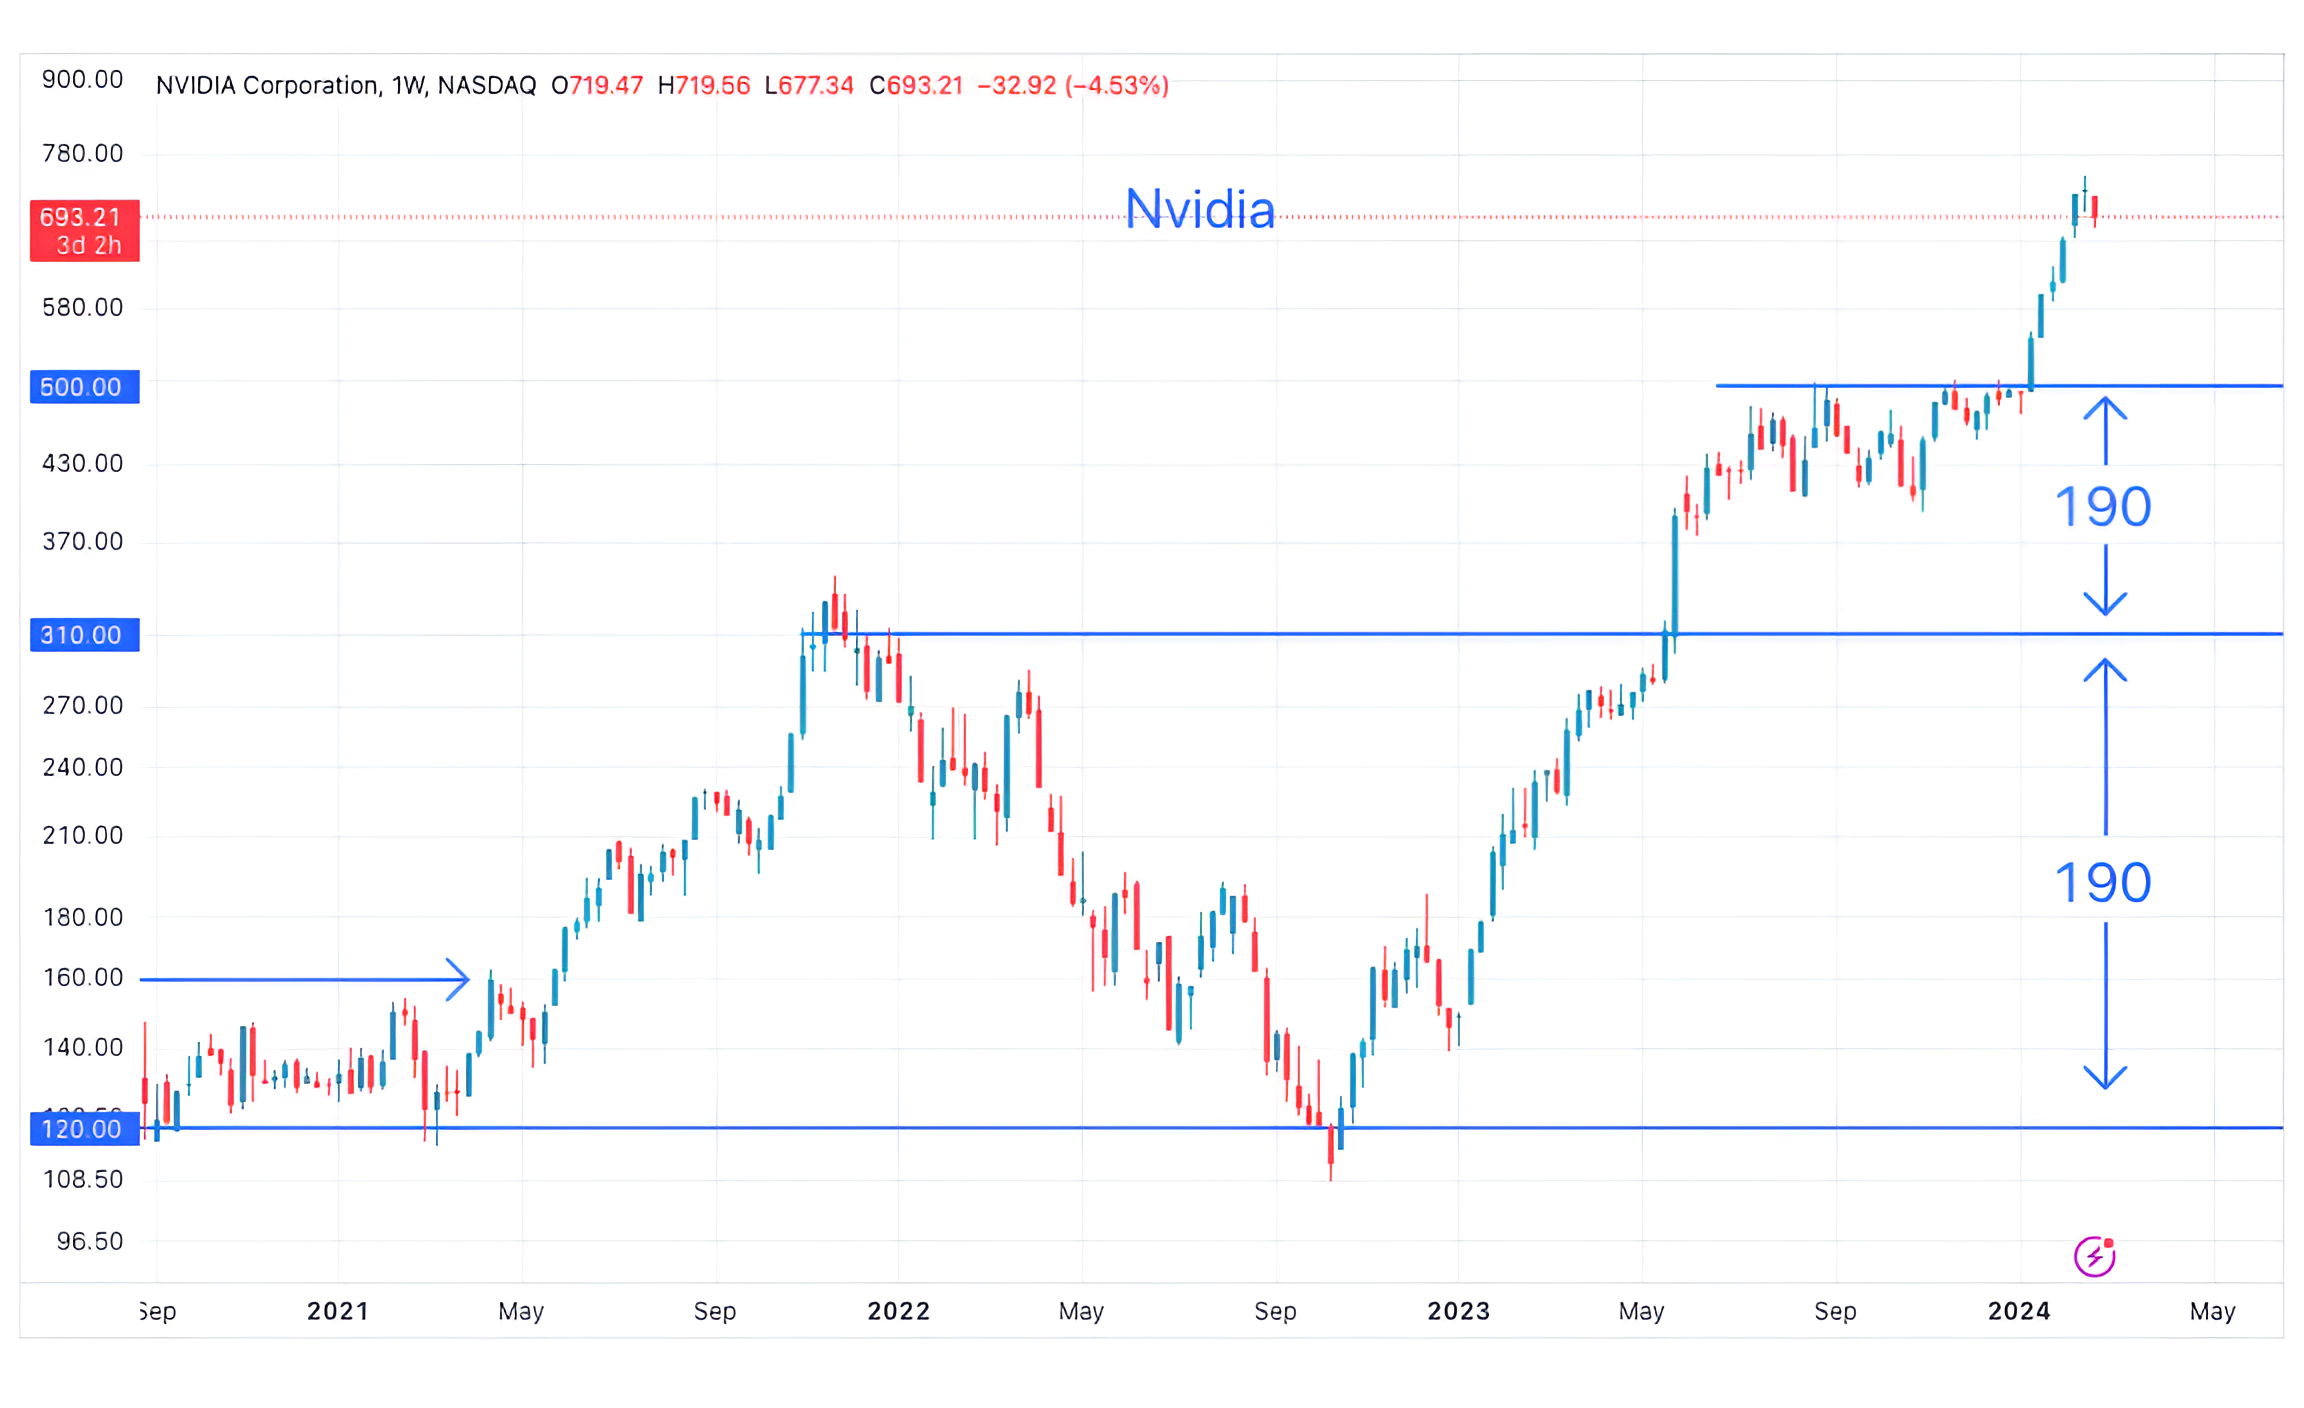
Source: TradingView. Through year-to-date 2024.
4. “No, No, No” - You Don’t Love Me and I Know Now*
Anyone that knows my questionable sense of humor, will understand why I couldn’t resist including the charts and the “analysis” below.
For the rest of you, I apologize in advance.
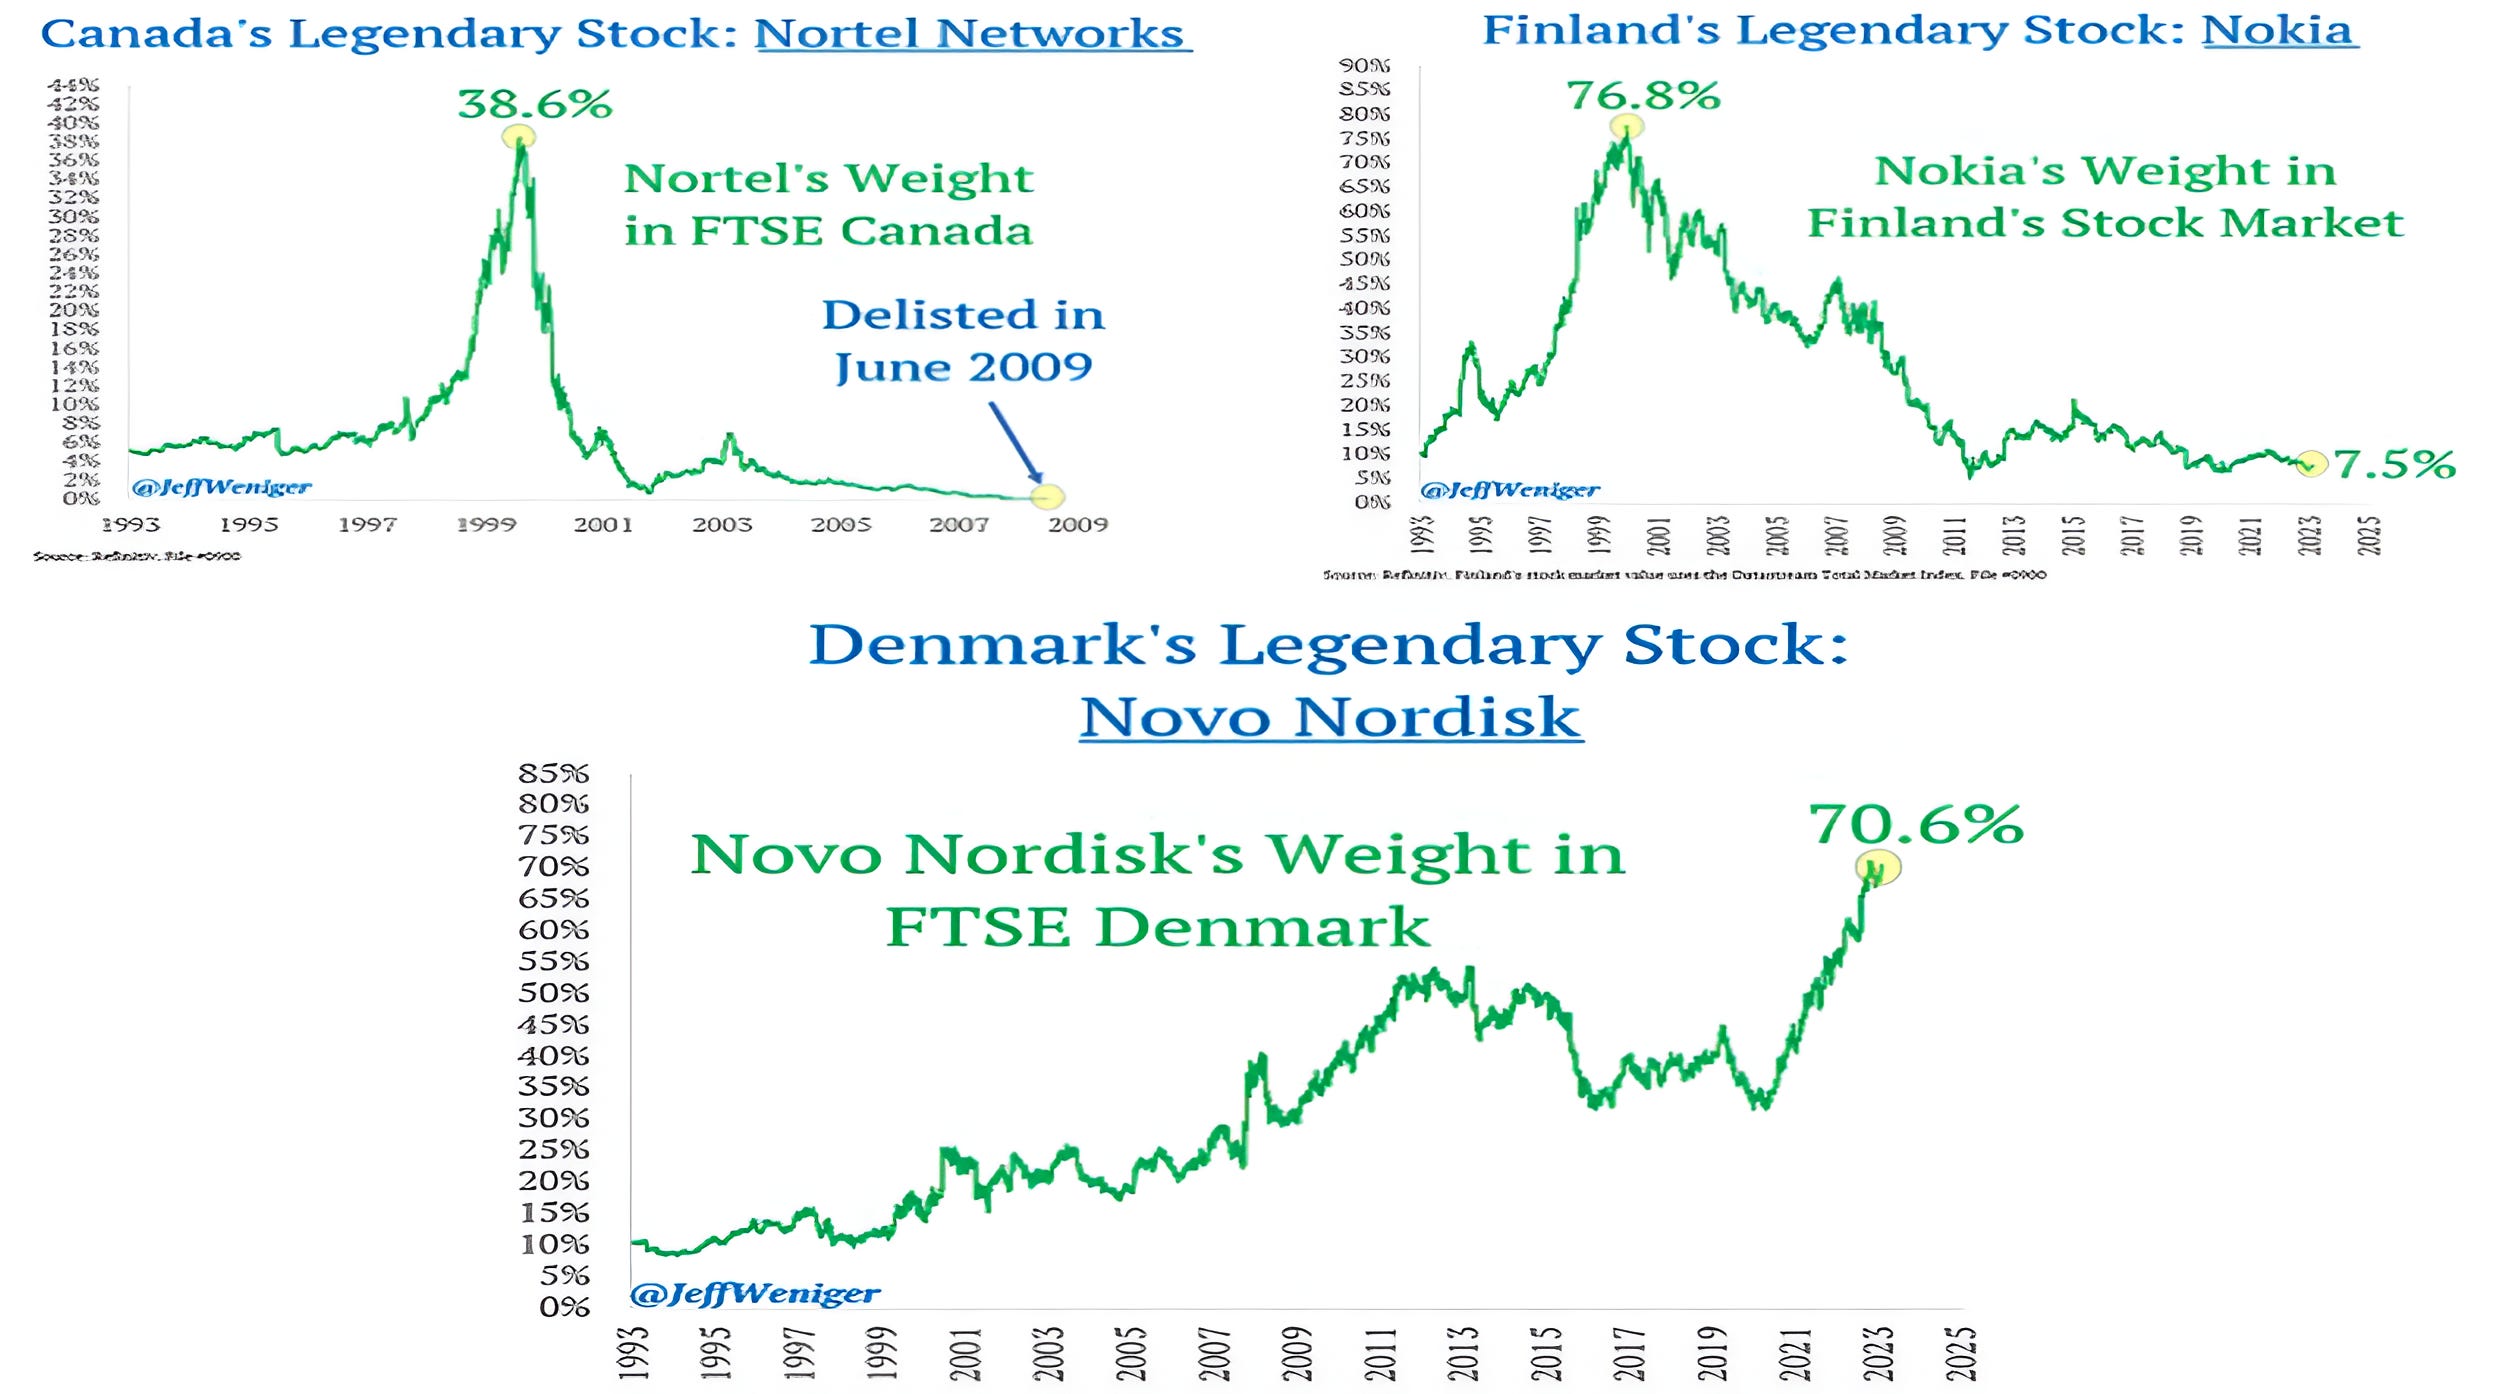
At its peak, Nortel reached 38.6% of Canada's stock market. The stock went to $0.
In Finland, Nokia reached 76.8% of the stock market's total value before a 90%+ drop.
Today, Novo Nordisk is 70.6% of Denmark's stock market. Will history repeat?
While we don’t know, Jeff Weniger on X (formerly Twitter), wrote if it happens again, we will call it the "NoNoNo Curse."
In the words of *Dawn Penn (here): “No, No, No - you don’t love me and I know now.”
(Past performance is not indicative of future results / this is not a recommendation to buy or sell any security).
Source: Jeff Weniger. Through year-to-date 2024.
5. How Much Institutional Memory is in Markets?
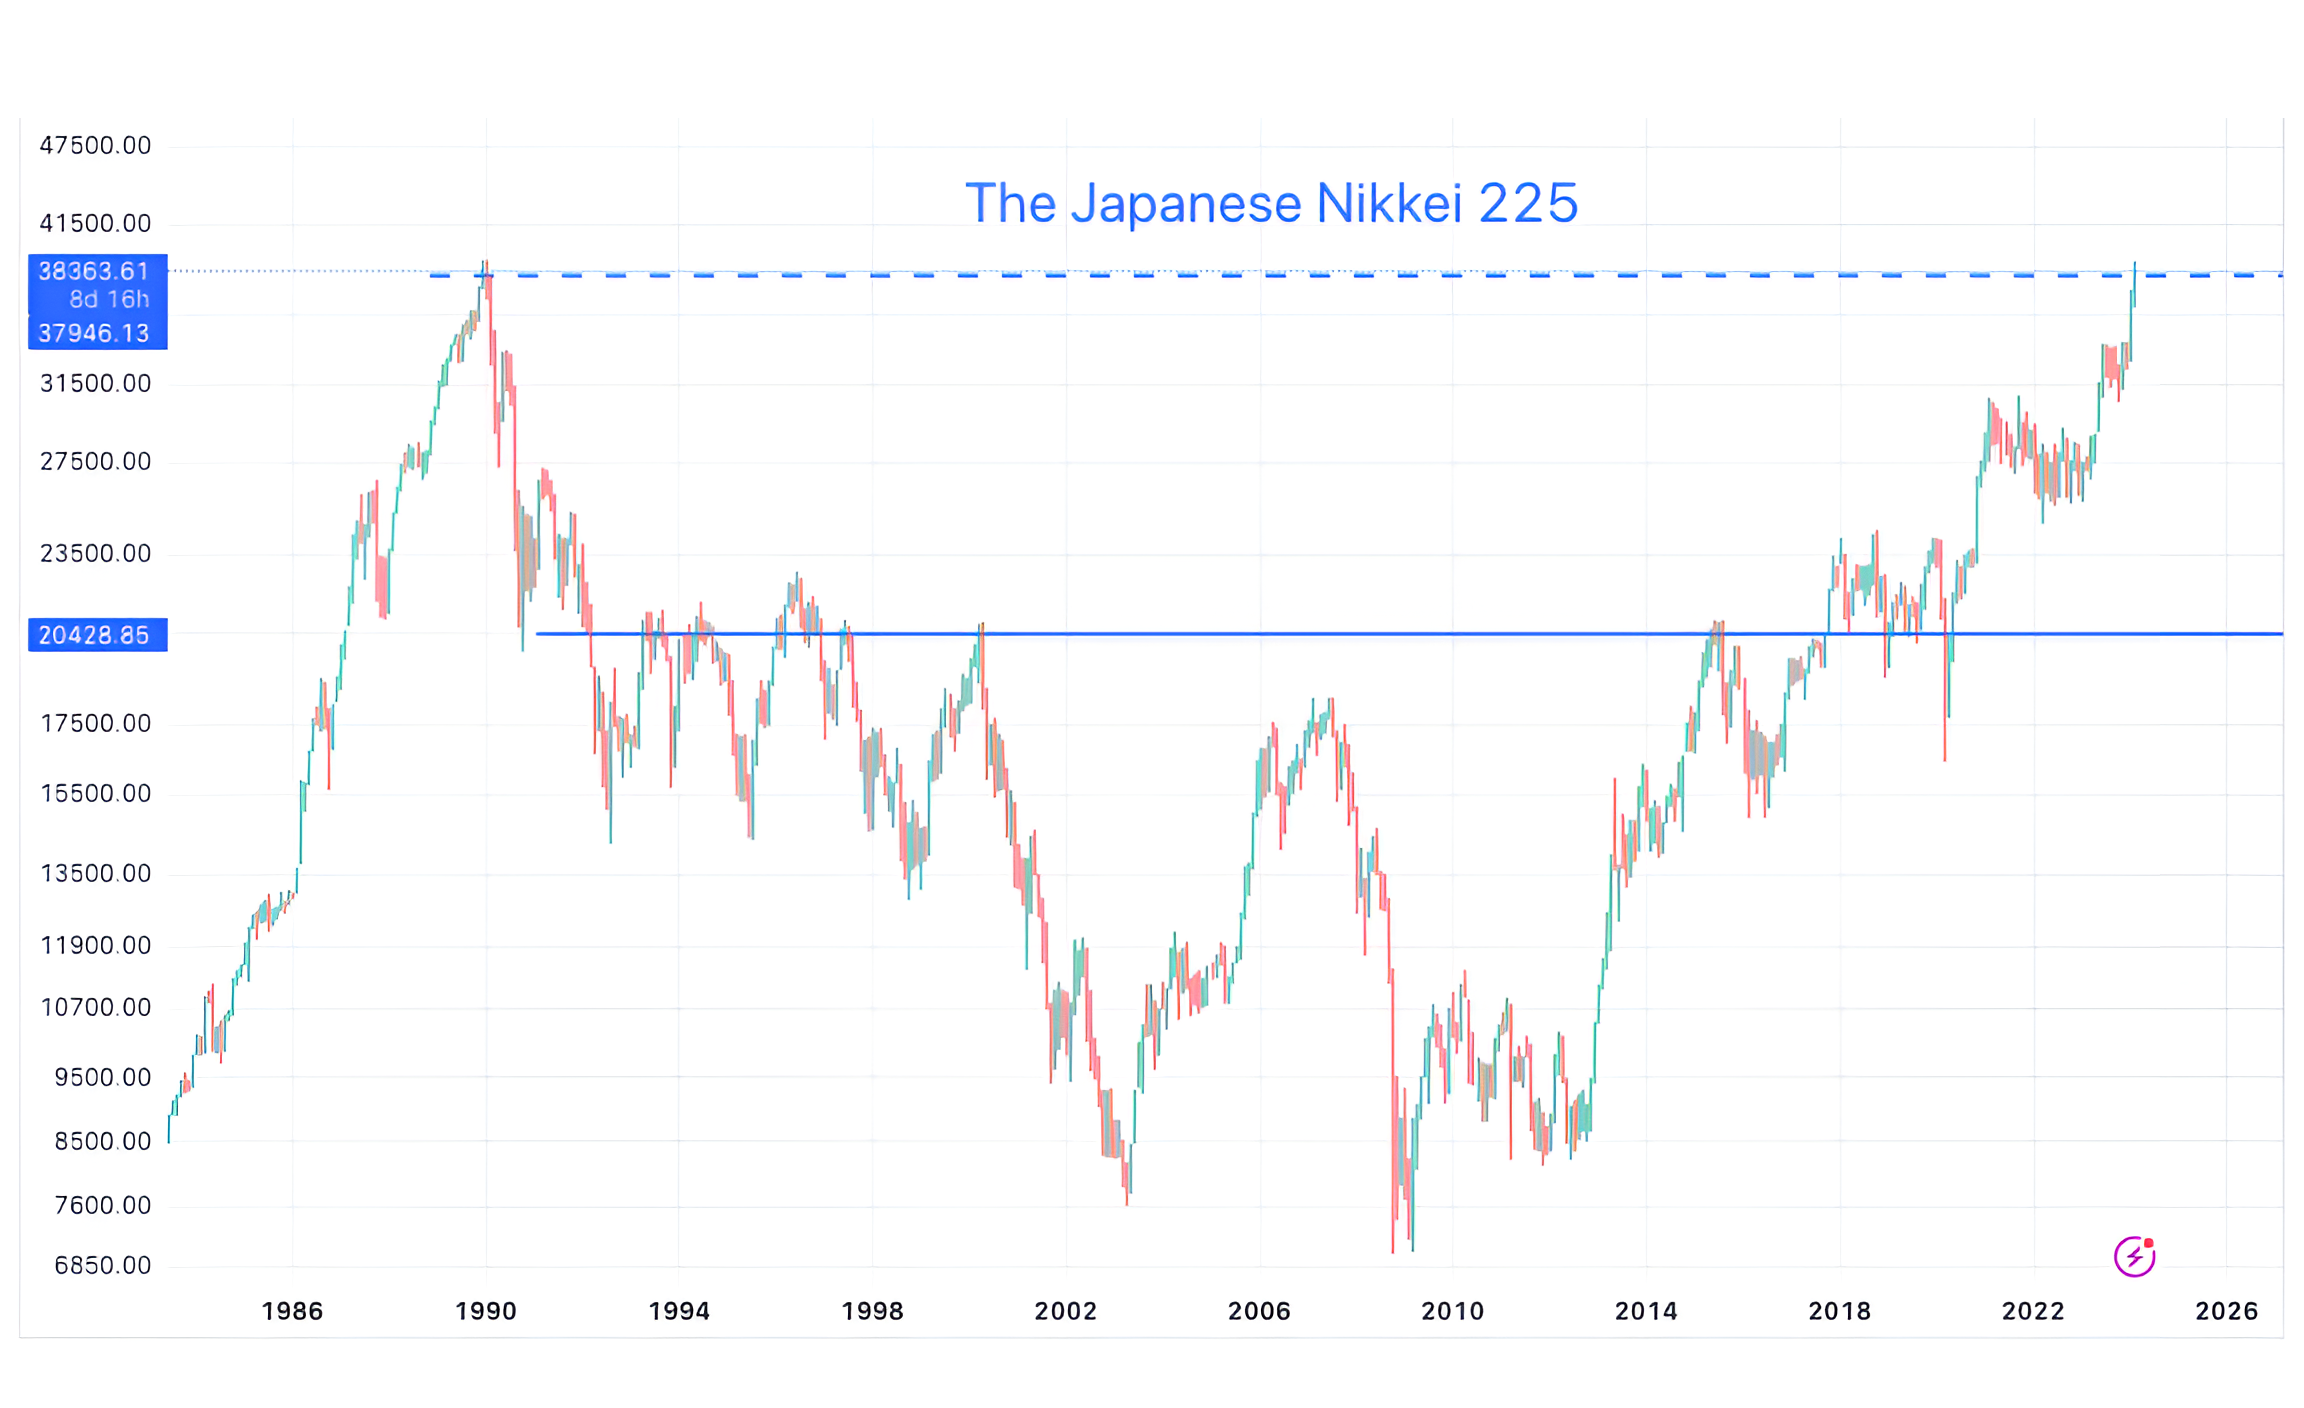
The chart below shows the Japanese Nikkei climbing back to its 1989 / 1990 peak.
Many believe that after climbing back to a past peak level after a fall, asset prices pause because those that bought at or near peak levels sell with the relief of “getting back to even.”
Important price levels like past peaks are sometimes referred to as institutional memory.
In Chart 1, we can see the pause / hesitation in late December / early January as the S&P 500 moved back to its July high.
In Chart 3, the pause right before the big earnings move in May 2023 is less evident than the pause that occurred at the $270 level - an area where there had clearly been a lot of buying and selling (institutional memory) in the past.
The question is what holder of the Japanese Nikkei has been waiting 34 years to “get back to even” before selling?
We have included a horizontal blue line in the area where we believe there was institutional memory. We often refer to those areas with significant buying / selling as battle-zones.
That said, we wouldn’t be surprised to see a pause in Japanese equities simply because there are likely algorithms set to sell futures at current levels.
If a pause were to occur at current levels, it would likely have little to do with fundamentals.
While I’m sure the press will write about earnings, monetary policy, the Japanese recession and / or the Yen as a reason for the pause (if it occurs), none of these characteristics have changed significantly for the worse since the beginning of the final ascent.
We will continue to watch.