Aint No Stopping Us Now! Or is There?
14 positive weeks out of the last 15. Valuations don't matter; Fed rate cuts (down to 5 from 7 in the next year) don't matter; Treasury yields (below) don't matter; Macro doesn't matter. Or will it?
Although we have continued to highlight the inconsistent macro (economic indicators, dollar, yields, oil) and micro (does anybody remember earnings?) data, we learned last year that these types of imbalances can persist longer than we might think.
While we have calibrated portfolios by raising a little cash; emphasizing our favored companies and sectors within portfolios (see chart 2); and buying puts spreads (just because we have fire insurance doesn’t mean we want our house to burn down); we have generally cautioned not to over-react.
It is rare, if not unprecedented for the S&P 500 to move higher in 14 of 15 weeks (I think 13 of 14 weeks was the first time in 50 years, we highlighted 12 of 13 weeks and what happens after in chart 3 here).
If equities were to correct 3-5% this would be normal within the context of an uptrend, we will continue to watch and present all of our as a guide to positioning.
If there is a more significant sell-off, we will look back and say the signs were there.
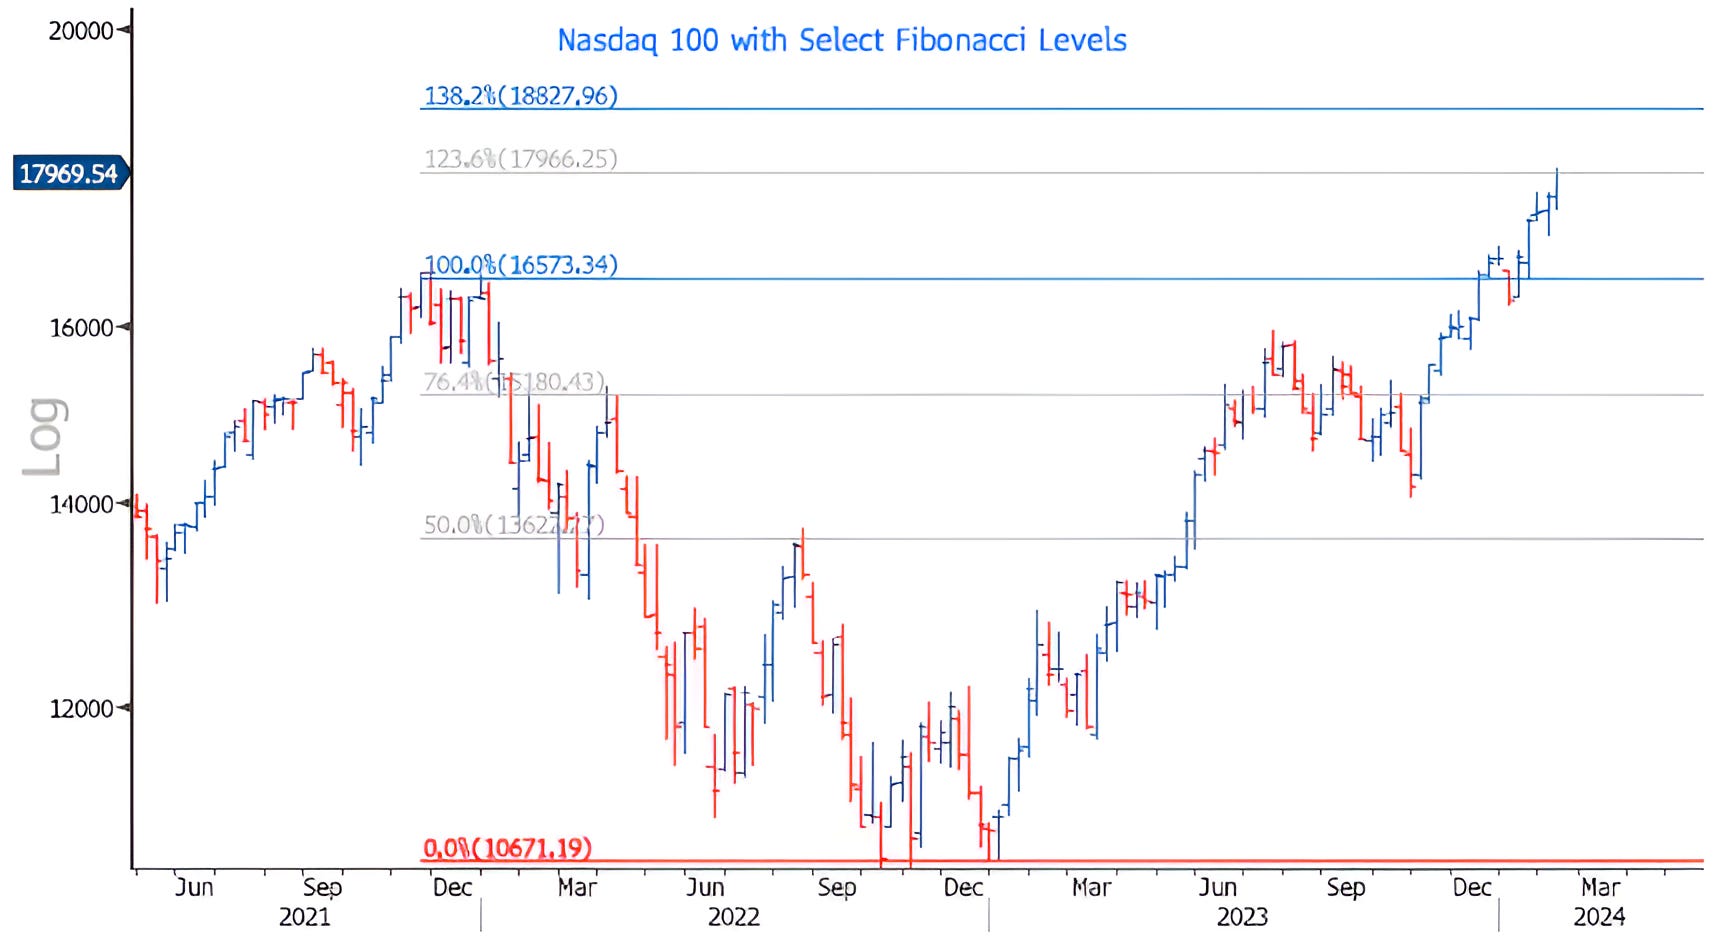
1. The Nasdaq 100 - A Good Place for a Pause
Below is a chart of the Nasdaq 100 Index with select Fibonacci retracement (lower) and extension (higher) levels.
As a reminder, a Fibonacci sequence is a sequence in which each number is the sum of the two preceding ones.
Why / how does this apply to markets and charts?
While I’m not sure what bucket of investor psychology Fibonacci sequences initially filled or how it was determined to have any relevance, I believe that more recently, along with other “signals,” Fibonacci levels have likely been programmed into many large algorithmic trading models and has therefore become a self-fulfilling prophecy.
Regardless of how, like other technical signals, we have seen Fibonacci levels represent important areas of buying and selling (what I like to call battlegrounds).
Simply looking at the chart below, we can see how in March 2022, the Nasdaq Index bounced up to what became the 76.4% level of the eventual decline and that there was a battle in that same area from July to October last year.
Given many of the imbalances that we continue to cite (we have included oil, 10-Year Treasuries and seasonality below), we find it notable, that this week (today in fact), the Nasdaq 100 has kissed the 123.6% extension of its 2021 to 2022 sell-off.
While this level might not be the cycle high (and it may trade up a little more early next week as the S&P 500 has not quite reached its 123.6% extension - 0.5% away), in our view, given the 14 of 15 week rally (blue ticks are positive on the chart, while red are negative), this is likely a good place to pause.
(Past performance is not indicative of future results)
Source: Bloomberg. Through year-to-date 2024.
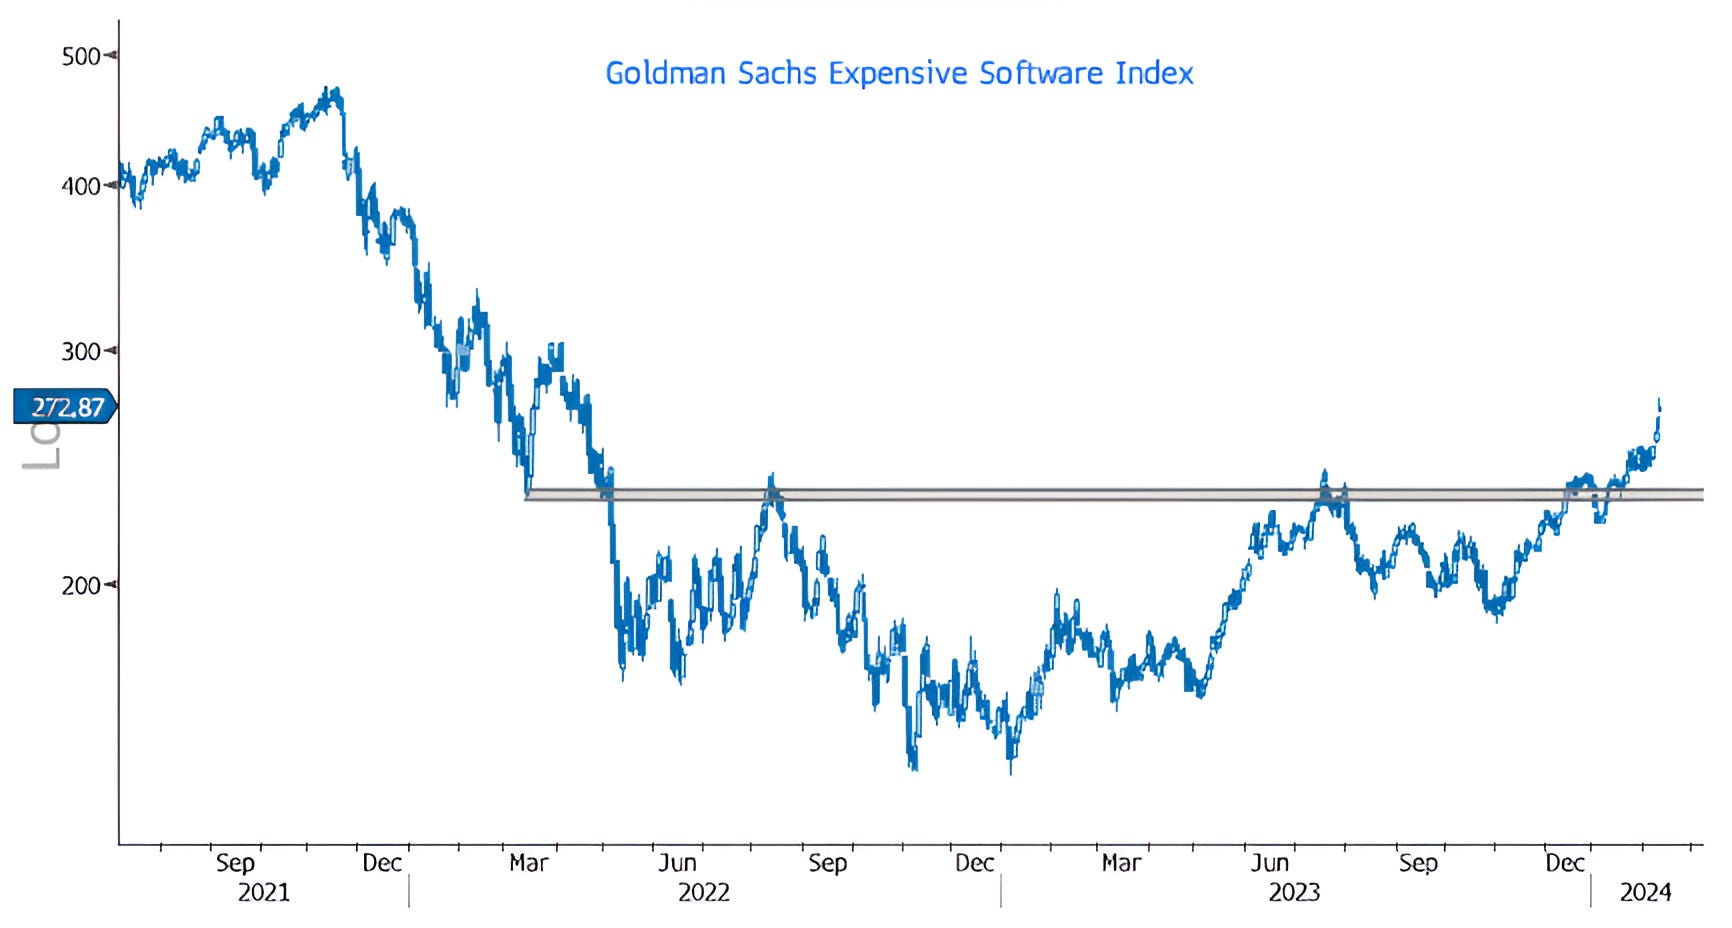
2. “Expensive” Software Moving Higher!
Raise your hand if you didn’t know that Goldman Sachs has an “Expensive Software Index.” (My hand is raised).
This basket includes names like Palantir, Confluent, Cloudflare, Gitlab and others.
Goldman creates Indexes and baskets of securities such as the Expensive Software Index to allow their clients to participate broadly in a theme or to hedge risk by shorting the basket or by buying options against it.
In any event, we wanted to highlight this because:
In addition to Semiconductors (shown here), software is now joining the party;
Despite the fact that it is labeled as expensive, from November 2021 to November to November 2022, this index was down 69% which let significant air out of the valuation bubble;
These shares are generally moving higher on better than expected earnings and outlooks or simply outlooks that are “de-risking” expectations;
This area of the market may be fertile ground for those looking to diversify away from the Magnificent 7;
Although this represents a small segment of the S&P 500, the move above the prior ceiling (grey shaded area) is an indication of broader participation.
In full disclosure, our portfolios are very overweight this corner of the market through a combination of individual equities and ETFs. (Positions can change at any time. This is not a recommendation to buy or sell any security).
If the market were to pause or even move down from current levels, this is an area that we will watch as a barometer of risk appetite and profit taking. Any move back below the grey shaded area would be a significant negative in our view.
Source: Bloomberg. Through year-to-date 2024.
3. Don’t Forget About Oil
While the news this week has been about the S&P 500 moving above the 5000 threshold and the positive reaction to many earnings releases (we will go through this next week), oil has quietly moved up 6% since Monday, outpacing the S&P 500 (+1.3%) and the Nasdaq 100 (+1.9%).
We continue to watch oil as its is correlated with inflation and inflation expectations and higher inflation is often consistent with lower valuation multiples.
In our view, the $78.25 level (red dashed line on the chart) which was the January 29th level is an important threshold (WTI is currently at $76.64).
If oil prices, move through the January 29th high, the $82 area (the highest light grey shaded zone) will come into play.
Let’s keep this on our radar.

Source: Bloomberg. Through year-to-date 2024.
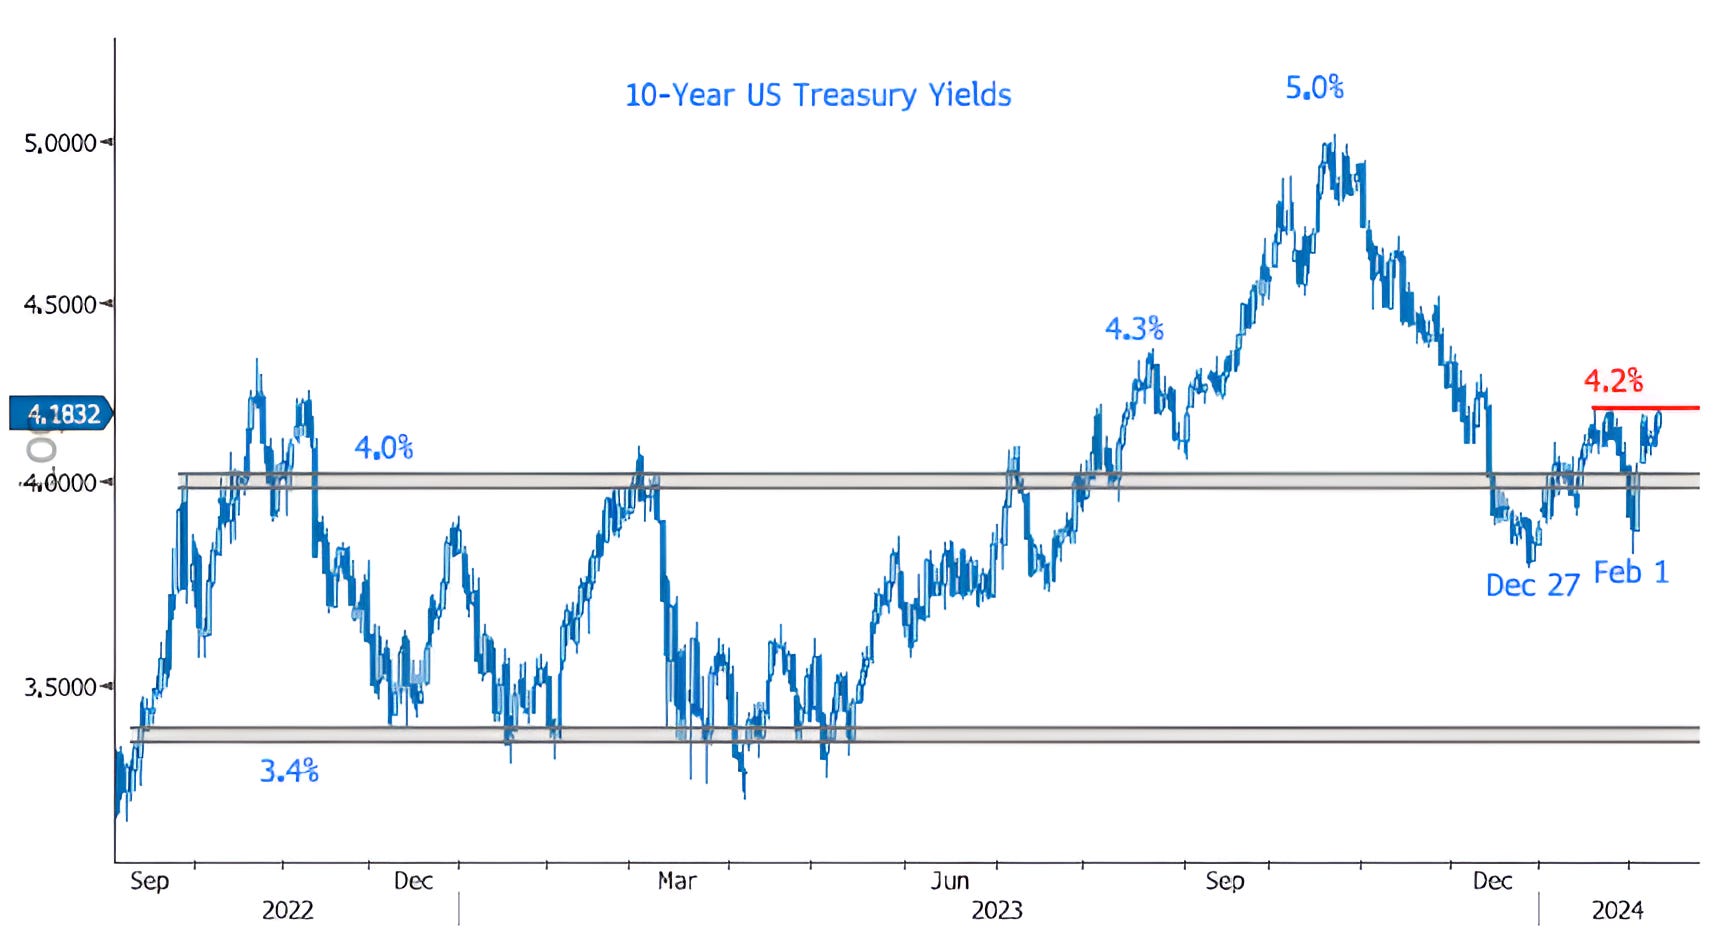
4. Knock, Knock, Knockin’
10-Year US Treasury yields are knocking on the 4.2% (red line on the chart) door.
In our view, a break above the 4.2% and perhaps, more importantly the 4.3% barrier (this has been a critical long-term level) could re-open the door to 5.0% yields.
As a reminder a combination of growth, inflation expectations and term premium (essentially a metric of investor appetite and risk sentiment) are seen as the key drivers of long-term treasury yields.
It is important to remember that equities were able to rally in the first half of last year as 10-year US Treasury yields remained in a range below 4.0%.
When 10-year US Treasury yields broke above 4.0% in late July, it marked a temporary top in the S&P 500 and conversely, when 10-year US Treasury hit a high of 5.0% on October 23rd, it was 4 days before the Q4 S&P 500 low. (Past performance is not indicative of future results).
In our view, higher 10-year US Treasury yields will constrain further equity upside, and like the price of oil, we want to keep this on our radar.
Source: Bloomberg. Through year-to-date 2024.
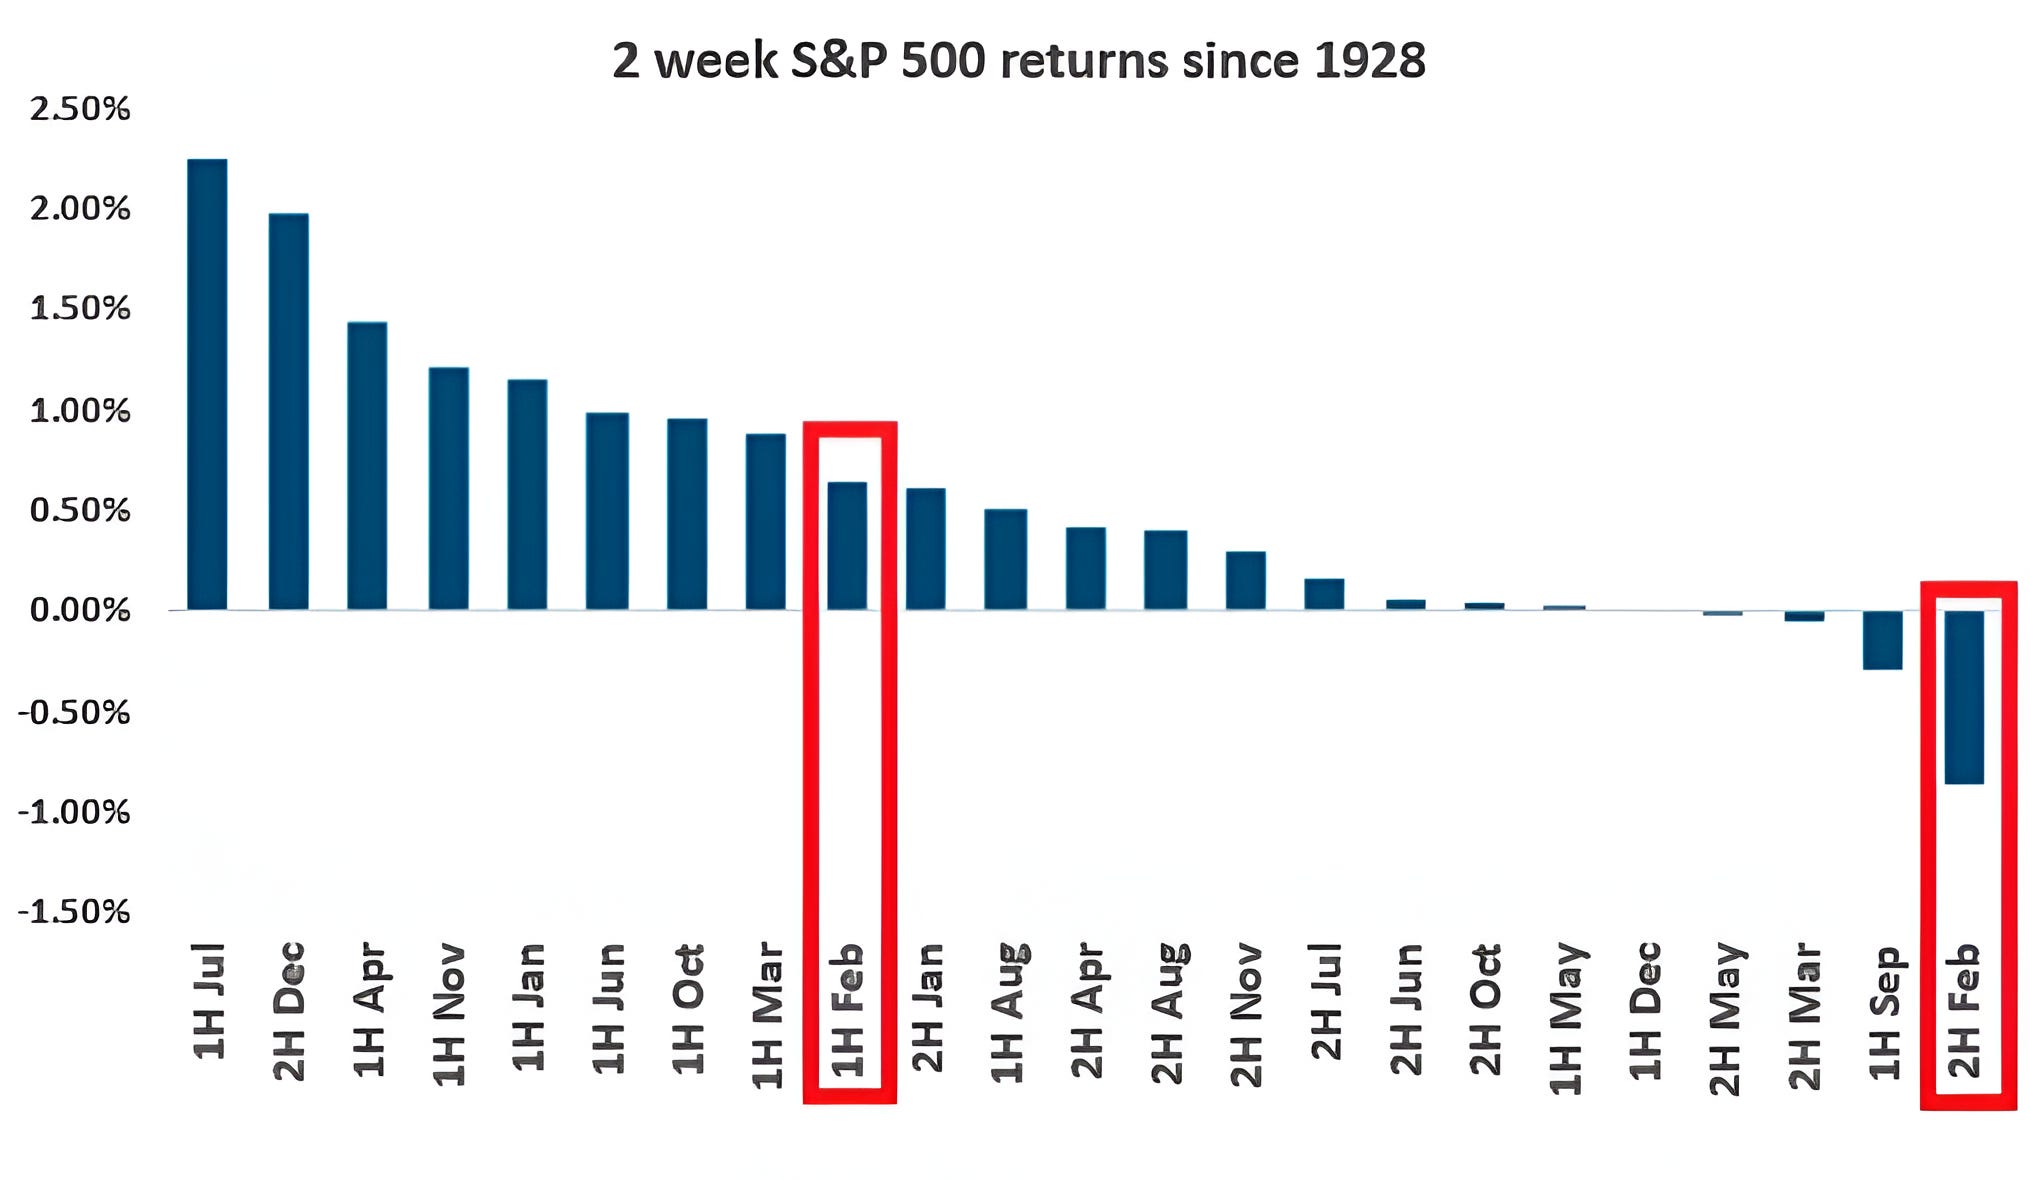
5. Seasonality - Showing this One Again…
We like to consider ourselves aware and respectful of, but not beholden to, seasonality.
What does this mean?
There are times when equity markets has moved lower and a cautious / negative narrative develops. If this is part of a typical seasonal cycle, we may want to recalibrate our portfolios before the seasonal trends reverse.
There are other times when we can be patient in portfolios as we recognize that market activity is “normal”.
We also want to be acutely aware of when the market does something atypical.
With that in mind, Goldman Sachs has looked at average returns for each half of each month from 1928. (Somehow, the 2nd half of September did not make it on to the chart).
While the first half of February is a little better than average, the second half of February, on average, has been the worst two-week period of the year. (Past performance is not indicative of future results).