


Semiconductors are Eating the World
Driven by AI, the metaverse, autonomous vehicles (they're coming), industrial robotics and the "internet of things" (yes, this still exists), Semiconductors are driving equity markets higher.
1. Semiconductors and Everything Else
In 2011, Marc Andreessen, the inventor of Netscape (one of the earliest internet browsers) and founder of Andreessen-Horowitz (a prominent venture capital firm), wrote a prescient essay titled “Why Software Is Eating the World.” (here).
The essay’s accurate prediction of much of what has transpired over the past 13 years is incredible:
“We are in the middle of a dramatic and broad technological and economic shift in which software companies are poised to take over large swathes of the economy.
More and more major businesses and industries are being run on software and delivered as online services—from movies to agriculture to national defense.”
As Andreessen stated, “more and more major businesses and industries are being run on software” and this has required increased computational power with heightened specialization.
The Semiconductor industry, in its earliest stages, was a commoditized business. There was little differentiation and minimal pricing power.
Over time, there were acquisitions, bankruptcies and, ultimately, consolidation.
Today’s Semiconductor industry is highly specialized, growing and profitable. It is the backbone of the software that is pervasive across businesses.
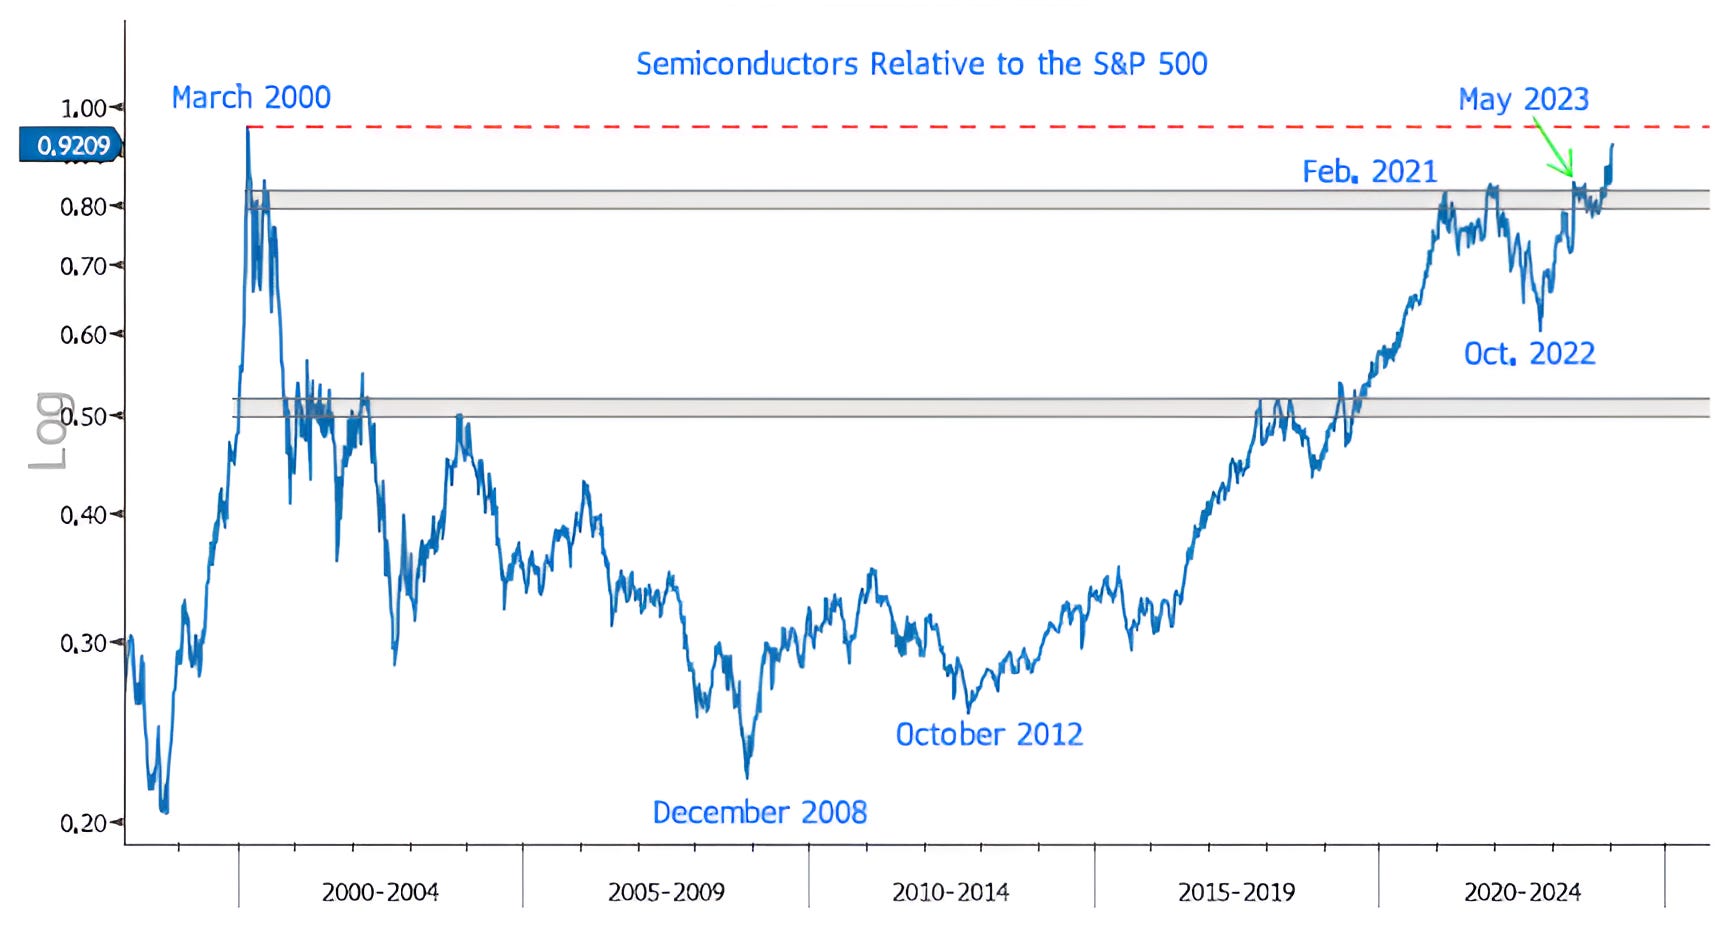
While it is easy to think that emergence of AI - with Nvidia’s earning’s release in May 2023 - was the beginning of the Semiconductor boom, the outperformance of Semiconductors relative to the S&P 500 began ten years ago.
Semiconductors are now nearing the same relative to the S&P 500 level as their peak in 2000 (red dashed line); however, the current ascent looks very different.
The outperformance of the Semiconductor industry that required 18 months from August 1998 to March 2000 has required over 15 years from December 2008 to today. This is despite better current fundamentals and industry dynamics.
Because Semiconductors and software have become so pervasive across industries, we wouldn’t be surprised to see this trend of Semiconductor outperformance continuing.
That said, outperformance will likely not occur in a straight line.
Source: Bloomberg. Through year-to-date 2024.
2. Employment through a Different Lens
Frequent readers know that I believe the risk of recession is being under-priced by the market (I showed this here).
The biggest recessionary signal is employment, however, employment is a lagging indicator which is consistently revised as I showed in Chart 2 here.
With that in mind, I noted with curiosity the chart below.
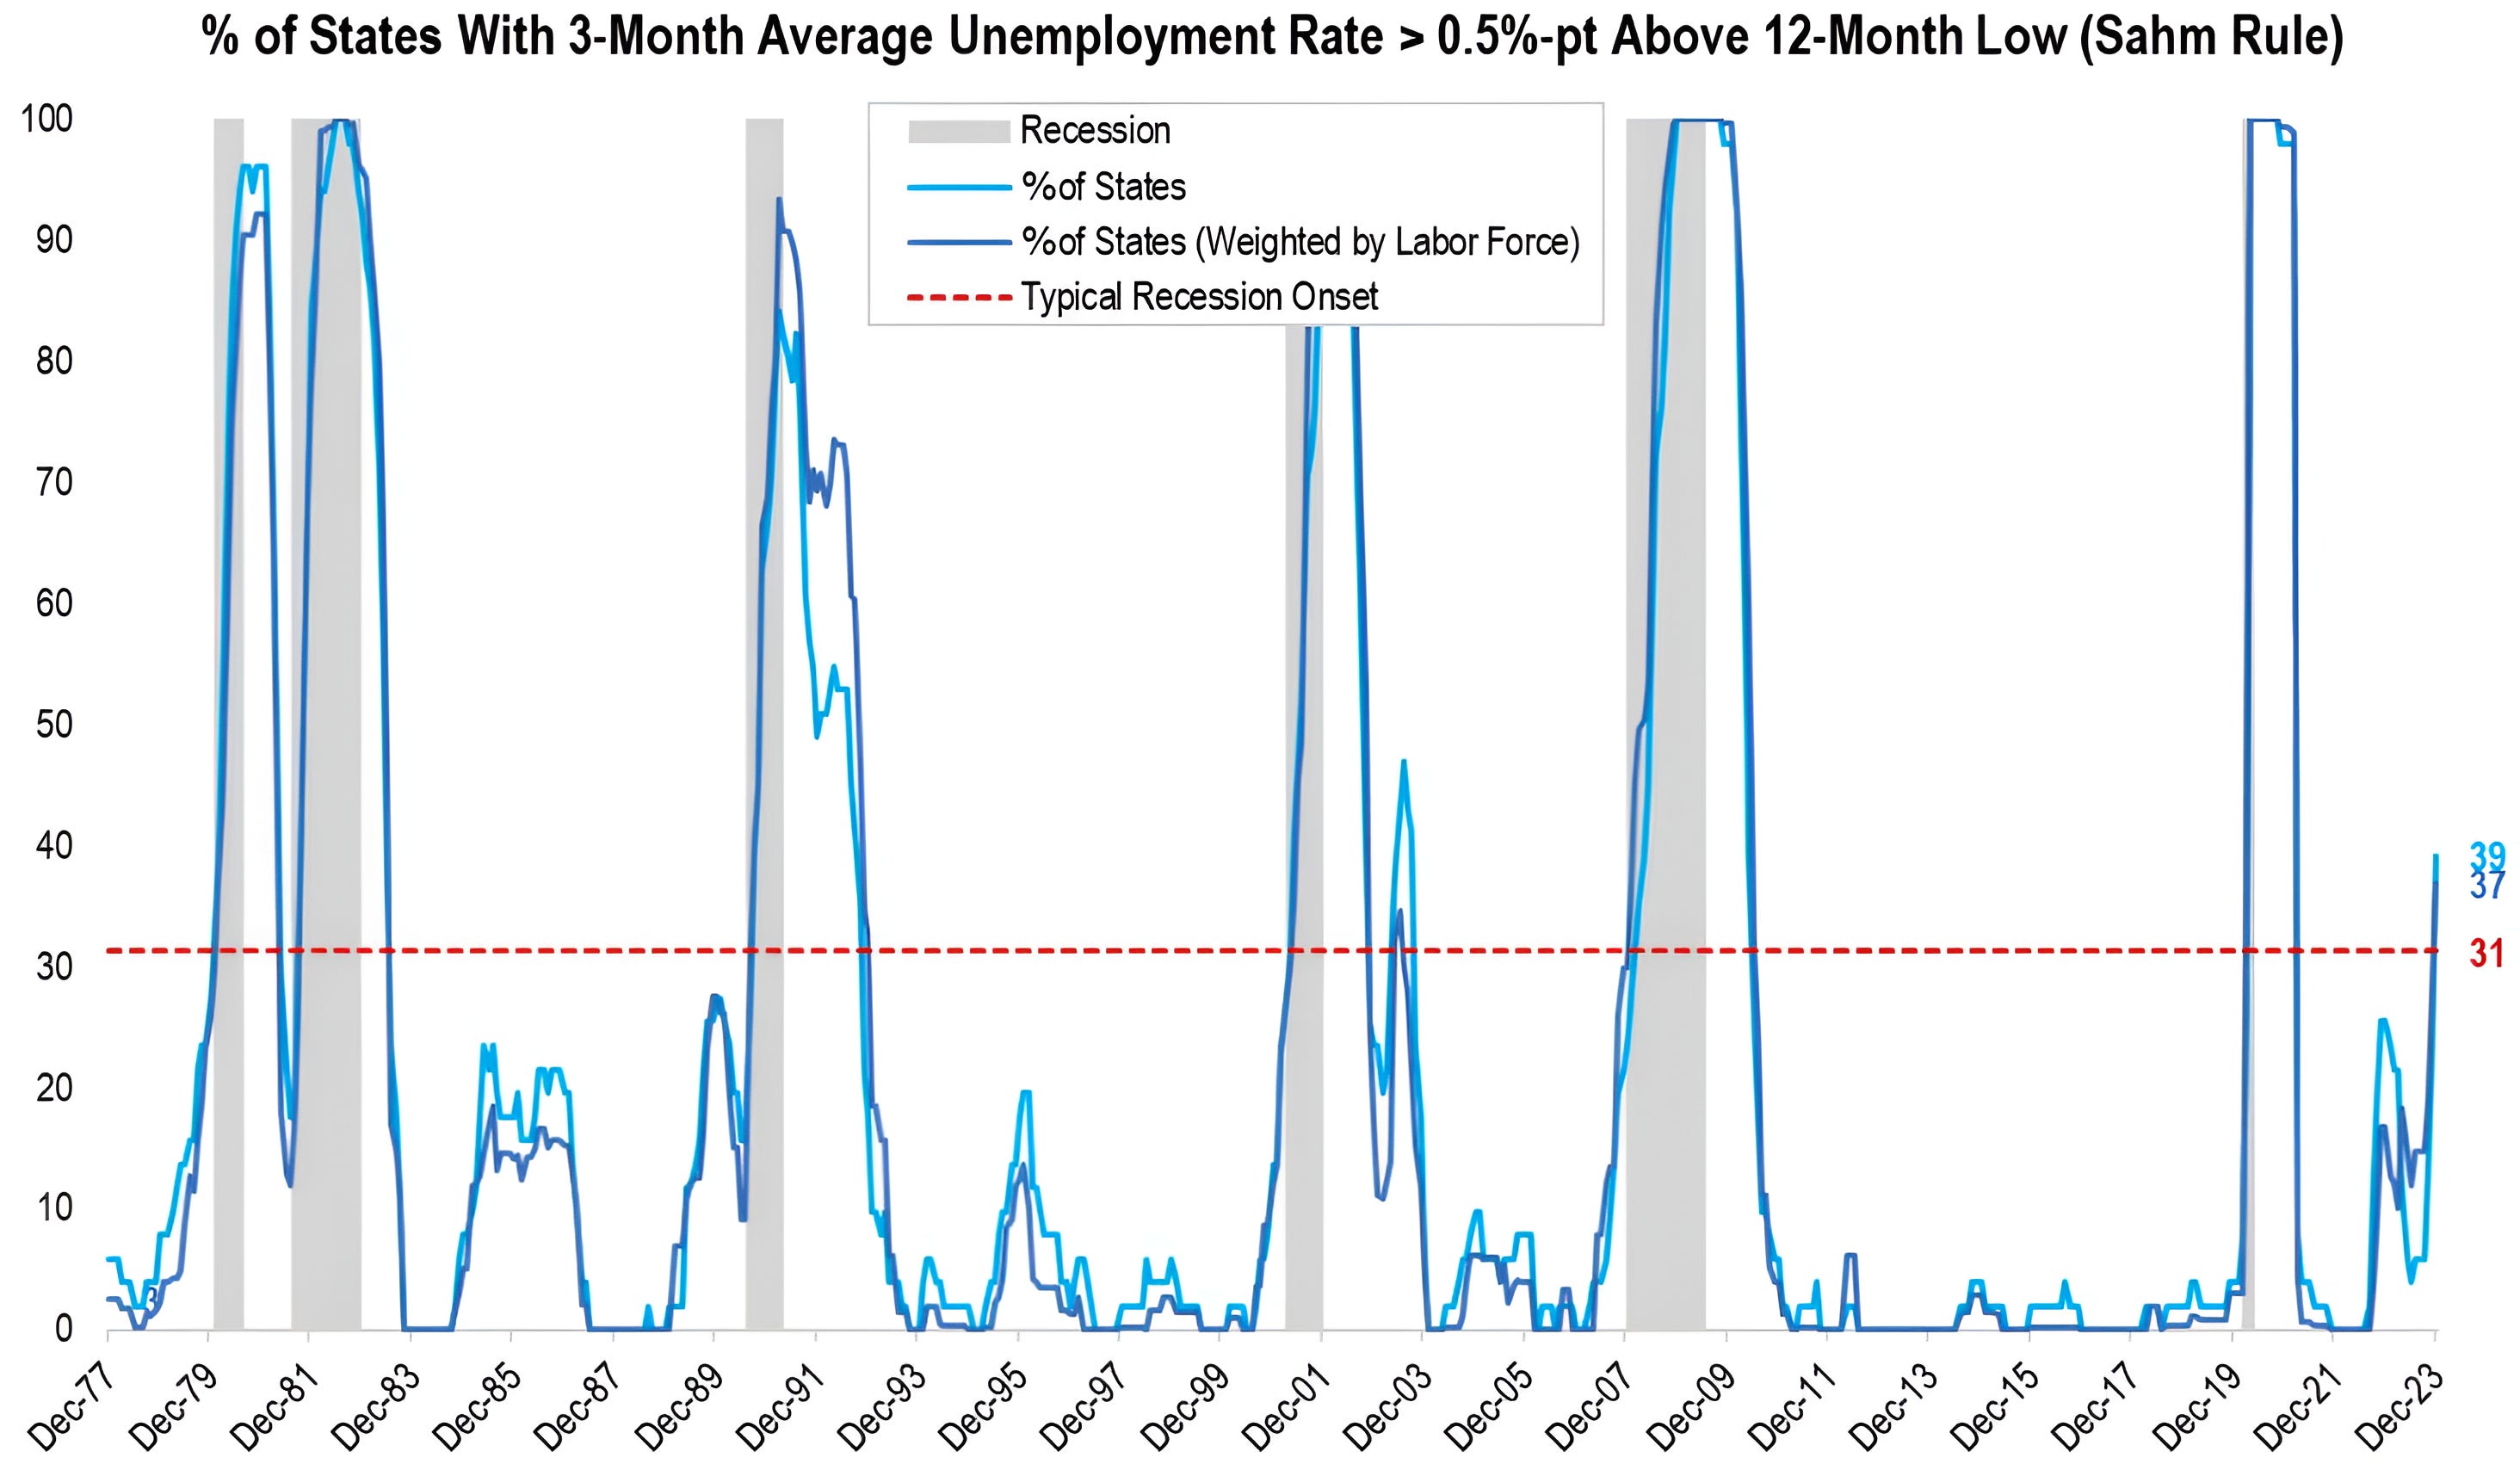
The Sahm rule is an indicator that is gaining attention with economists.
The rule states that when the 3-month moving average of the national unemployment rate rises by 0.50% points or more relative to its low during the previous year there is a recession.
The chart below - unlike the “traditional” national Sahm rule - shows the state by state Sahm rule and shows that when unemployment is rising in over 30% of states, historically, it has been indicative of a recession. (Past performance is not indicative of future results).
While I don’t love esoteric indicators and my former analyst who was a math major would complain about data-mining and retro-fitting, as the market makes new highs, I continue to be a proponent of risk management and believe recession risk should continue to be on our radar while not necessarily driving current investment decisions.
Source: Arch Capital Group. Through year-to-date 2024.
3. Keeping an Eye on Oil
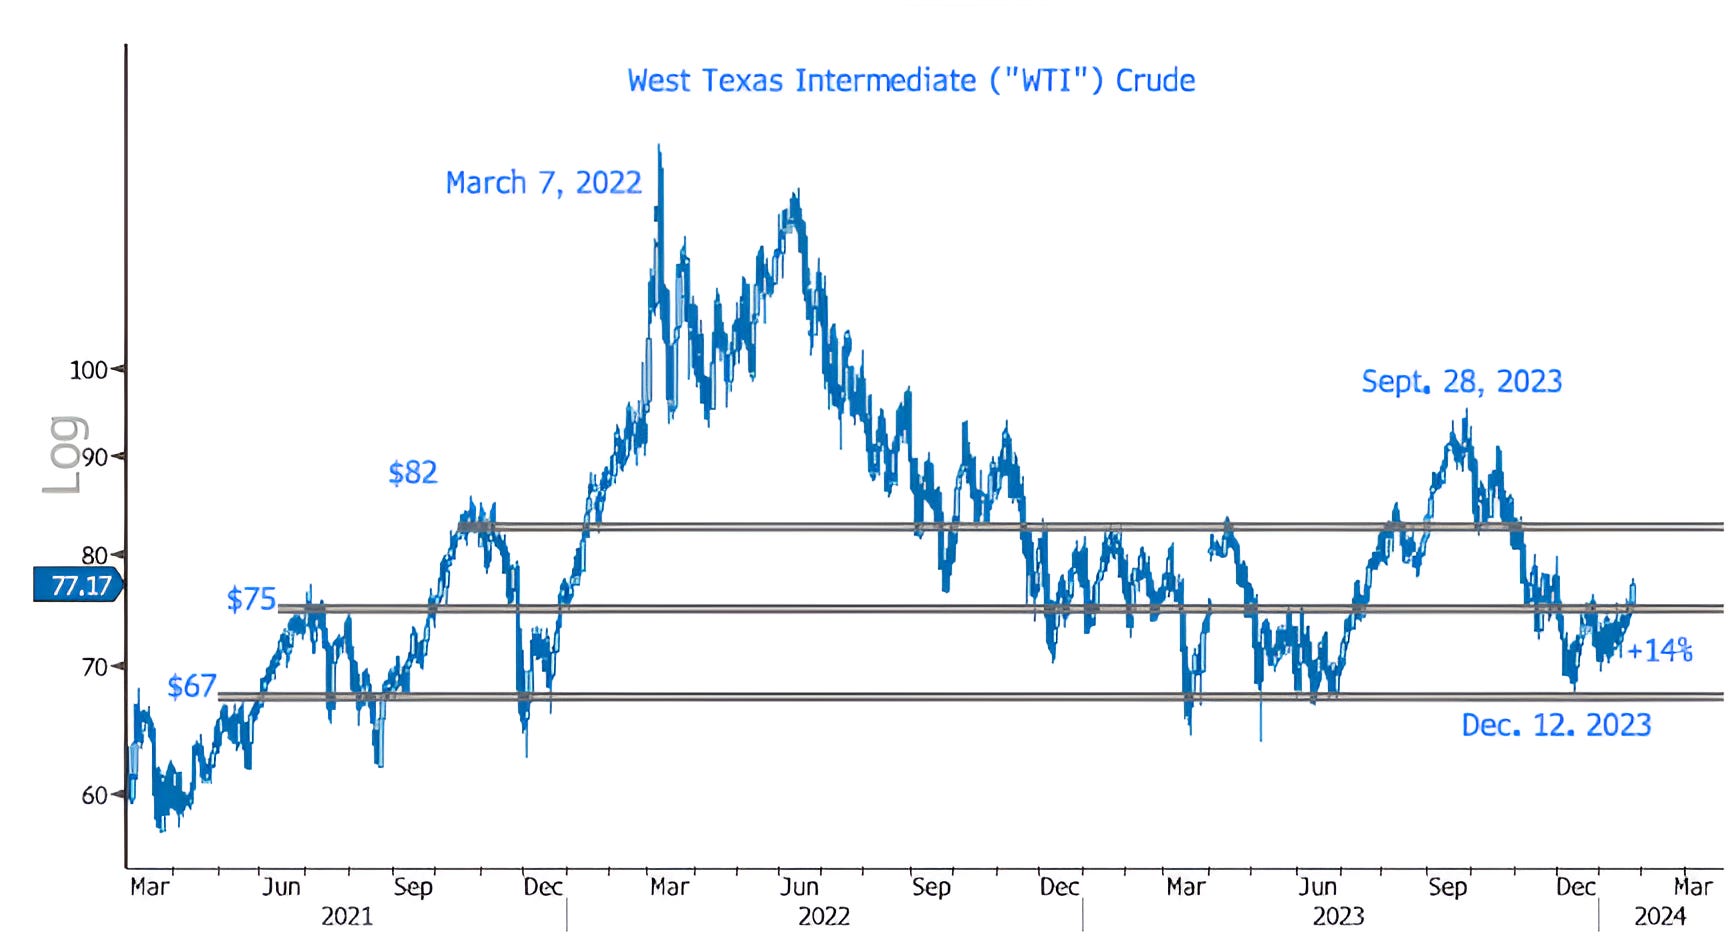
Very quietly, at least to me, over the past 6 weeks, Oil has moved higher by 14%.
Oil price transcends into every aspect of the economy:
Energy prices are a part of all manufacturing and distribution and can therefore impact margins;
Despite the fact the energy is removed from core measures of inflation, oil price and headline inflation often travel in tandem;
high oil prices often lead to higher gas prices and can result in a drop in consumer confidence, reduced discretionary spending and lower Presidential approval.
In other words, this is a price series that is worthy of attention.
Source: Bloomberg. Through year-to-date 2024.
4. The Biggest Issue that Few are Talking About
The Chart below is not the price of Nvidia shares or Bitcoin.
It is the annualized rate of US Interest Expense in billions of dollars.
While there are various possible outcomes from this condition, it is likely that the debt / interest expense will need to be addressed through one of three channels:
Increase taxes
Cut spending - the government budget / reduce expenses
Inflation - pay back debt with US dollars that are worth less
Given what we’ve recently seen from Washington, my current best guess as to which option the elected officials will choose is number 3: inflation.
At some point, it is likely that the bond market will pay attention to this issue and will require a high interest rate which will make the challenge even more difficult.
Furthermore, as we have seen, often higher interest rates are accompanied by lower equity valuation multiples.

5. More Detail on the US Election Year Equity Cycle
We wrote about the US Presidential Cycle and equities in chart 5 here, however, the chart below provides a longer sample size (97 years vs. 73 years) and shows monthly returns including the number of positive / negative months. (Past performance is not indicative of future results).
The most pertinent detail of the chart below may be that on average the month of February during election years has had negative equity market returns. (Past performance is not indicative of future results).
The biggest directional difference between the chart below and the one that we showed previously is that on the Chart below there is a drawdown in May that is not prevalent on the prior chart.
While these seasonal charts can provide an somewhat accurate road map for market direction through the year - it is important to note, magnitude varies (as can be seen).
We also want to pay specific attention when the path deviates from typical (when the market doesn’t do what it’s “supposed” to do, we want to pay attention).
