


To Recession or Not to Recession, that is the Question?
Last year, at this time, many were calling for a recession within the year. The current consensus view is for a soft landing with no recession in sight. It may not be quite that simple.
Just to be clear, we are not calling for a recession.
However, there continue to be a number of signs that one is possible and, as equity investors, we want to be aware and vigilant.
As always, we watch a number of real world, survey and market-based signals to confirm any assertion.
When consensus becomes complacent and overly confident in a certain scenario (in the current environment - soft landing / no recession), it often catches our attention, and, at the very least, is worthy of investigation.
While this piece focuses solely on current indicators that are consistent with recessions, there are number of economic indicators that continue to reflect economic strength.
1. For Equity Investors, a Recession is One of the Most Significant Considerations
There is math on both sides of the argument.
An investor that misses the 3 best days in equities dramatically underperforms the investor that remains invested.
The expression “Time in the market is more important than timing the market” comes to mind.
On the other hand, an investor that loses 50% must gain 100% to be even. Definitely a tough task.
Risk management and mitigating (notice I didn’t say avoiding) drawdowns is key.
Before we articulate our approach and how we square that circle, we wanted to look at recessions.
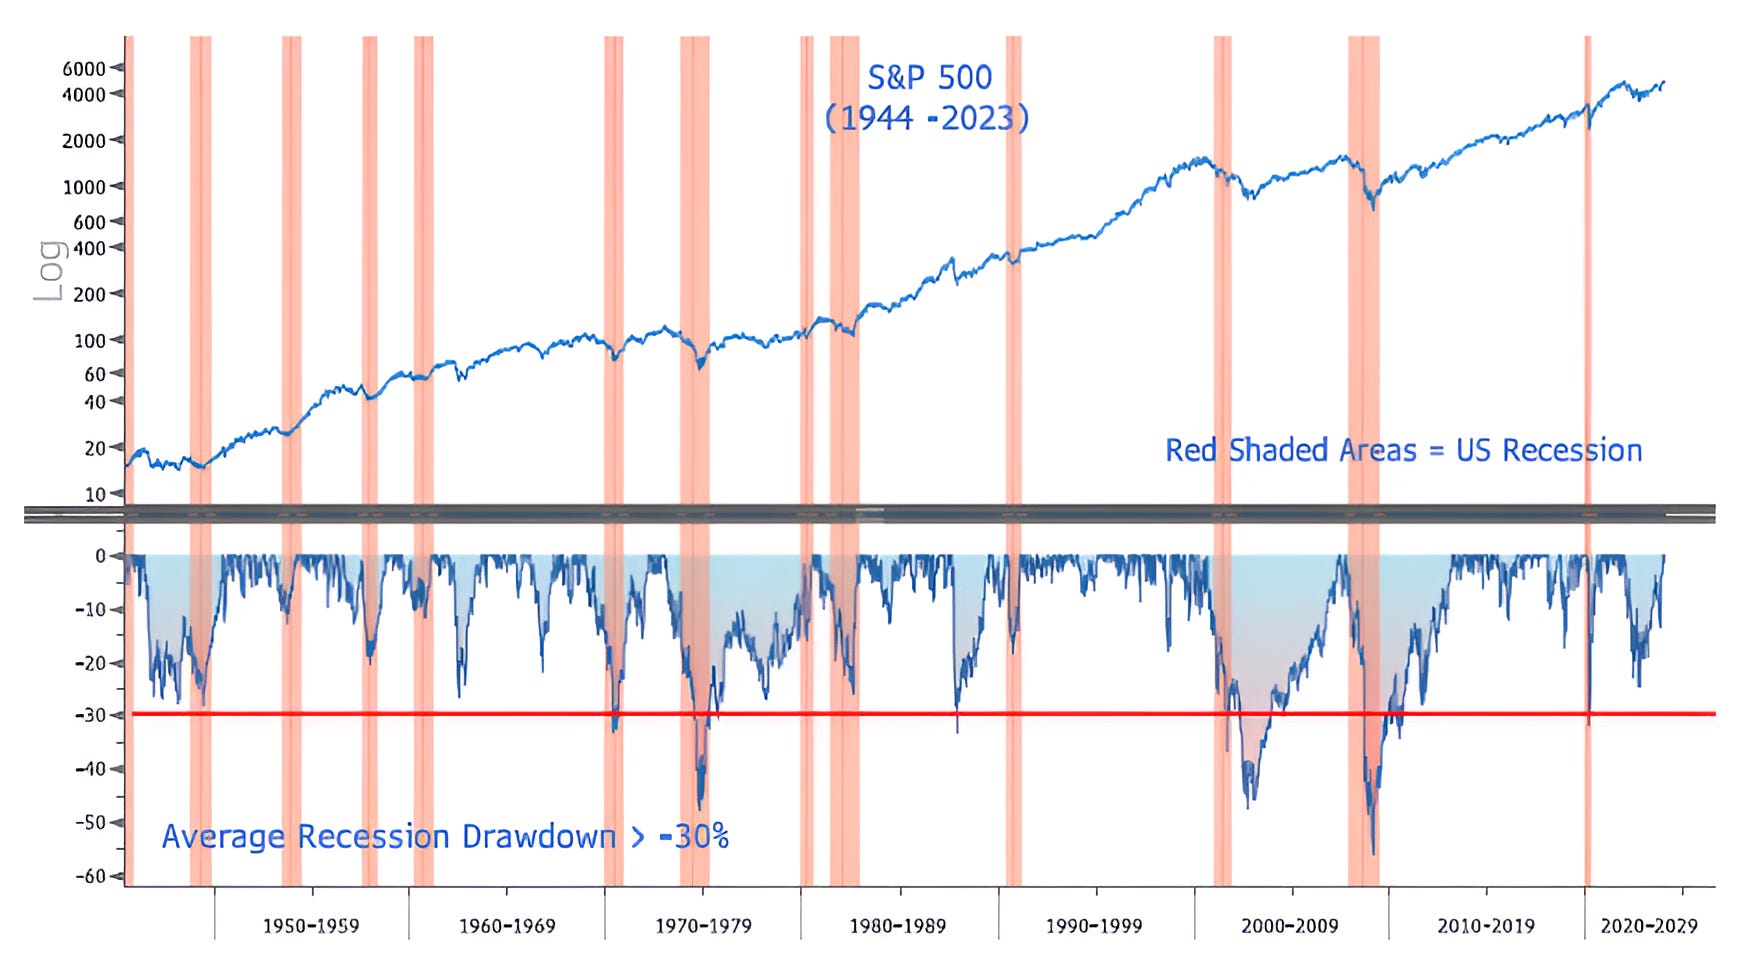
The average US recession has been consistent with 30%+ drops in the S&P 500 (see the chart below) and requires a return of ~50% to get back to even. (Past performance is not indicative of future results)
As a result, we see recessions as one of the more critical calls for equity investors.
That said, while we want to be vigilant, more money has likely been lost predicting recessions than in the recessions themselves.
While we are concerned that many have become too confident in the soft-landing / no-recession view, we are not forecasting a near-term recession, but want to look at some indicators and remain vigilant.
It’s important to remember that by the time a recession is officially announced by the National Bureau of Economic Research (NBER), it’s often well past the start and equities have already begun to incorporate the macro environment into price.
In general, we mitigate the recession / draw-down risk through a three tiered approach:
Sector selection: there are defensive sectors that often outperform during recessions / slowdowns (ie Consumer Staples as we’ve highlighted in chart 5 here and in Chart 3 here). (Outperformance of defensive sectors is also often a recession signal).
There are also what we consider to be “epicenters” of recessions that need to be avoided such at tech stocks in the dot-com crash and financials in 2008 / 2009. Often, investors can pivot away from those to other areas.
Puts and put spreads: There are option strategies that investors can use to off-set some of the drawdown. Options are sometimes difficult to manage in terms of timing, structure and profit taking. However, in general, we think of this like insurance and, if implemented correctly, can be profitable.
Cash: Sometimes we want to have above typical levels of cash in our account. Not only does this mitigate the loss, but provides dry powder to allocate to positions after a sell-off.
All of that said, we see volatility as the cost of an equity portfolio. Managing it, rather than trying to avoid it, seems to be the best approach.
Source: Bloomberg. Through year-to-date 2024.
2. Some Recessionary Signs (Part 1): Real GDI
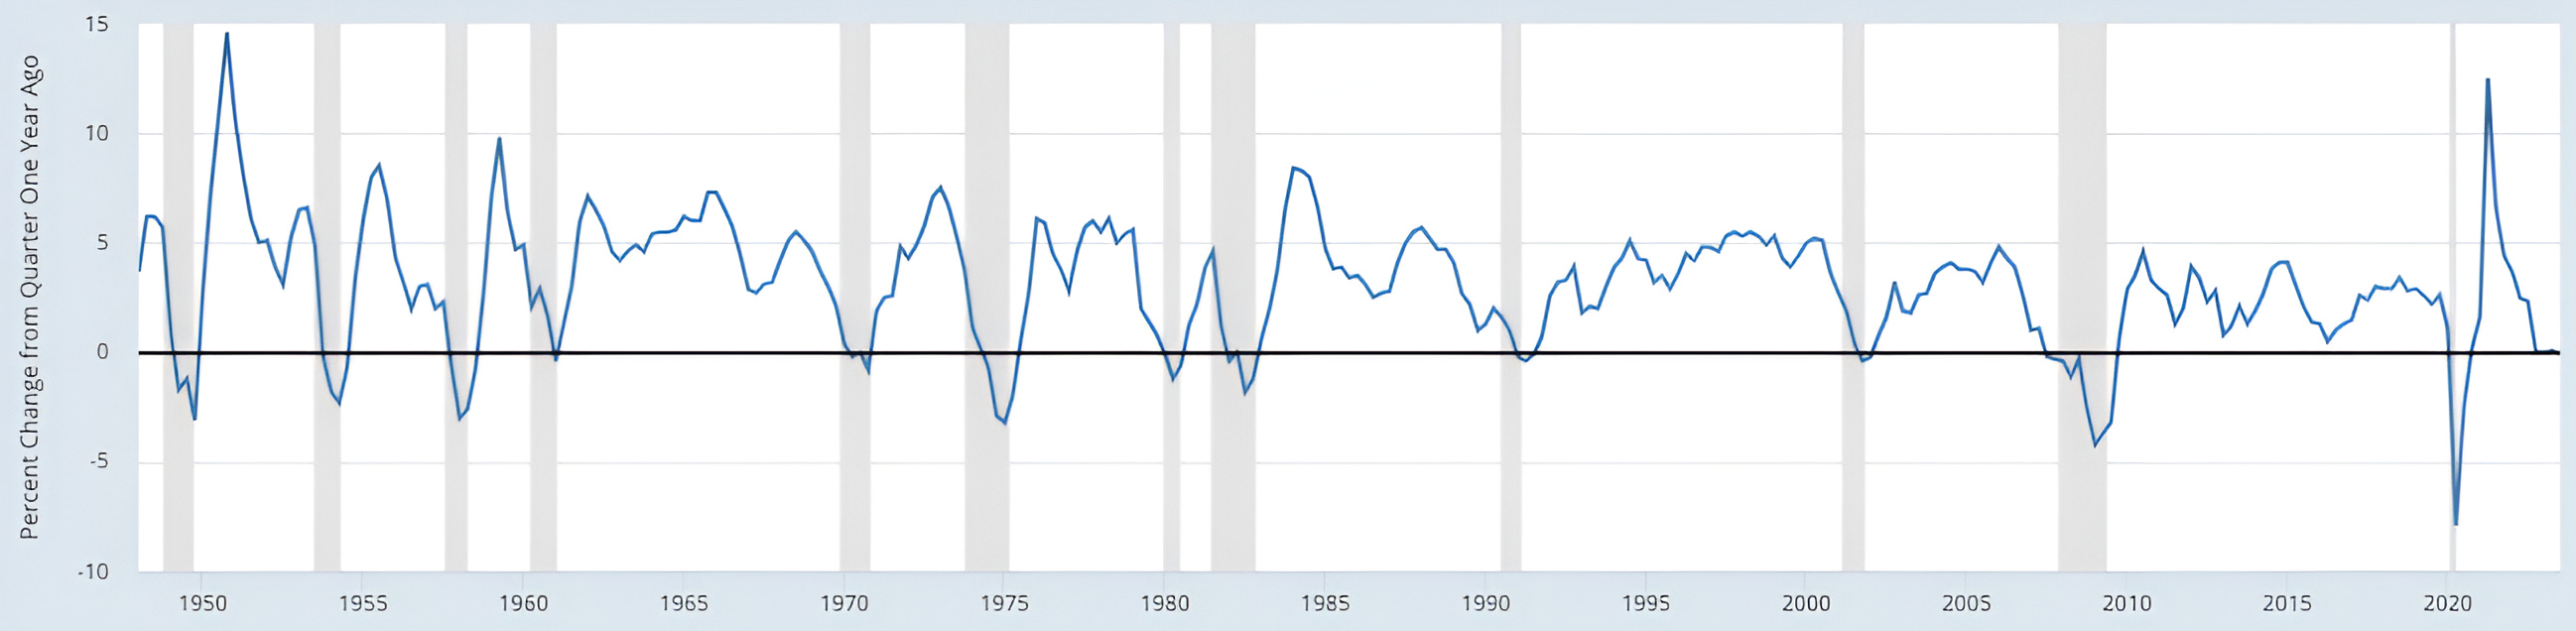
The chart below shows the year over year change in Real Gross Domestic Income (GDI) with US recessions shaded in grey.
You may need to squint, but Real GDI came in at -0.1% year over year in Q3.
Since 1948, there has not been a contraction in Real GDI without an accompanying recession. (Past performance is not indicative of future results).
It should be mentioned that Q3 Real GDP was 3.0% year-over-year.
While Real GDI and Real GDP typically travel in tandem (chart available upon request), there was a similar divergence in 2007. (Past performance is not indicative of future results).
Unlike many recession indicators (including those that we show below), Real GDI is not market or survey based.
Source: St. Louis Fed “FRED.” Through Q3 2023.
3. Some Recessionary Signs (Part 2): Regional Surveys
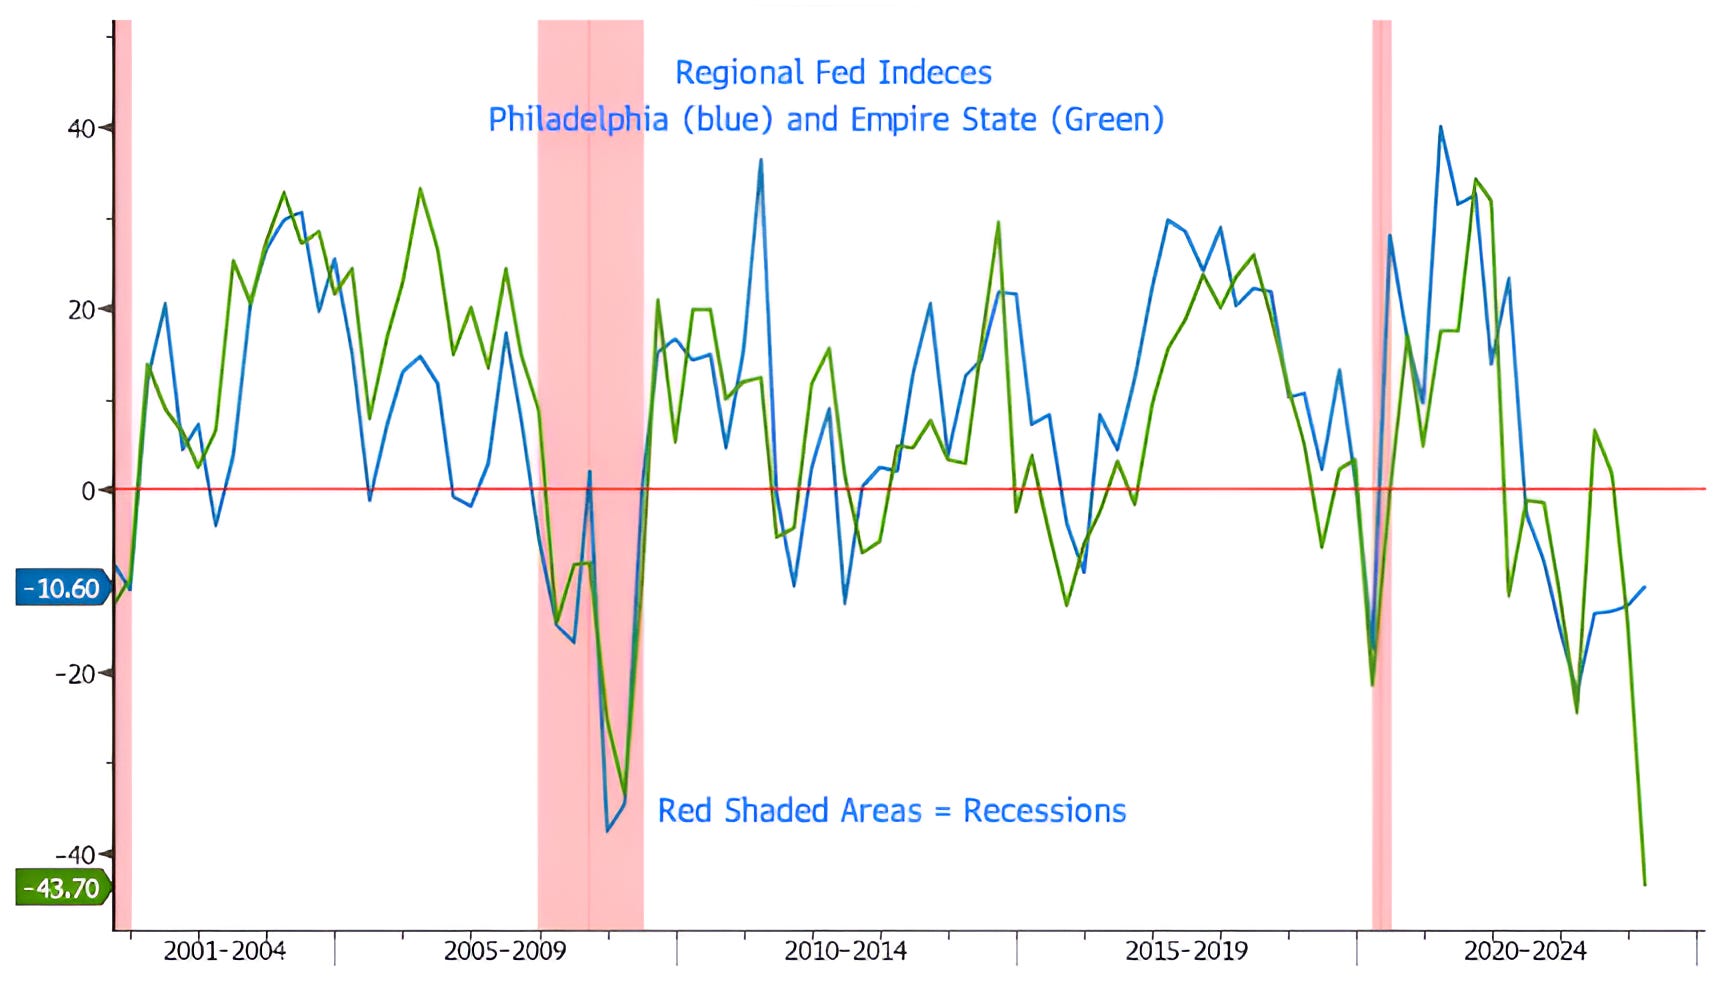
Below is a chart of the most recent Philadelphia Fed Business Outlook Survey (blue line) and the Empire State (New York) Manufacturing Survey (Green line).
While the Philadelphia Survey has recovered from its March 2023 low, it is notable that the recent trough was the lowest level achieved since 1968 in a non-recession period.
In addition, as can be seen, the Empire State Manufacturing Survey has never been lower than this month’s reading.
Historically, the Philadelphia Survey and the Empire State have traveled in tandem. (Past performance is not indicative of future results).
We will see if the historical relationship between the two series re-establishes itself next month, and, if so, in which direction.
While we recognize the limitations of survey data, the dramatic drop in the Empire State caught our attention.
Additional regional surveys will come out over the next two weeks and we will watch to see if they more closely reflect the recovery in the Philadelphia Survey or the dramatic deterioration of the Empire State Survey.
Source: Fidelity, Bloomberg, Haver Analytics, FactSet. Through year-to-date 2024.
4. Some Recessionary Signs (Part 3): Bank Lending
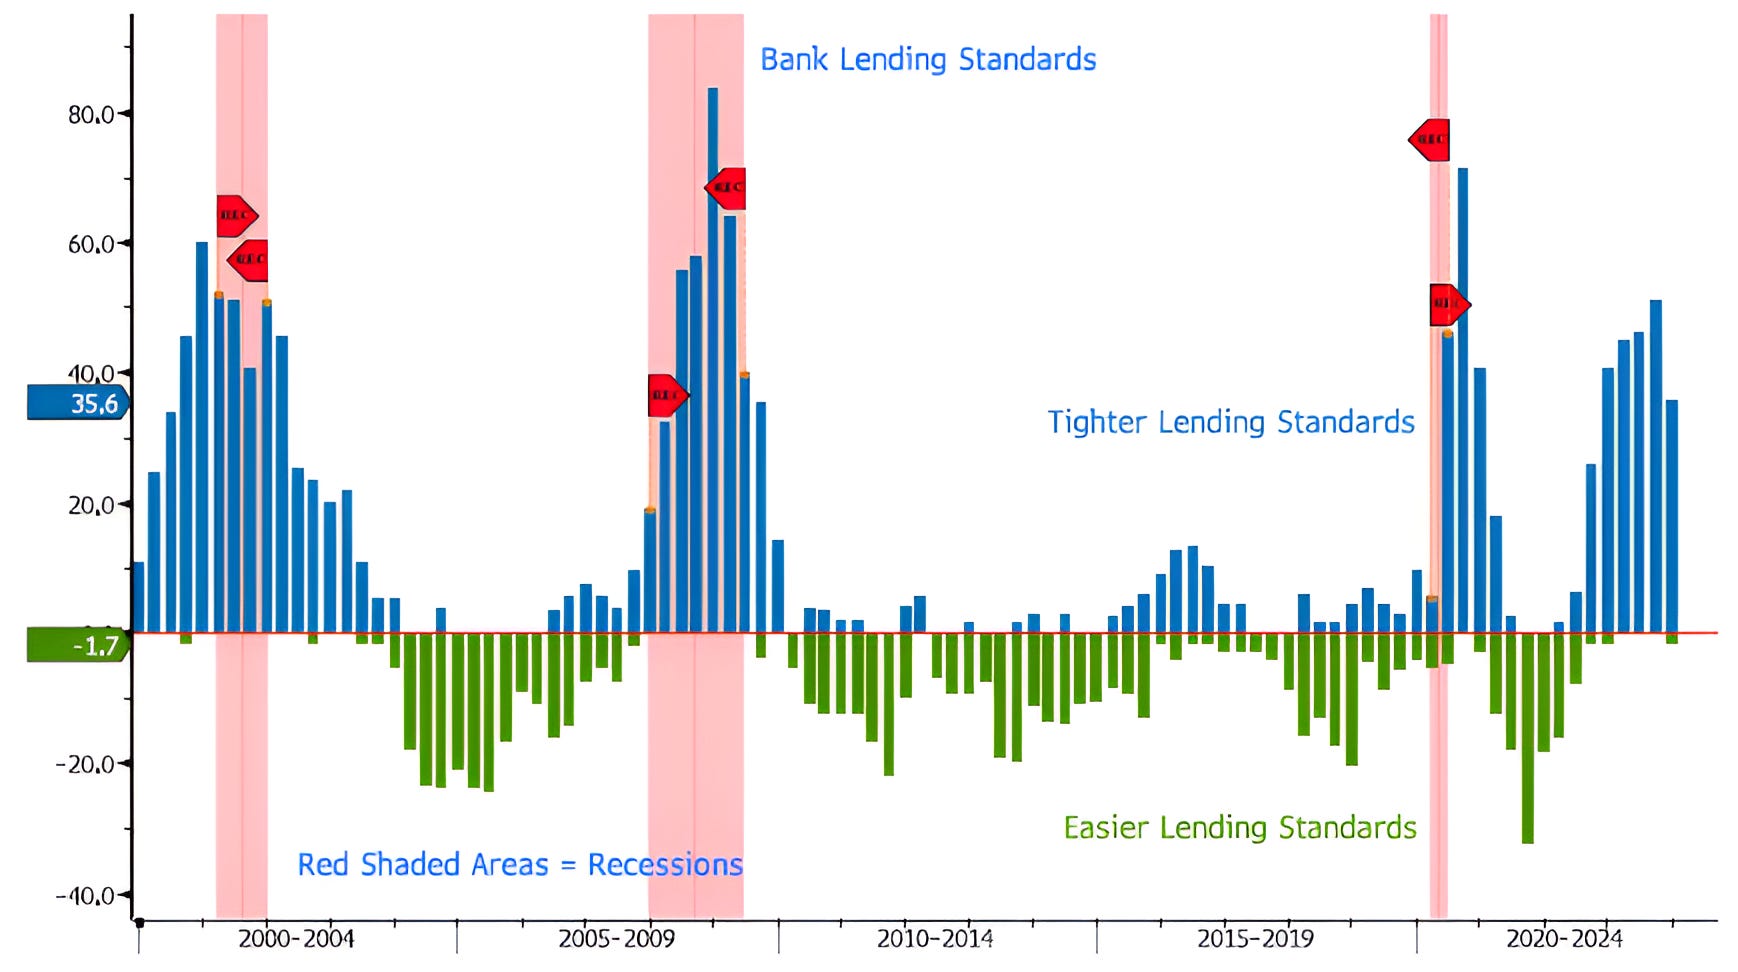
Bank lending standards have been tightening for the past 18 months.
Over the past 25 years, persistent tight lending standards have been consistent with US recessions. (Past performance is not indicative of future results).
We would note that in the current environment, it is possible that all of the private credit funds that have been launched may have replaced some bank lending. However, we might question the quality of the underwriting in those funds and whether or not the reward is compensating for risk.
Source: Bloomberg. Through year-to-date 2024.
5. Some Recessionary Signs (Part 4): Trucking Employment
Employment, in general, is generally the best indicator of a recession.
While Jobless Claims, Continuing Claims and Unemployment continue to reflect economic strength, we would note that these are lagging indicators.
Jobless Claims hit a cycle low in April 2000, after the March peak in the S&P 500 and trended around its pre-recession average through October when equities began to move down significantly.
Similarly, during the Financial Crisis, jobless claims remained steady for most of 2007 before trending higher in 2008.
In both periods, the deterioration in Truck / Transportation Employment provided and early warning. (Past performance is not indicative of future results).
The only time over the past 35 years that Truck / Transportation Employment dropped as much as now without an accompanying recession was in 2016 during the Chinese Yuan devaluation period.
As a reminder, there was a 15% S&P 500 drawdown in 2015 / 2016.
