


Indecision In the Time of Earnings and the Fed
With earnings season beginning to accelerate, a sloppy start to the year, global-macro issues (when are there not) and a Fed meeting with cuts priced in, equities are indecisive.
1. The Nasdaq 100, Watching for Resolution
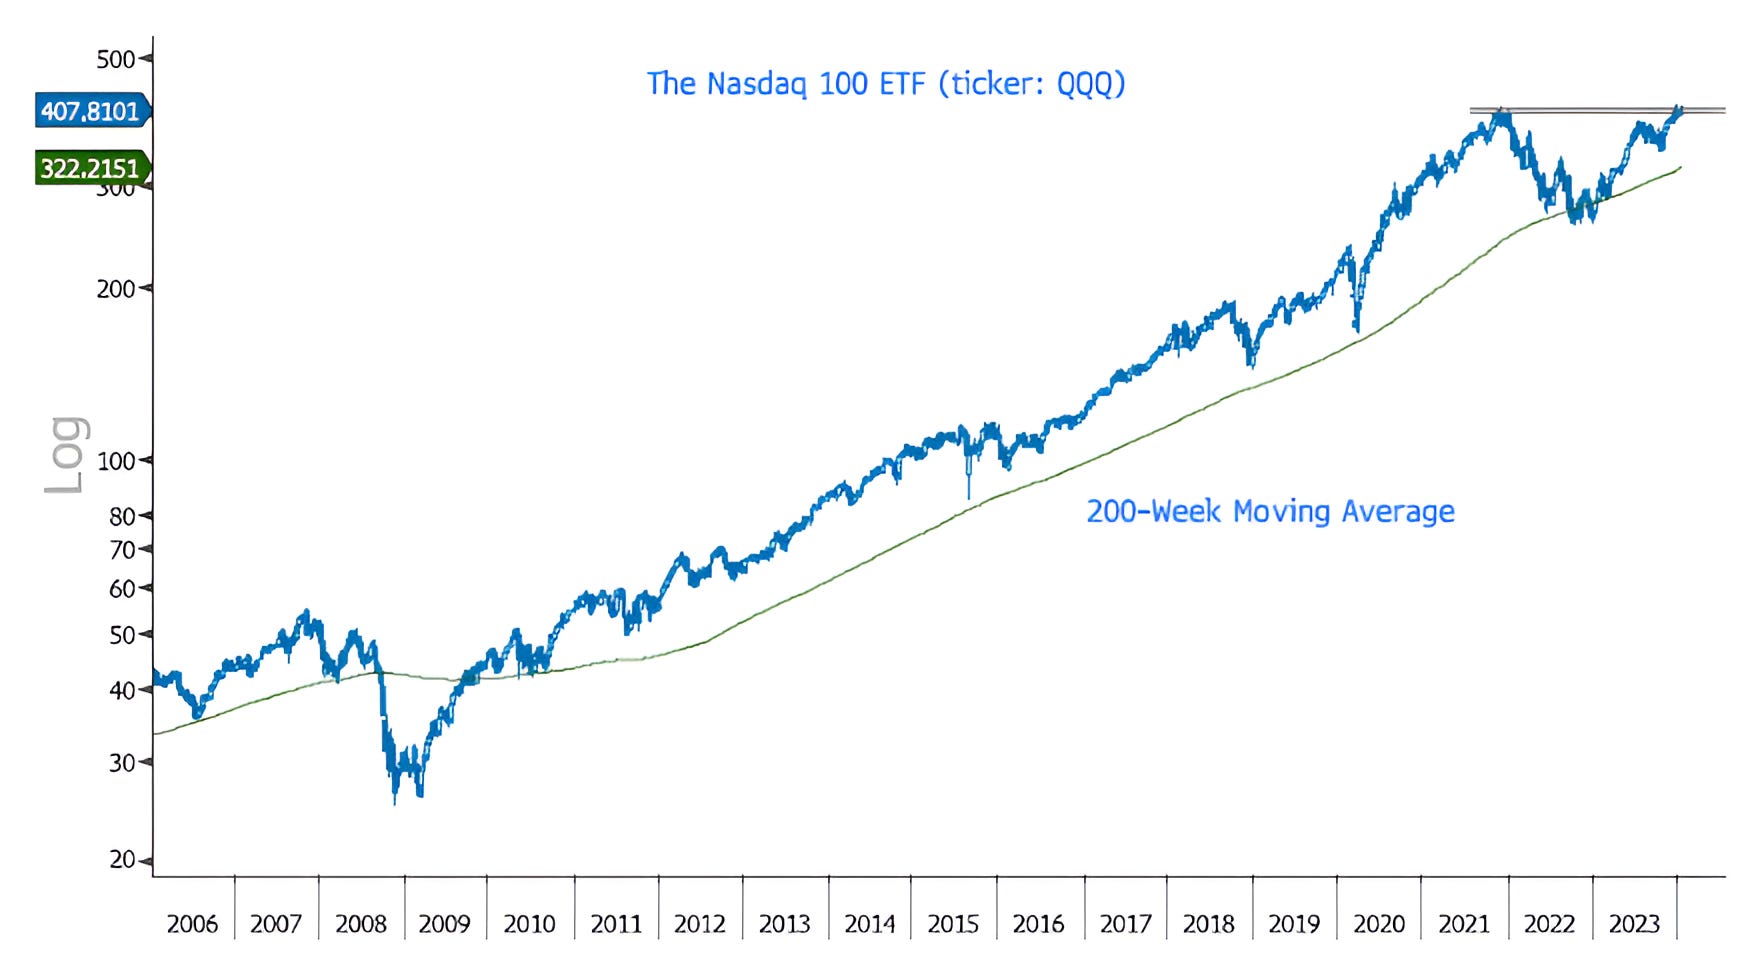
Unlike the S&P 100, which we showed last week in Chart 1 here, the Nasdaq 100 has not made a meaningful new high.
Rather, it is continuing to battle with its November 2021 congestion area.
As a reminder, the Nasdaq 100 peaked when the Fed began considering moving forward its monetary tightening cycle.
Although monetary easing (the reverse of what occurred near the 2021 peak) has not begun in a formal way, in our view, stealth stimulus in 2023 from both the Fed, which expanded its balance during the regional banking crisis, and the Treasury, which drained its General Account during the debt ceiling negotiation and more recently has added liquidity through the use of reverse repos (as we described in Chart 3 here ) helped drive the market recovery.
With Fed rate cuts priced in at every meeting over the next year (chart 5 here), stealth easing in the rearview, and a soft landing (no recession) having become the consensus economist view (source: Bloomberg), our antennae our raised as a positive scenario seems incorporated in the price and the scope for a positive surprise seems limited.
As a result, we prefer to see confirmation of new highs before considering meaningful further near-term equity upside.
Source: Bloomberg. Through year-to-date 2024.
2. Watch What We Do, Not What We Say
As I learned it, when Insiders buy, it is more of a signal than when they sell.
Why?
People sell for a variety of reasons: liquidity, taxes, estate planning, diversification, etc.
They buy for only one reason - they’re bullish on the prospects of their stock.
That said, the recent Insider Selling - like any extreme move - has caught my attention.
The last time - based on what I’ve been able to find - that the Insider Transaction Ratio was near current levels was in April 2021. While a 4% correction followed, in general, the elevated Insider Sales were not indicative of a significant sell-off.
It is more likely that by April 2021, after the considerable recovery in equities (similar to today), insiders were happy to have the opportunity to sell / diversify at attractive levels.
Again, our antennae our up, but we don’t want to be overly cautious here.

Source: Thomson Reuters and Barrons. Through year-to-date 2024.
3. A Relationship We’re Watching Closely
Frequent readers know that we always look for market-based indicators that we believe can provide insight into the health and / or direction of the market.
Last week we looked at two market-based indicators that have provided market signals in the past:
The Russell 2000 Small Caps (Chart 5 here) suggested caution (a yellow flag) while
Consumer Discretionary relative to Consumer Staples looked healthy (Chart 5 here).
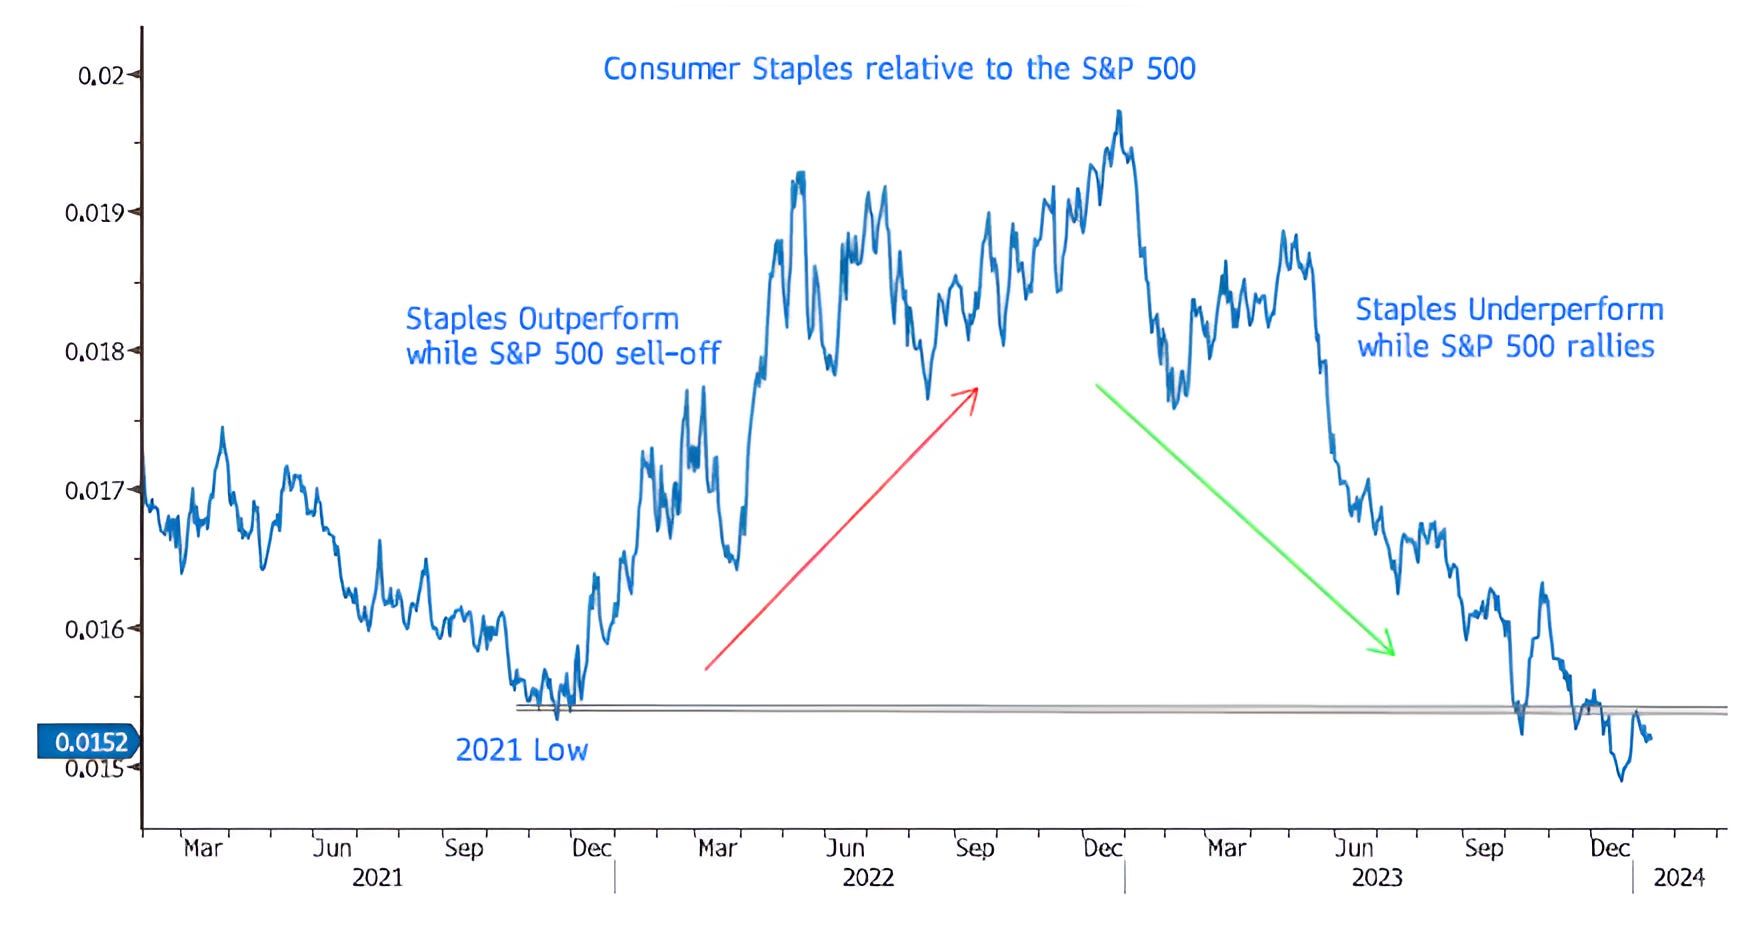
Today, we’re looking at the Consumer Staples sector relative to the S&P 500.
Consumer Staples are considered a defensive corner of the market that portfolio managers gravitate to when they see a slowdown coming or have other concerns.
We can see on the chart that Consumer Staples outperformed the S&P 500 during the 2022 sell-off and underperformed during the 2023 rally / recovery.
We are currently watching the relationship as it battles the 2021 low.
If Consumer Staples recapture the north side of the 2021 low relative to the S&P 500, we would consider that worthy of attention and another yellow flag in our work.
Although, the chart is still below the line of concern, it’s on our radar.
Source: Bloomberg. Through year-to-date 2024.
4. Watching the Dollar
The US dollar has typically had an inverse relationship with US equities (we see this across currencies and local equity markets).
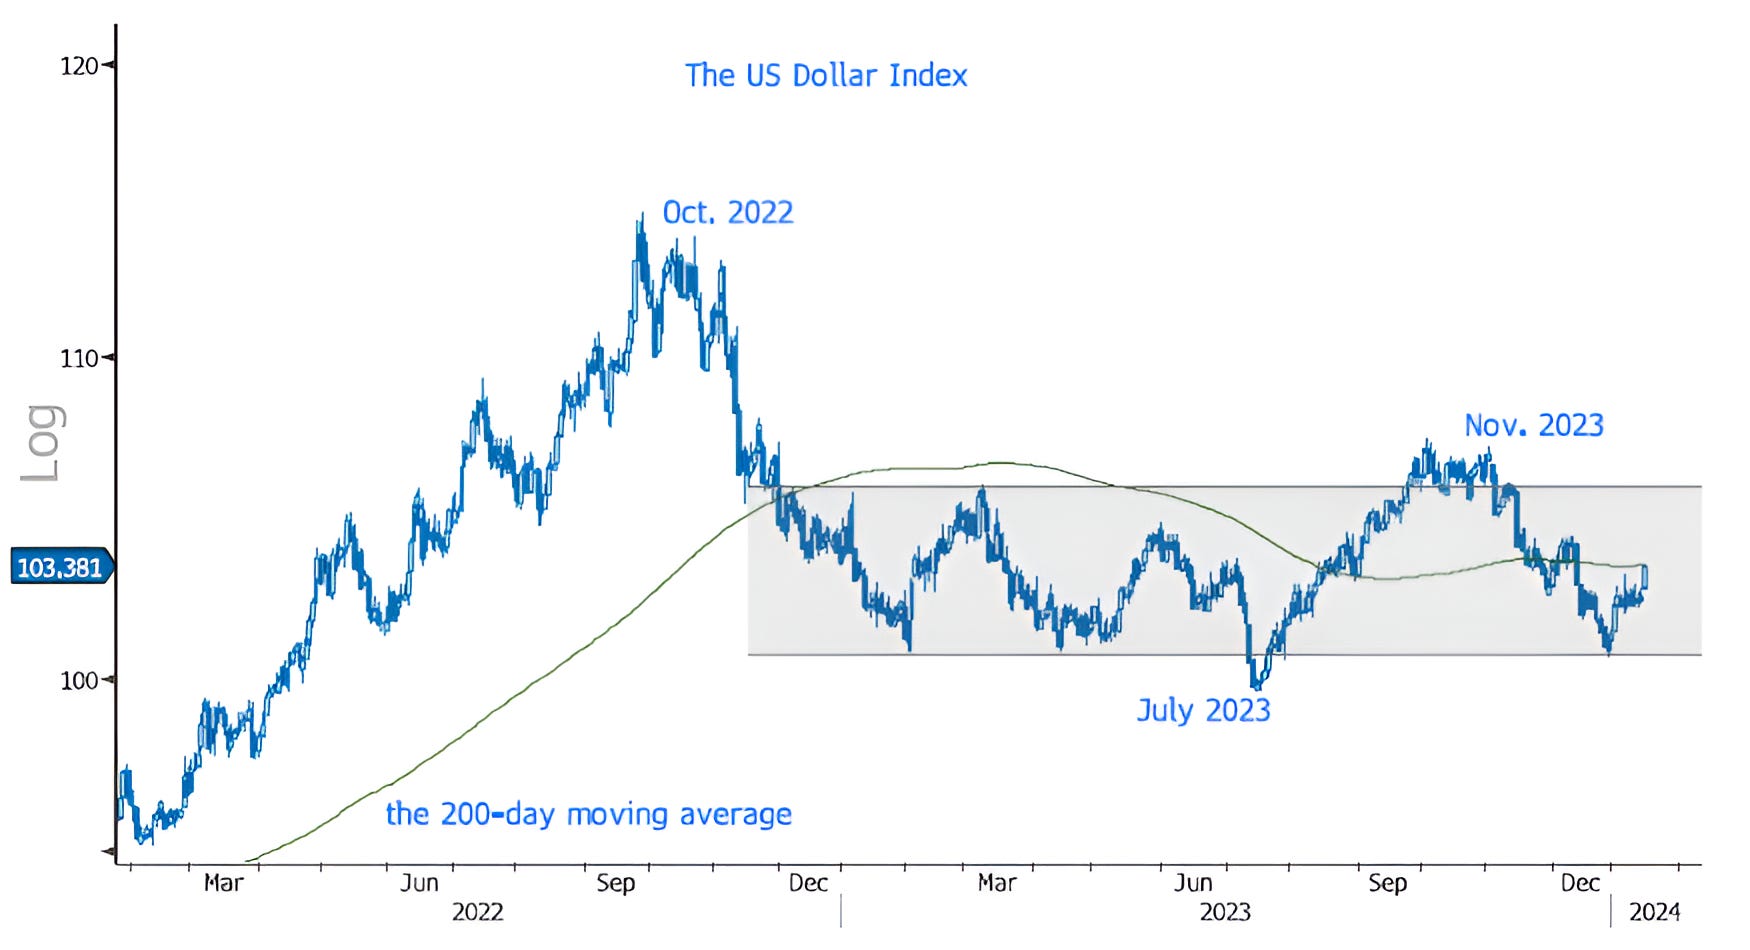
As the dollar weakens, as it did from October 2022 to July 2023 and again from November, US equities often rally.
When the dollar strengthens as it did through most of 2022 and from July 2023 through November, US equity performance is inconsistent at best.
Since December 2022, the Dollar has been in a broad / sideways trading range (grey shaded area) and has been playing both sides of its 200-day moving average (curved green line).
The Dollar last hit the bottom of its trading range on December 28th and has been strengthening since (concurrent with inconsistent equity markets).
Today, the Dollar appreciated nearly 1% as Fed member Waller gave some comments that the markets received as hawkish (counter to the easing that we showed was priced in on Chart 5 here).
If the Dollar were to move sustainably back above its 200-day moving average, this might once again begin to provide a headwind to US equities.
Source: Bloomberg. Through year-to-date 2024.
5. Is it Time to Look Outside of the US for Equity Exposure?
The chart below shows the S&P 500 relative to the MSCI All Country World ex-US.
US equities have been outperforming global equities for the last 14 years.
In our view, US equity outperformance - which has essentially occurred since the Financial Crisis - has been partially the result of aggressively-easy US monetary (zero percent interest rates “ZIRP” and quantitative easing “QE” in all of its forms).
Looking closely at the right side of the chart, it is easy to see that in 2022 when the Fed initiated its tightening cycle, US equity outperformance went from the top of the range to the bottom of the range (grey shaded area).
While we were watching for the relationship to break the lower barrier, in our view, the reason that it didn’t was the “stealth liquidity” that the Fed and Treasury provided in 2023.
To put the chart in perspective, it is not necessarily that non-US equity markets are doing poorly or that they are going down.
From the October 2009 low in the relationship, the MSCI All Country World ex US is up 101%. That said, the S&P 500 is up 484% over the same period.
While we like the diversification benefits of non-US equities and, from time to time, there are individual markets that are interesting, we continue to favor US equities.
If the relationship between the S&P 500 and the MSCI All Country World ex-US falls below the range, we are likely to re-assess our view.
