


What a Long Strange Trip It's Been
After 2-years that included a 25% drop, the emergence of the Magnificent 7, a regional banking crisis and an AI boom, the S&P 500 has hit new highs. How far can it go and how long can it last?
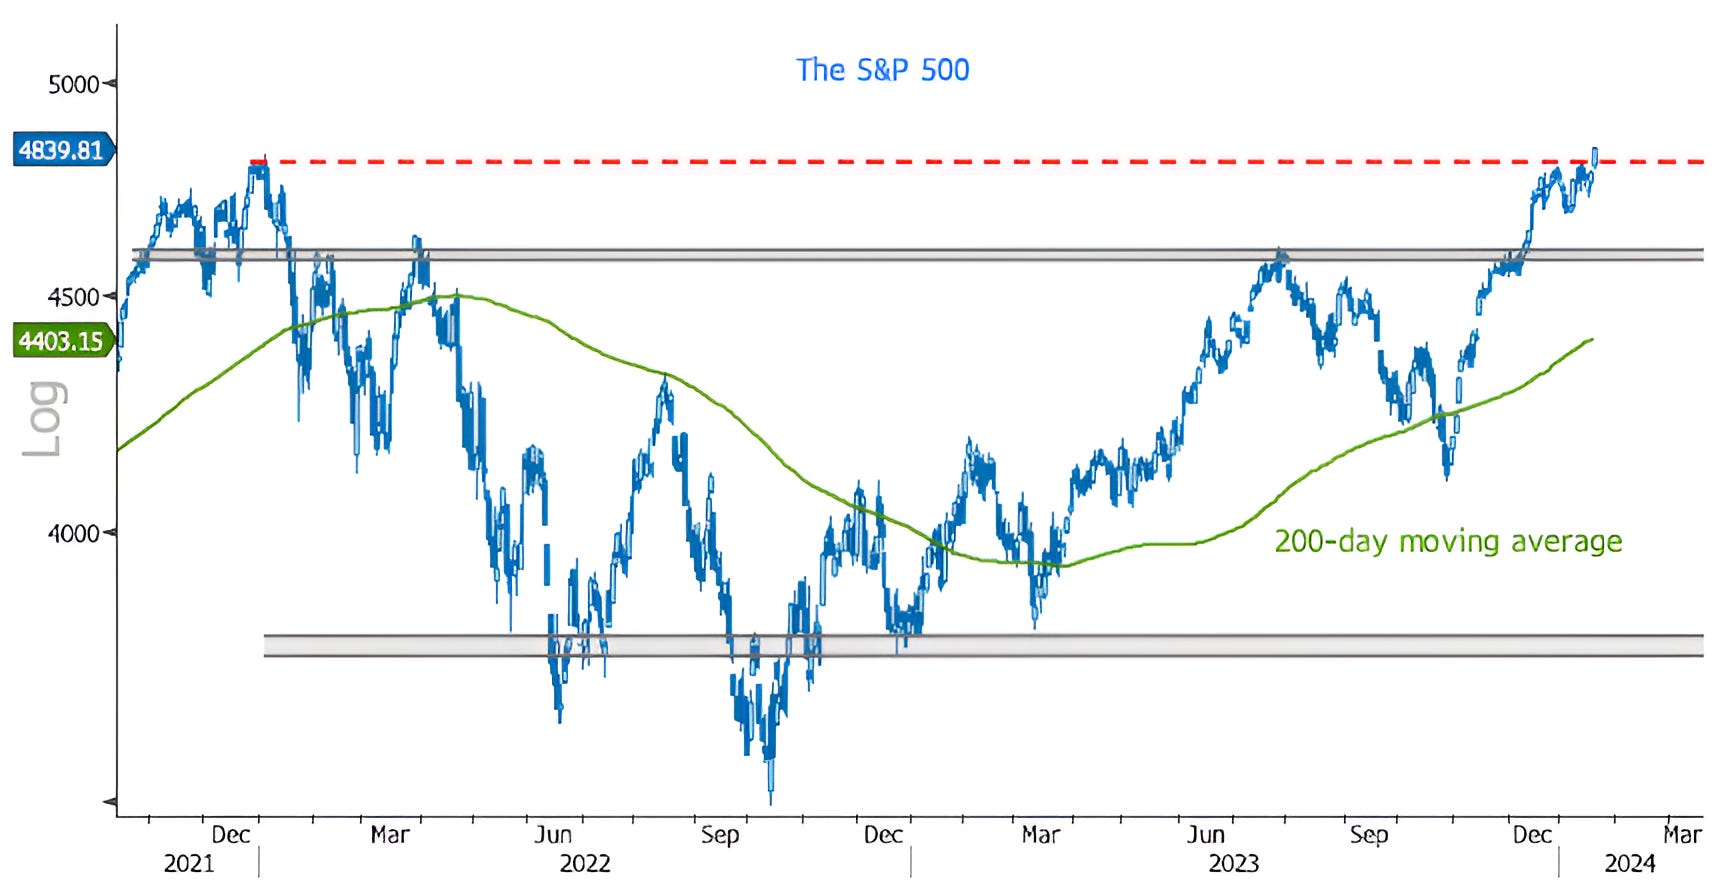
1. S&P 500 - A New High After 2+ Years
When we look back at 2023, there were five main elements that we believe supported the market rally.
Stealth liquidity - we’ve written about this multiple times (most explicitly here). Our view is that during 2023, through the use of its “General Account” and the handling of Reverse Repos, the Treasury was able to more than off-set the tightening policies of the Fed.
The Magnificent 7 - while the S&P 500 was up 24% during 2023, the Magnificent 7 (Apple, Microsoft, Alphabet, Amazon, Nvidia, Tesla and Meta / Facebook) was up 107%. This means that a disproportionate percent (70%+) of the S&P 500’s total 2023 return was attributable to 7 of the indexes 500 shares.
Sentiment - many investors entered the year with a negative / cautious view. As a result, they were not necessarily positioned for a equity rally and likely helped accelerate the upside as worst case scenarios failed to materialize.
Strong Employment - I considered calling this economic resilience and given that many expected a 2023 recession this was certainly important. However, the highlight and key component of the economic resilience was the low unemployment and continued strength in the labor market.
Persistently low oil prices - low oil / gas prices are not only a key consideration in inflation (despite a focus on core / ex-energy measures), but also factor into consumer confidence.
What was not a factor of the S&P 500s 2023 advance?
Earnings growth. While earnings, earnings expectations and growth were certainly prevalent at Nvidia, it was noticeably absent at Apple and for the S&P 500 overall in 2023.
While we believe that the S&P 500 can climb another 5% from current levels (to around 5100), we see any near-term appreciation above those levels as constrained.
On the downside, the pillars of 2023 equity market growth may be running out of steam.
Stealth Liquidity is likely nearing its conclusion (Reverse Repos are near their end, Treasury will likely extend duration), while more traditional monetary easing (rate cuts, slowing Quantitative Tightening) has been priced in and often takes time to impact the “real economy.”
The Magnificent 7 have started 2024 with the same strength that they exhibited in 2023. That said, we always consider a narrow market (70% of the S&P 500 underperformed the index last year) as fragile (see Chart 3). According to Bespoke, through last Friday (Jan. 19), Nvidia and Microsoft had accounted for about 75% of the S&P 500's gain this year, while the 20 largest stocks in the index accounted for 110% of the index's upside move. The remaining ~480 stocks were acting as a drag. Not a catalyst, but a risk.
Sentiment has shifted. The CNN Fear & Greed Index has been in the “Greed” and “Extreme Greed” zones for the past month. While Sentiment is difficult to measure and there may be skeptics, equity exposure (Chart 4) and confidence are much higher than they were at this time last year.
Is Employment Still Strong? Is it just me or are there a number of lay-off announcements occurring. Sports Illustrated (my first magazine subscription) is basically closing; Citigroup has announced plans to reduce its workforce by 20,000 over the next 2 years; SolarEdge (solar power) is cutting 16% of its workforce; Macy’s is shutting 5 stores and cutting 2,300 jobs; Unity (a gaming company specializing in virtual reality) is laying off 25% of its workforce; and electric vehicles seem to be in a downturn. While it may be idiosyncratic (company specific), it is across industries and not currently reflected in jobless claims. Keep your eyes open for these announcements.
Low Oil Price / Inflation. One of the factors in last year’s low oil price was the draining of the US Strategic Reserve. We will see if low oil prices can persist.
A final characteristic of 2023 which was interesting was the difference between what the technicals - charts, history, money flows - were saying (bull market) vs. those that focused fundamentals - earnings, valuation and the macro backdrop (bear market).
The technicals entering 2024 are still supportive - a new high after 2 years plus (Chart 2); a big up year (2023) after a big down year (2022); and the 4th year of the presidential cycle (Chart 5) - have all been consistent with positive returns. (Past performance is not indicative of future results).
However, in the past, these indicators have suggested gains closer to 10% rather than the 24% returns of 2023. (In other words continued upside, but more moderate). (Past performance is not indicative of future results).
Although we are not calling for significant downside, we want to be mindful of complacency. We wouldn’t be surprised to see a ~5%+ correction (to around 4600 / higher grey shaded area) after the 17% rally of the past 3 months.
Source: Bloomberg. Through year-to-date 2024.
2. A New S&P 500 High After a Long Drought
On Friday, the S&P 500 made its first new high in 506 trading days (just over two years).
The good news is that this has typically foreshadowed further gains across different time periods out to 1 year (250 trading days). (Past performance is not indicative of future results).
However, the gains have been mixed in terms of magnitude.

Source: Strategas and Bloomberg. Through year-to-date 2024.
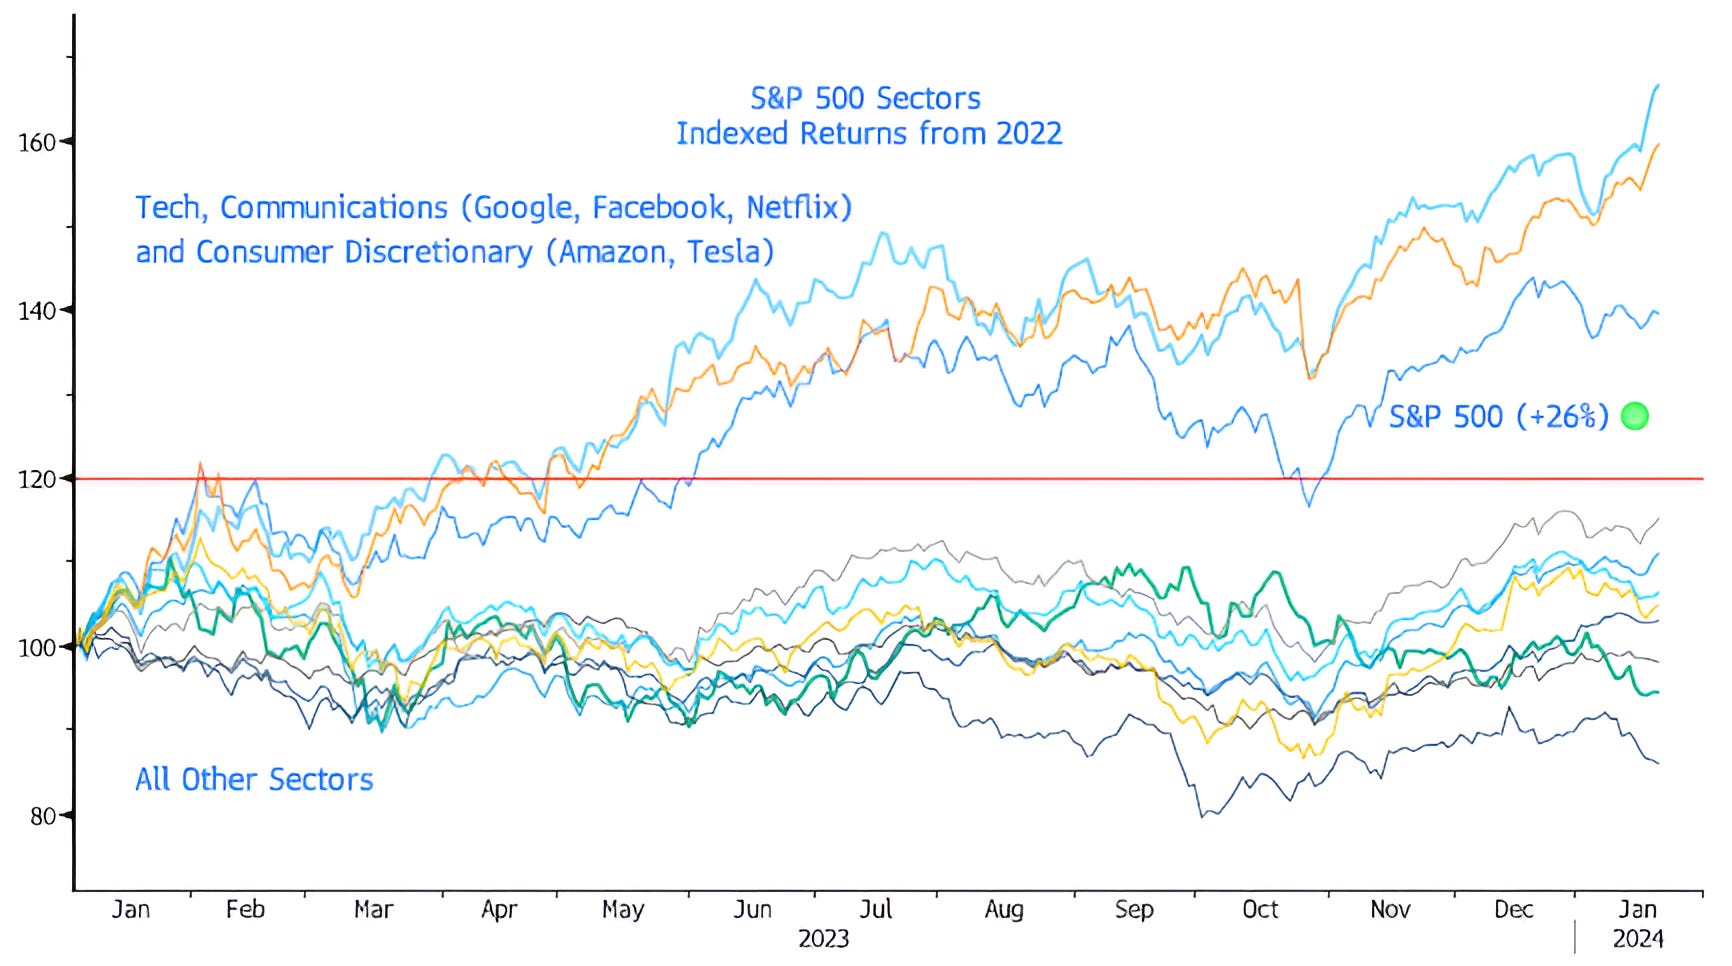
3. The Haves and Have Nots
Below is a chart of the S&P 500 Sectors Indexed from December 31, 2022.
There are only 3 sectors that have outperformed the S&P 500 (green dot): Technology (Apple, Microsoft, Nvidia); Communications (Google, Meta / Facebook, Netflix); and Consumer Discretionary (Amazon, Tesla).
All other sectors have underperformed the Index.
While I am not sure that this condition is indicative of future market direction, we would like to see a broadening of market participation. We view markets with narrow participation as fragile.
Source: Bloomberg. Through year-to-date 2024.
4. Everyone Back in the Pool!
The chart below shows US equity positioning.
The blue line is the non-dealer length (long higher / short lower) in Equity Index futures and the black line shows the positioning of trend following (CTA) hedge fund strategies.
Both non-dealers and trend following hedge funds are at equity exposure levels that have been levels from which pauses in the market’s ascent have occurred. (Past performance is not indicative of future results).
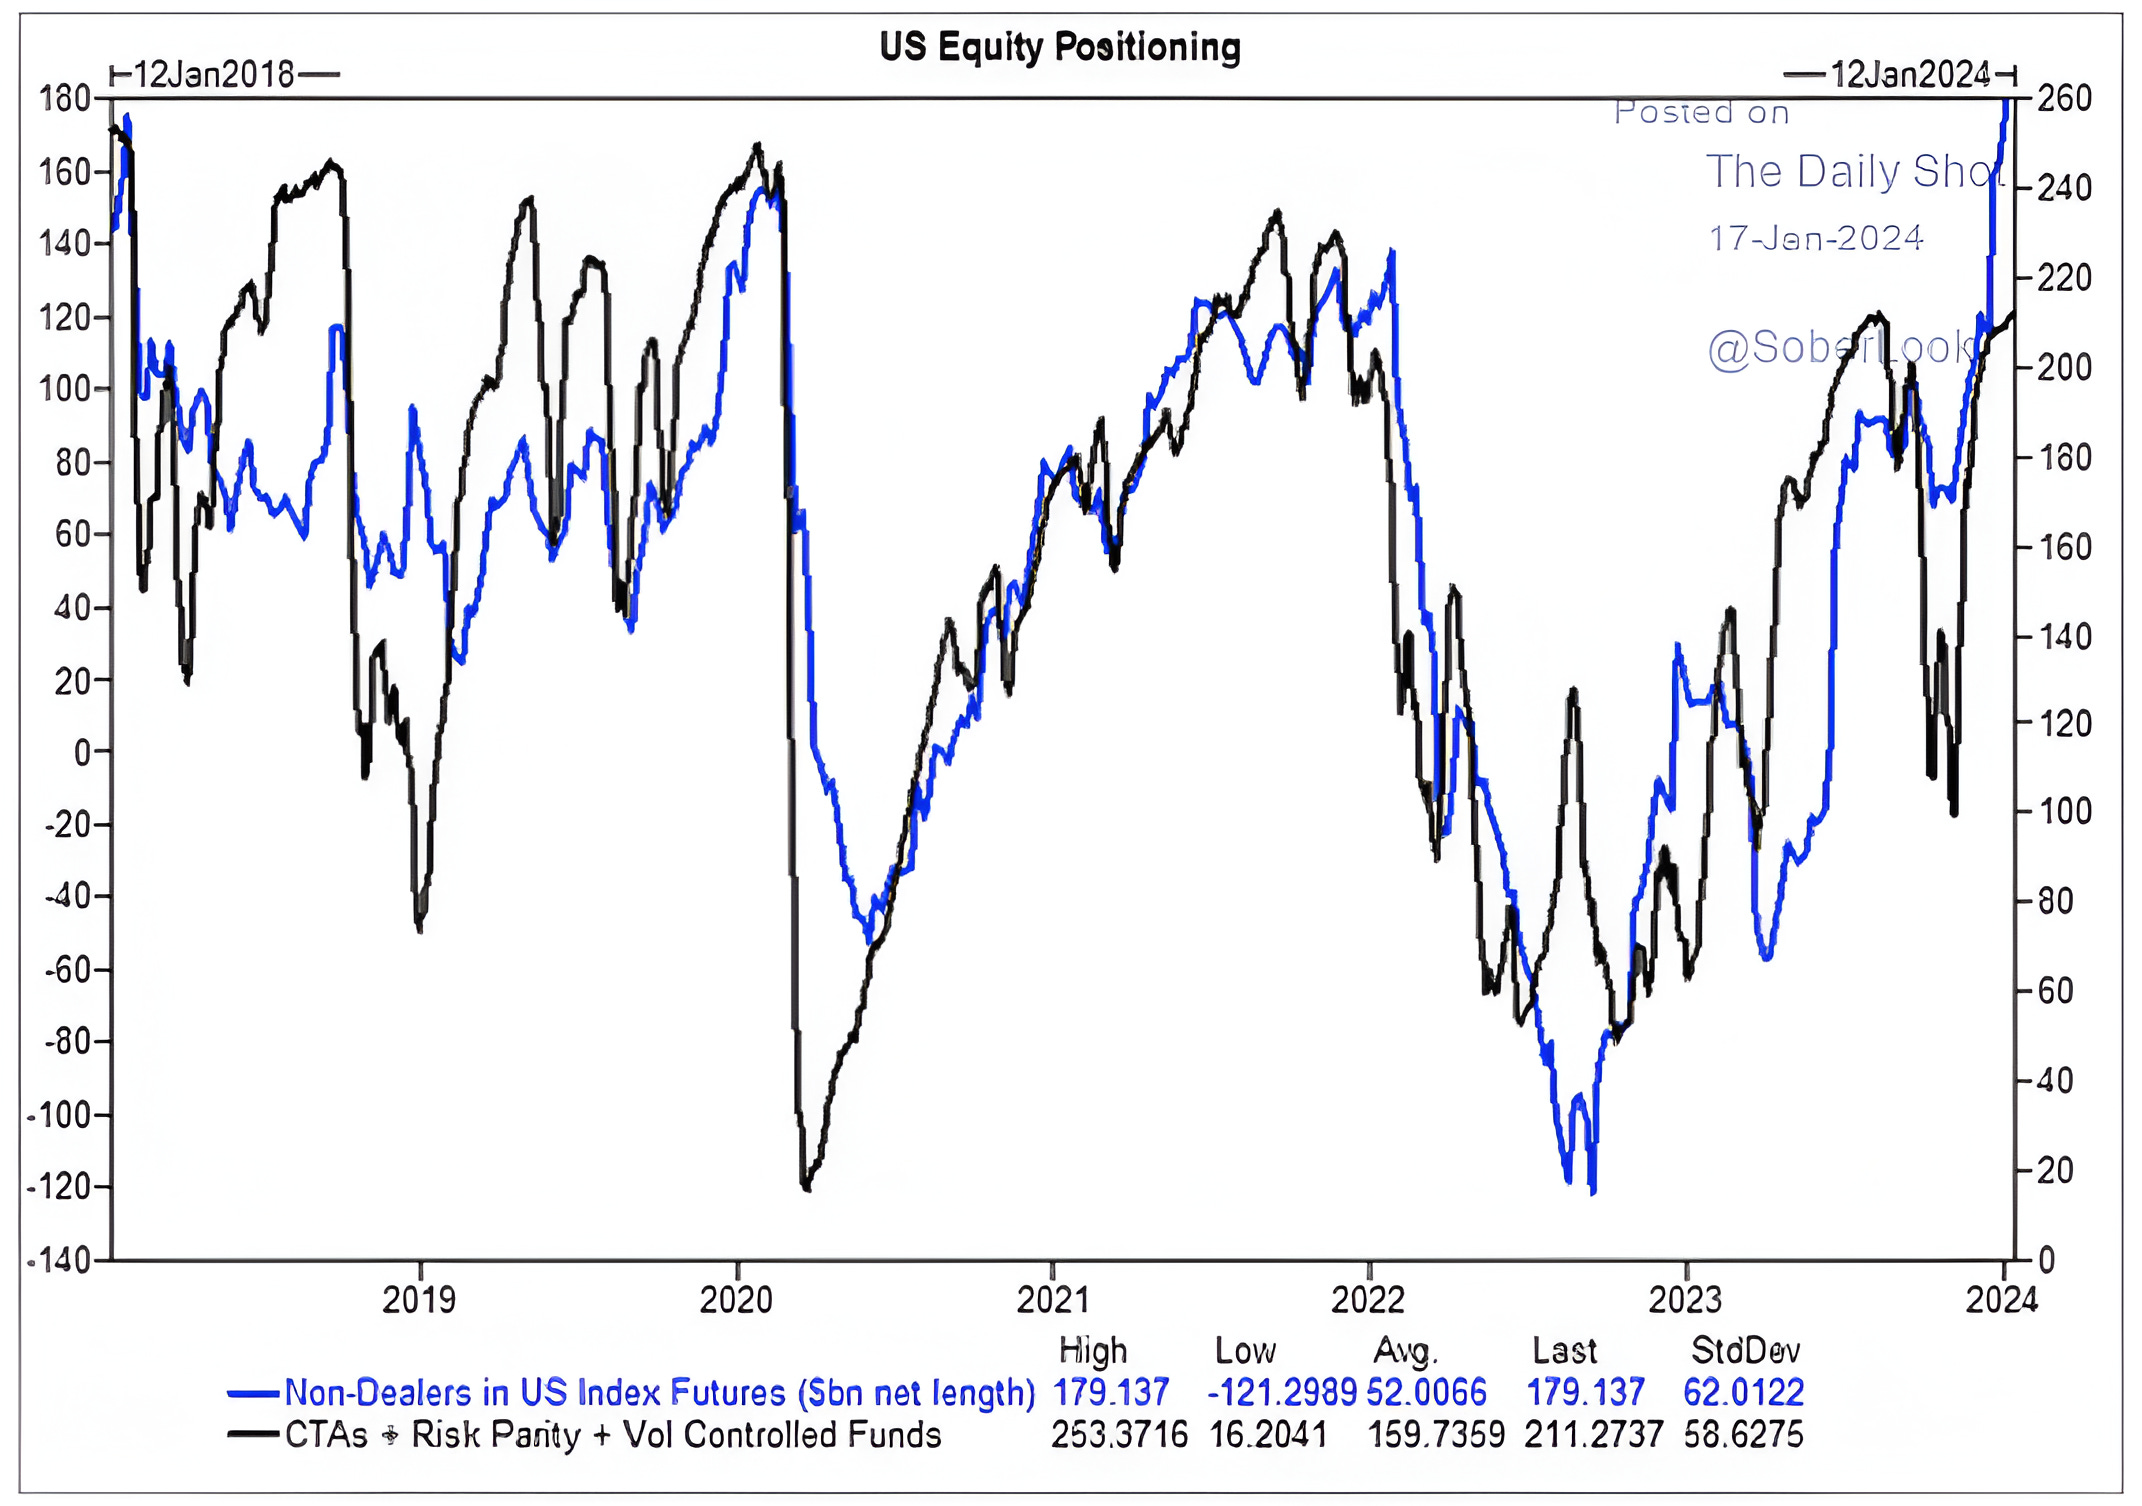
Source: Goldman Sachs, the Daily Shot. Through January 12, 2024.
5. Seasonality - the Presidential Cycle
The US election cycle has provide a somewhat consistent and accurate road map for equities.
Since 1950, year 4 of the cycle, the election year, has on average: experienced volatility in Q1; a rally from mid-March (the low) to September; a sell-off to the election and a year-end rally.
While the S&P 500 is up 1.8% this month, January began with a 1.7% drawdown.
As we wrote above, we wouldn’t be surprised to see a correction after the gains of the last three months.
This would be consistent with the Q1 volatility in a typical election year. Furthermore, we believe that the majority of 2024 equity returns will be in the second half of the year.
