A Closer Look at Liquidity and Yields
Our view has been that "stealth liquidity" helped support the equity market during 2023. We wanted to dive into the detail of liquidity to help inform our 2024 outlook.
“Earnings don't move the overall market; it's the Federal Reserve Board... focus on the central banks, and focus on the movement of liquidity... most people in the market are looking for earnings and conventional measures. It's liquidity that moves markets.” Stan Druckenmiller
1. Do 10-Year Yields Look Like They’re Moving Lower?
Below is a 45-year chart of 10-Year US Treasury yields.
From 1981 to 2020 (the low in yields), the US experienced an extraordinary bull market in fixed income as yields moved lower.
During that period, 10-Year US Treasury yields moved from 15.5% to 0.5%.
Lower borrowing costs likely helped a number of industries (private equity) and sectors (real estate) and tangentially supported public equities (buyouts, share buybacks, borrowing to expand, m&a, cheaper capital in general).
Looking at the chart, in our view, the bull market (consistently lower yields) is likely over.
While many investors believe that the peak in Yields for the current cycle was achieved in late October when 10-Year Treasury yields moved slightly above 5% before retreating (and they might be right), we see a reasonable probability that the 115 basis point drop in yields in the last 2 months of 2023 was a small retracement after the 450 increase during the prior 3 years and will give way to a higher levels in the future.
When 10-Year US Treasury Yields moved from 1.5% in January 2022 to 4.3% in October 2022 (the majority of their increase), it coincided (nearly perfectly) with the sell-off in equities - particularly higher growth and biotech.
In general, we view higher yields as valuation contractors - particularly for those companies that have a greater share of their earnings projected further in the future. (There is math behind this both from discounted cash flow and equity risk premium (chart 4 here) perspectives for those that are interested).
As a result, we see higher yields as a risk to equity markets.
There are both fundamental (economic growth and inflation) and technical (money flows including supply - see Chart 3) considerations when we see the possibility of higher 10-Year US Treasury Yields.
While economic growth may be slowing, inflation remains a concern.
Despite the fact that the market has priced in several rate cuts over the next year, recent inflation data has been above expectations (with the exception of the Producer Price Index).
Shipping prices, which have not yet begun to impact prices, are at their highest level since covid (we showed this in Chart 3 here) and if Oil begins to creep higher, there is the potential for inflation to be more persistent than currently considered.
We have highlighted the stealth liquidity that the Fed and Treasury provided last year. We have gone into more detail in Charts 2, 3 and 5.
In our view, some of the measures implemented by the Fed and Treasury during 2023 - such as when the Fed used Quantitative Easing (buying bonds) to mitigate the regional banking crisis (easy to see on Chart 5) and how the Treasury managed the tenor of debt issuance (Chart 3) - likely helped contain 10-Year yields.
For price pattern experts (technicians), the break above the downtrend line is obvious.
What may be less obvious is that the red-dashed line at 4.0% is right at the 23.6% Fibonacci retracement of the high in yields in 1981 to the low in 2020.
Simply looking at the chart, the recent move looks like a consolidation (sideways move) before resuming in its previous direction (higher).
While this is not a prediction, as stated above, we see this as a risk, particularly to some of the widely held parts of the market and we want to watch this carefully.
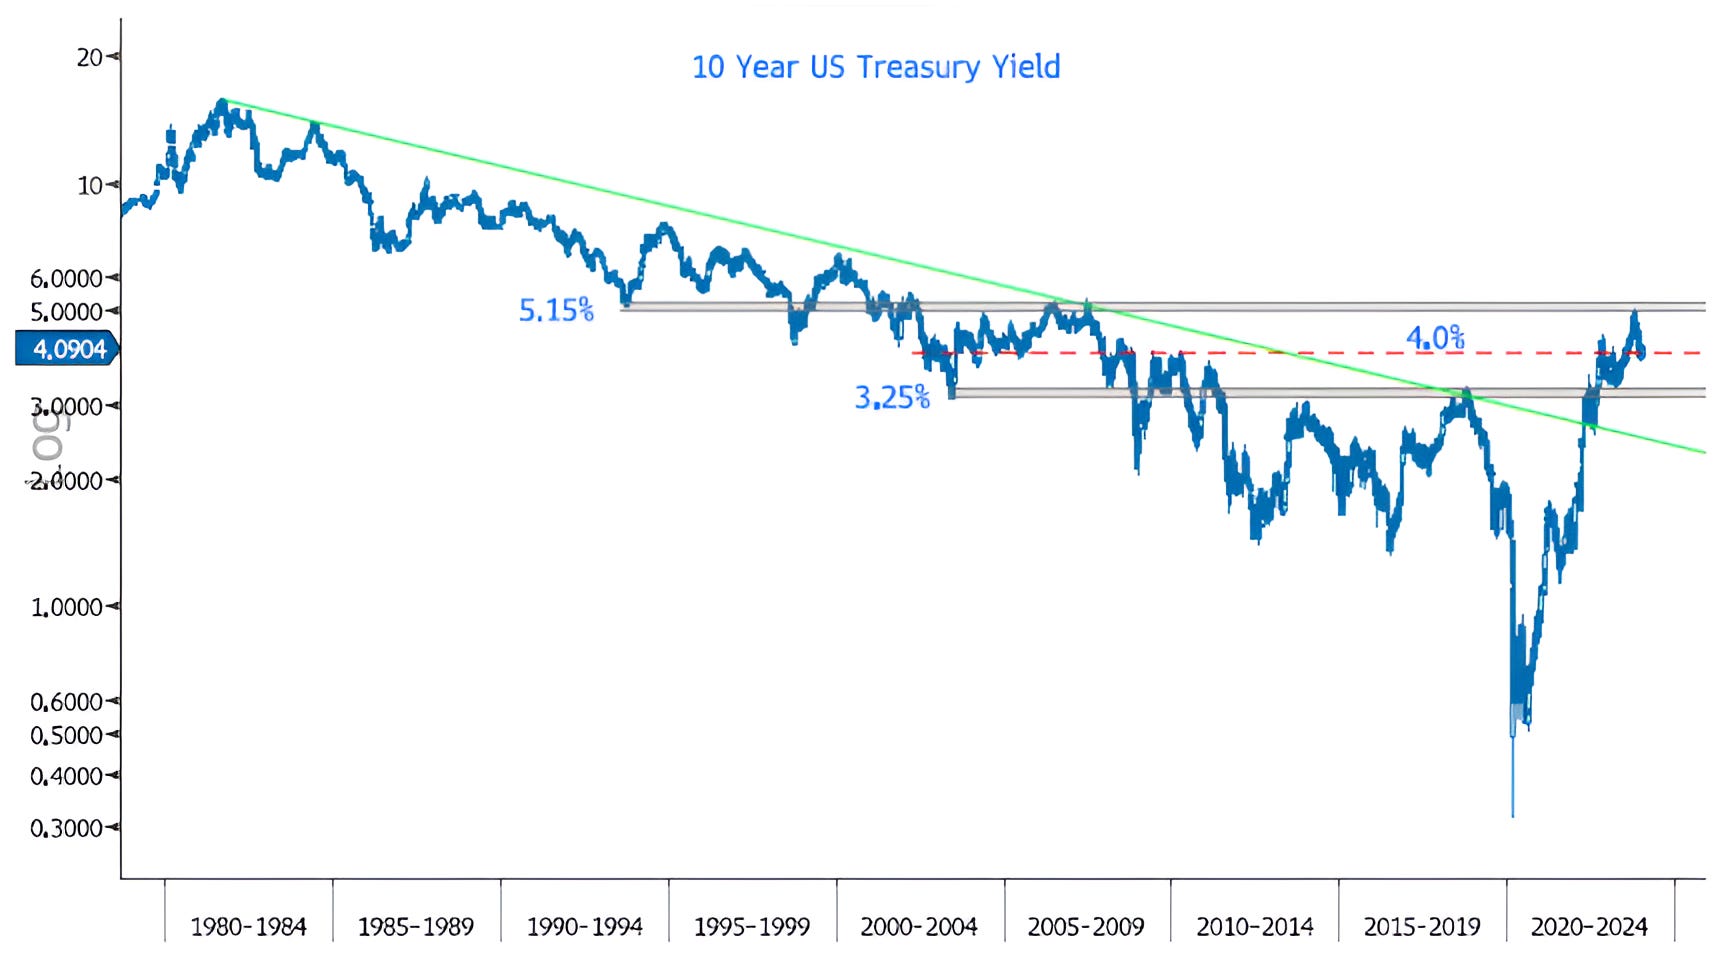
Source: Bloomberg. Through year-to-date 2024.
2. Stealth Liquidity
The chart below aggregates the changes in the Feds Balance Sheet, the Treasury General Account and Reverse Repo account (shown in Chart 3 here).
In March 2023, in response to the regional banking crisis, the Fed reversed half of its quantitative tightening to that point and bought $400 billion in securities to stimulate bank lending (see Chart 5).
Shortly thereafter, the US government hit its debt ceiling and the Treasury added liquidity through its General Account.
Once the debt ceiling was lifted (and the government went on a further $3 trillion spending binge), the Treasury added liquidity through Reverse Repos.
The Reverse Repo account initially grew during the post-Covid QE period from 2020-2021. At the time, the Fed printed so much money that the excess needed a place to go. That place was the Reverse Repo account.
As the account is drawn down, this money is used (instead of bank reserves) to buy Treasury bonds. In other words, while the Fed is shrinking its balance sheet, this "stealth" QE has somewhat off-set the impact.
While there is a growing belief that the Fed will alter its Quantitative Tightening (slow it down so it doesn’t drain liquidity), we see limited scope for additional “stealth liquidity” from the Treasury’s General Account or the Reverse Repo Account in 2024.
That said, traditional rate cuts may be able to come to the liquidity rescue.
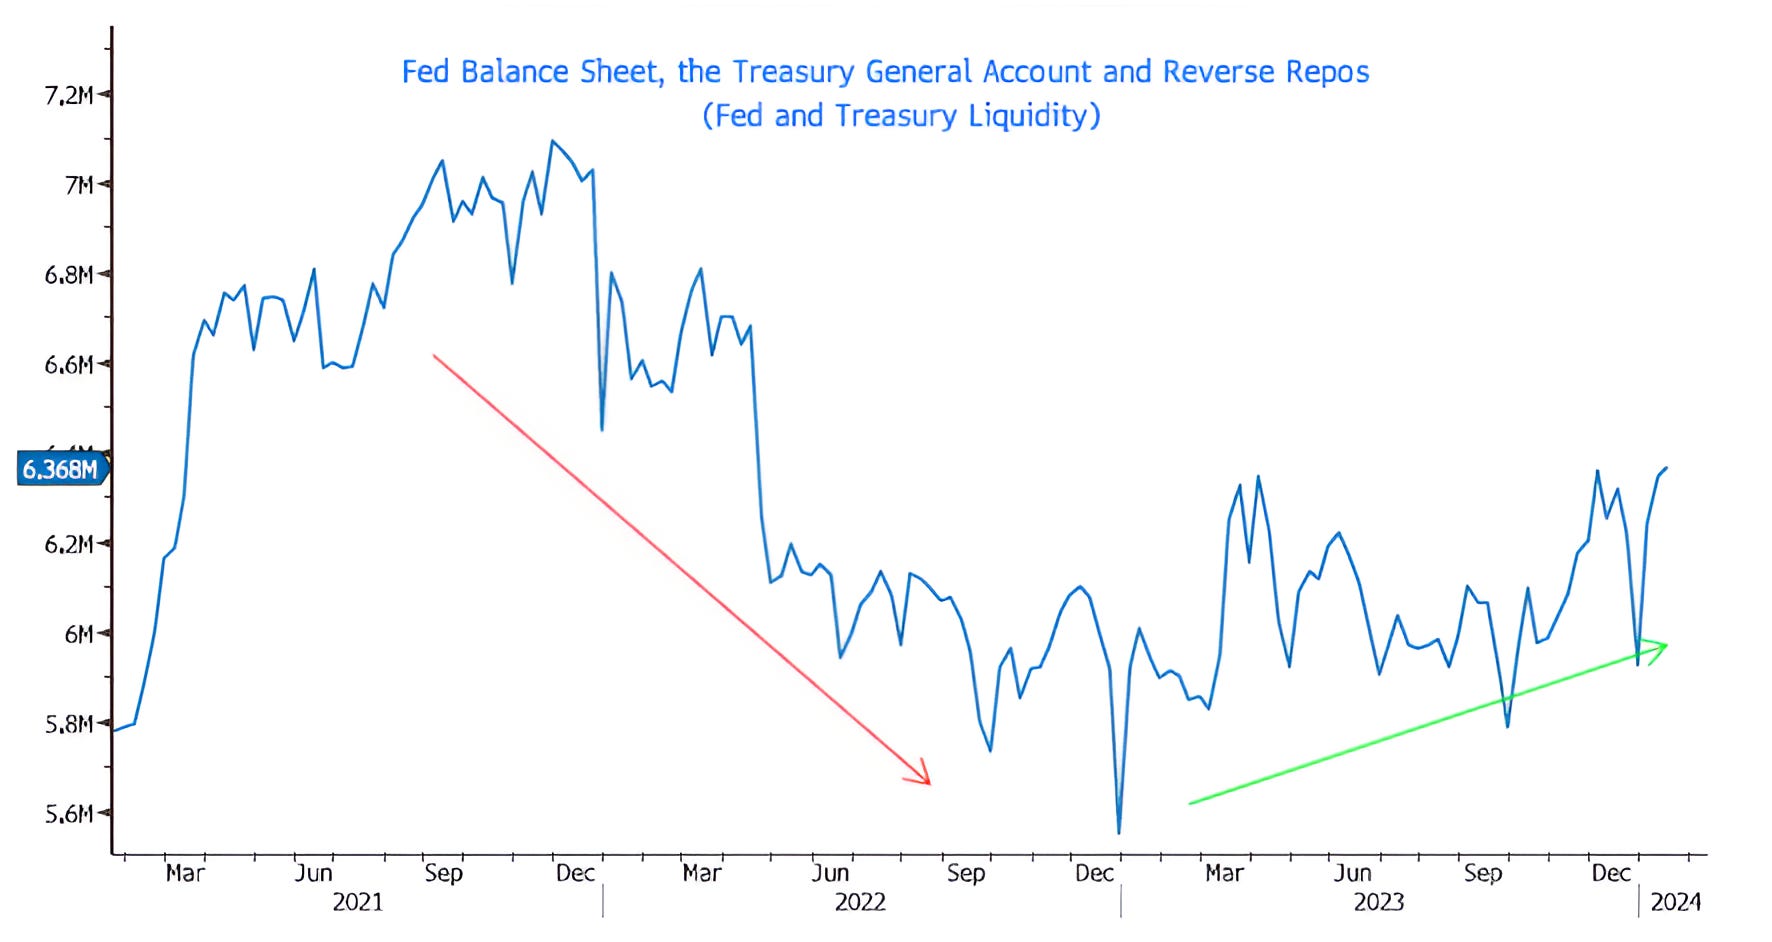
Source: Bloomberg. Through year-to-date 2024.
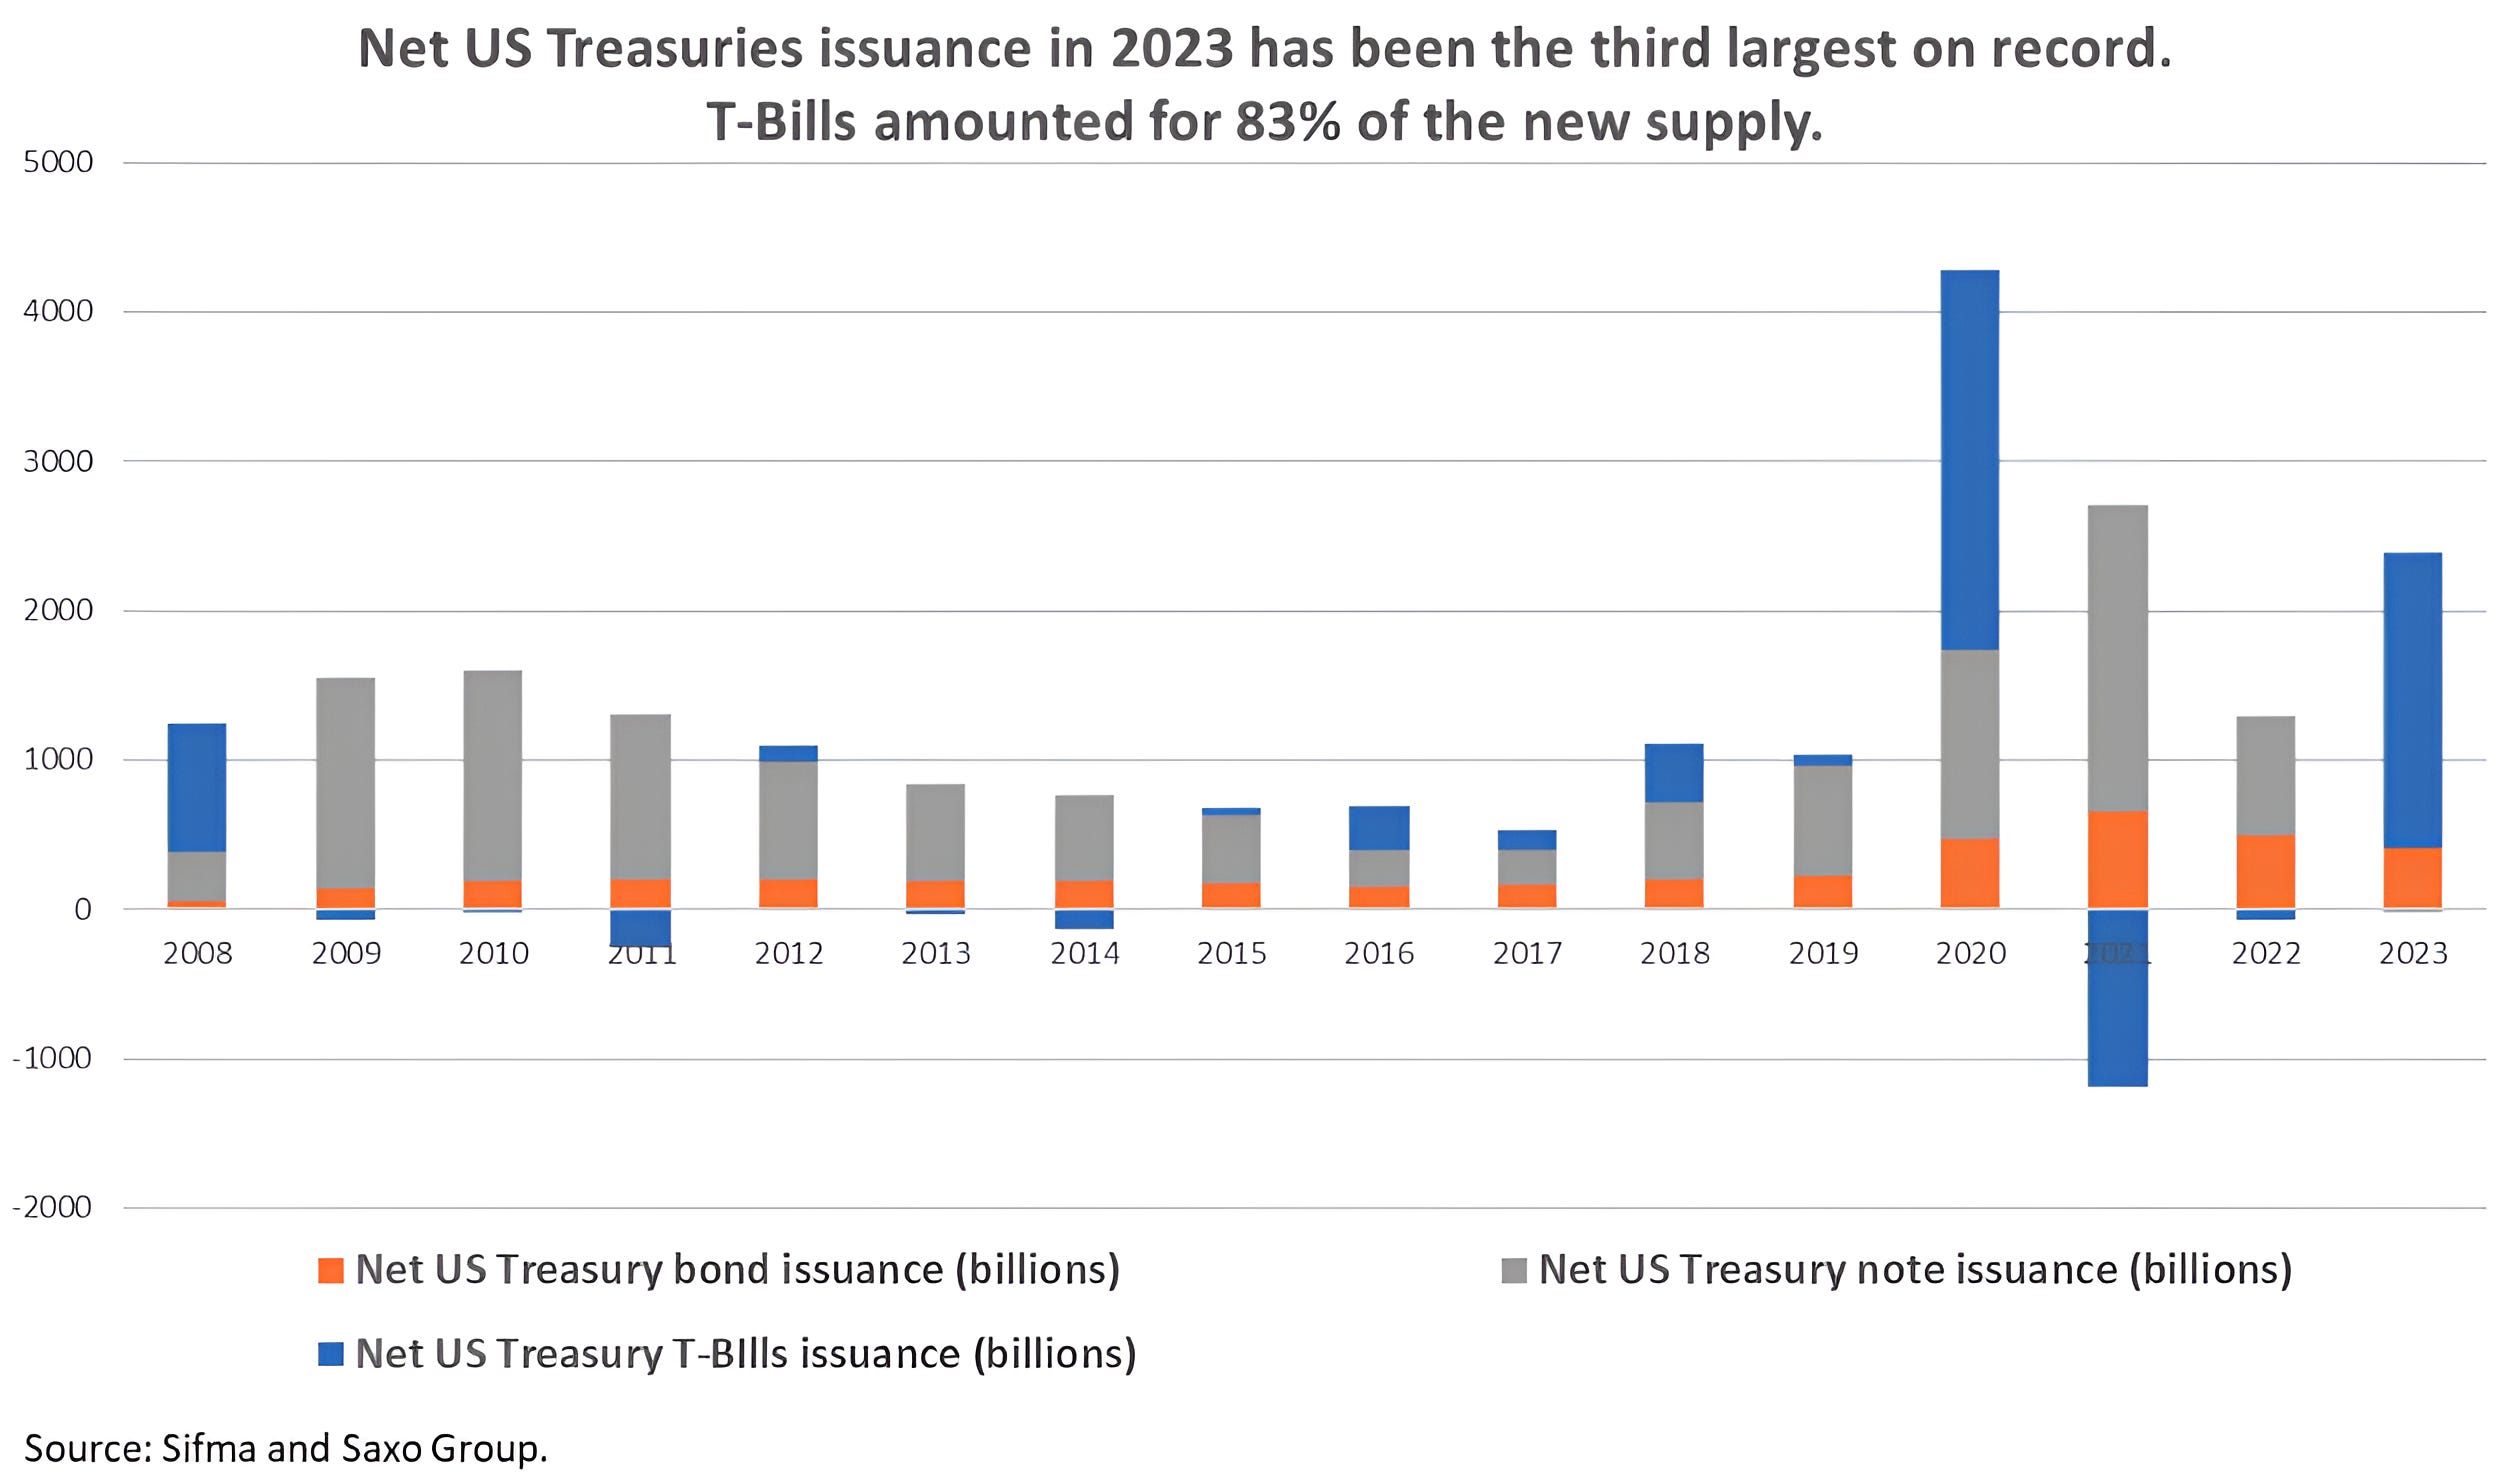
3. One of Wizard Yellen’s Tricks
The Treasury has a choice in the way that it funds the deficit (which we showed in Chart 4 here).
It can issue bonds, which have the longest maturities (20-30 years); notes which have maturities between 2 and 10 years; or bills which have the shortest maturities (4 weeks to 1 year).
[If you are wondering about the gaps in time, remember the Treasury does not issue 18 month bills / notes or 15 year notes / bonds].
During 2023, Yellen issued the 2nd largest net amount of T-bills on record while at the same time, issuing no notes (net).
Why was this important?
There are basically three rules of economics that I have learned to value. One of them is the rule of supply and demand.
The greater the supply, all else equal, the less the price.
In the case of notes or bonds, if there is a heavy supply, in order to attract buyers, all else equal, price most be lower and yield will be higher.
By issuing no notes during 2023, the Treasury likely kept yields lower in the 2-10 year portion of the curve than they otherwise might have been. (We can never know the counter-factual for sure).
While it looks like the Treasury issued a lot of bonds (20-30 year maturities), on a net basis, as can be seen on the chart, not many Treasury bonds have been issued since 2009.
Pension funds and insurance companies have an appetite for 20-30 year Treasuries in order to manage the duration of their portfolios and their liabilities.
Essentially, there is often demand. As a result, given the low total issuance of the last 15 years, yields have been contained.
Ironically from 2009 to 2022, there were historically low rates for US Treasuries (across the curve) meaning that the government could have borrowed a lot of money for 30 years with attractive interest rates, but didn’t do so.
The challenge for the Treasury in 2024 will be that many of the T-bills issued during 2023 will need to be refinanced and that the duration profile will likely need to be extended (ie issue more notes and bonds).
This may put pressure on longer-term yields (higher).
4. Riddle Me This…
If corporate treasurers - particularly those at banks that make up the bulk of Investment Grade (IG) issuers - see the Fed cutting rates 7 times in the next year and believe yields will be coming down throughout 2024, why are they issuing so much paper to start the year?
Either it’s because the new issue market was closed during the second half of 2023 (partially true as Treasury Yields used as the basis for corporate IG pricing was higher than it is now) and companies want borrow while the window is open.
Or it is because corporate treasurers - and a lot of this is bank issuance where the Treasury departments often have strong market convictions - see yields moving up from current levels.
We shall see.

Source: Bloomberg. Through year-to-date 2024.
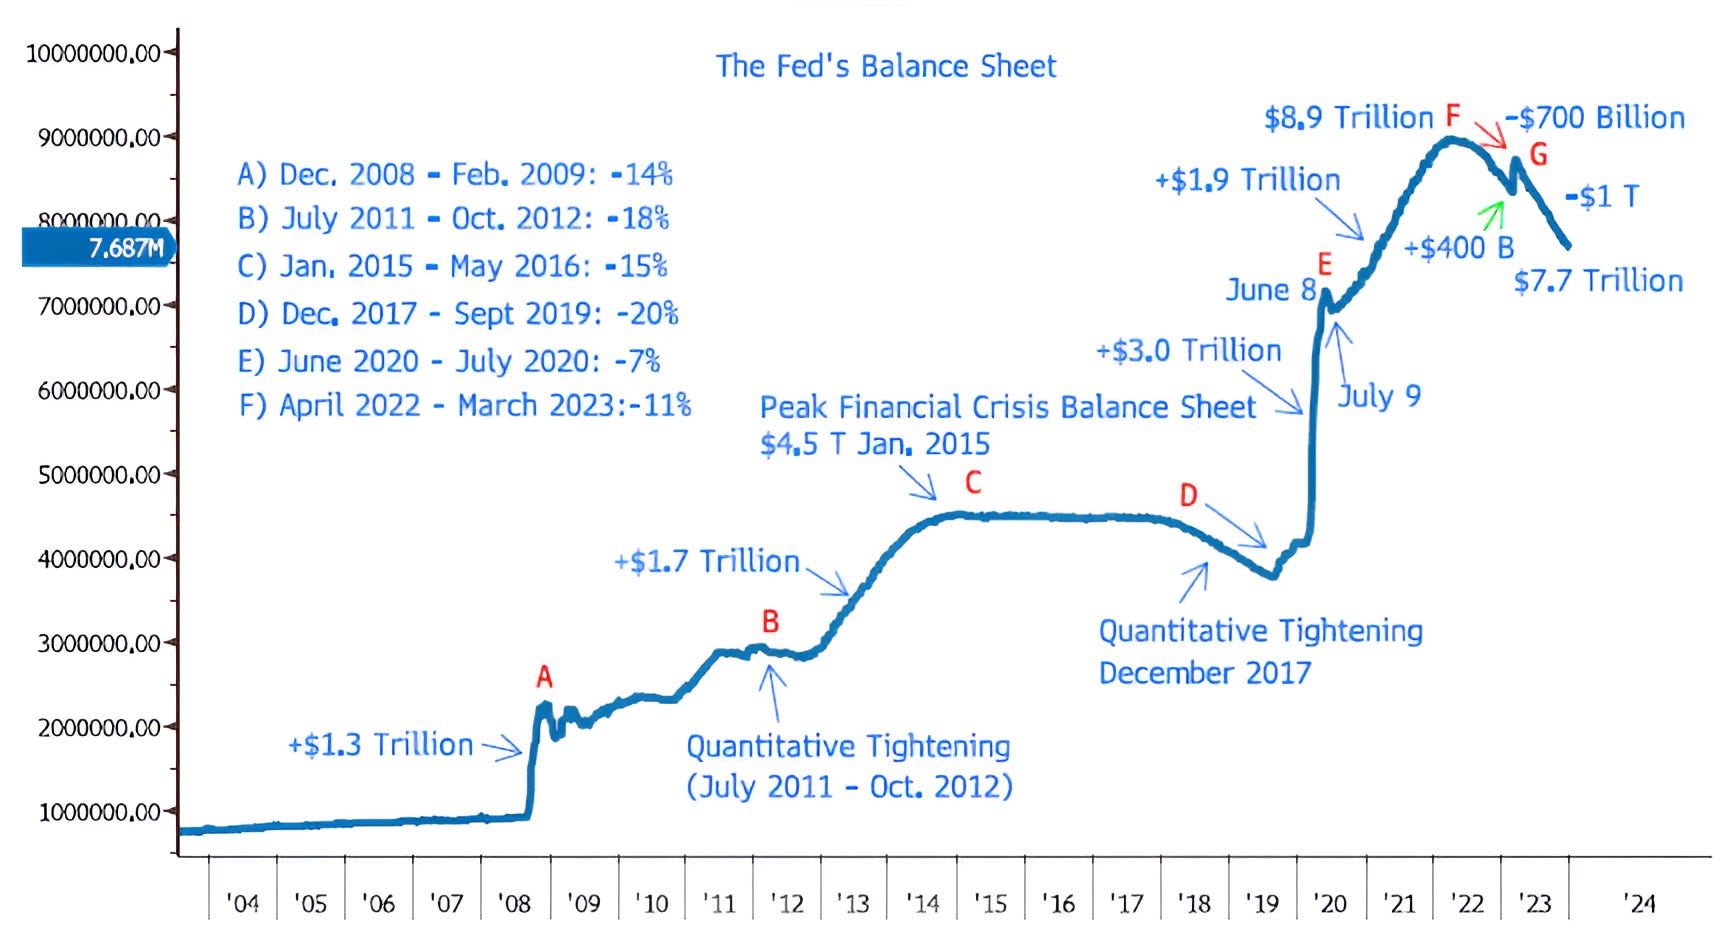
5. Why Do We Believe Stealth Liquidity Was Important?
Our view (in line with Stan Druckenmiller’s) is that since the initial period of Quantitative Easing in 2008 (in response to the Financial Crisis), all attempts by the Fed to shrink its balance sheet have been consistent with periods of equity market volatility.
We have tried to annotate the chart below to detail our thinking as every letter on the chart corresponds to a period when the assets on the Fed’s balance sheet moved down and on the left is that S&P 500 performance during that period.
The only time over the past 15 years that the Fed has reduced the size of its balance sheet and the equity market has not dropped has been the period since March 2023.
Our view is - as detailed in Chart 2 (which includes the changes in the Fed’s balance sheet) - that the recent Quantitative Tightening has been off-set by the Treasury using its General Account and Reverse Repo account to provide stealth liquidity.
Although it is becoming consensus that the Fed will slow the reduction of its balance sheet, this will likely not happen immediately.
If the Treasury cannot continue to off-set Quantitative Tightening and if the current period of equity market performance is similar to others when the Fed’s balance sheet was reduced, there may be a double digit (10%+) correction in equity markets. (Past performance is not indicative of future results).