


Equities Exhibiting Characteristics We Normally See at Lows
Despite all-time highs - after a 3-month 20% rally (nearly unabated), we are seeing a number of technical indicators that often take place before significant moves higher.
As the S&P 500 has continued to move higher, we have written about a number of near-term macro and micro-challenges. However, we have been insistent on being aware and vigilant while not over-reacting.
Given our near-term concerns, where appropriate we have added a little cash, bought options for protection and emphasized our best ideas within the sectors with the strongest fundamentals. (These are not recommendations).
That said, the charts below suggest that those investors with a longer-term focus could be rewarded.
Time horizons matter.
1. Regional Surveys Have Disappointed
Frequent readers know that I have questioned the economic strength in the current environment.
With this in mind, I have been watching the regional surveys closely.
We highlighted this months disappointing Philadelphia Business Outlook Survey and Empire State Manufacturing Survey in chart 3 of “To Recession or Not to Recession, that is the Question?” (here).
At the time, both of those surveys were negative and had come in below expectations.
Since then, we have had reports from Dallas, Kansas City and Richmond. Each has been similarly negative and below expectations.
There have only been 3 other times over the past 12 years that all 5 regional surveys have come in negative and below expectations.
Those 3 times occurred at the beginning of 2-year S&P 500 rallies. (Past performance is not indicative of future results).
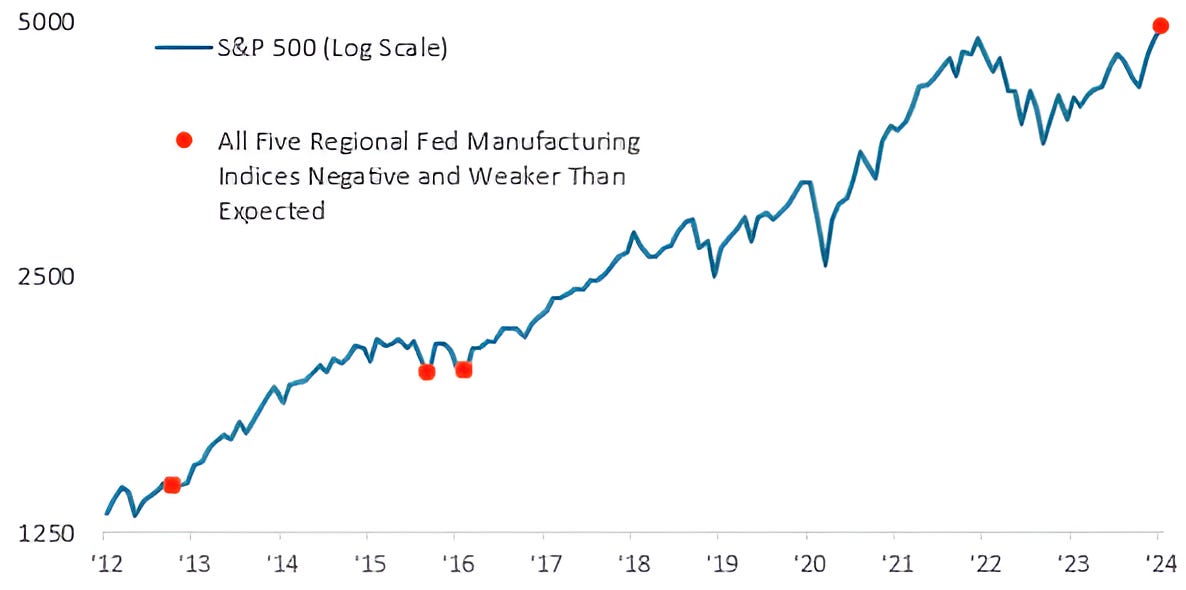
Source: Bespoke and Bloomberg. Through year-to-date 2024.
2. The Arms Index Indicates Extreme Selling Volume
The top panel of the chart below shows the S&P 500 and the lower panel shows the Arms Index.
The Arms Index is calculated by dividing the advancing/declining ratio (AD ratio) by the advancing/declining volume (AD volume) - it is seen as an indicator of selling pressure.
Last week, the Arms Index moved above 1.5 an indication of extreme selling pressure - a level it has achieved only two other times in the past 5 years.
In each of those prior instances (probably doesn’t qualify as a sample size), the extreme Arms Index, although it didn’t coincide with the cycle low, occurred at the end of the sell-off and beginning of a recovery.

Source: Sentiment Trader. Through year-to-date 2024.
3. 12 of the Last 13 Weeks in the S&P 500 Have Been Up
Through last Friday, 12 of the last 13 weeks in the S&P 500 have been higher.
Over the last 70 years, this has only happened 10 other times including 2 overlapping periods (that statisticians might discount).
On average one year later, the S&P had returned 11.7% which is higher than the long-term average for all periods. (Past performance is not indicative of future results).
Historically, this has not been the behavior at important market tops.

Source: Bloomberg. Through year-to-date 2024.
4. “As Goes January, so Goes the Year.”
With one trading day left in the month, the S&P 500 is currently up 3.3% this January.
While we recognize the important earnings releases this evening including those from Microsoft, AMD and Alphabet (Google) as well as the Fed announcement tomorrow and we don’t want to jinx it, it is likely that the S&P 500 will will finish January with positive performance.
In the past, as can be seen on the chart, a positive January has been consistent with much better annual returns than negative January performance. (Past performance is not indicative of future results).
At the beginning of the month, we highlighted the Santa Rally Indicator here.
In the analysis, we noted that in those years with both negative Santa periods and negative January’s, the S&P has averaged a return of -3.3%.
However, in those years with a negative Santa period but a positive January have returned 17.4% on average. (Past performance is not indicative of future results).

Source: Carson Research and FactSet. Through year-to-date 2024.
5. The Average Stock Might Be Coming to the Party
After trading primarily in a sideways range for the past 18-months, the Equal Weight S&P 500 (what we consider the average stock) is sitting above its prior ceiling level (highest light blue shaded area) and near 24-month highs.
While we want to see further upside here to “confirm” the move higher, we view this as a positive development.
One of the challenges in US equities over the past year has been the narrow breadth - the fact that 7 shares have been responsible for a disproportionate percent of upside.
The move higher in the Equal Weight S&P 500 in our view represents greater participation in the upside performance of the S&P 500 and is a healthy positive development.
(Past performance is not indicative of future results)
