


An Update on Earnings Season
As the equity reaction to earnings season has largely been positive, we thought we should take a closer look at earnings and expectations. Let's dig in...
We have been highlighting our concern that inflation would remain sticky (see chart 5) and 10-Year yields might move higher than some have considered (see chart 4).
Today, may have been an inflection point.
We always view the fundamentals - earnings, earnings growth and valuation as the foundation of our work. While in general, we have been focusing on macro and positioning, today, we wanted to focus on the fundamentals.
In general, earnings have been ok, not great. (Charts 1 and 2).
Valuation is elevated. (Chart 3).
Does it matter?
We’ll see.
If 10-Year Treasury yields continue to head higher (chart 4) and the Fed remains tighter than the market has been expecting, it may be a challenging backdrop for an equity markets trading at premium multiples.
1. Earnings Season: Good News / Bad News
Q4 2023 S&P 500 earnings have been better than expected.
That’s the headline.
The reality, like with most things, is more complicated.
Q4 2023 S&P 500 earnings are currently expected to be $54.89 which puts year-over-year growth on pace for 2.6%. (See Chart below).
While this is better than the negative growth expected at the outset of earnings season, when we look at estimates from November 3, Q4 earnings were expected to be $55.51.
In other words, companies spent the last two months of the year guiding analysts to reduce Q4 earnings estimates and have now exceeded the lowered estimates.
We are currently at a similar stage of Q1 (approximately 1 month in).
According to FactSet, 73 companies in the index have issued earnings guidance for Q1 2024. Of these 73 companies, 52 (71%) have issued negative earnings guidance and 21 (29%) have issued positive EPS guidance.
The percentage of companies issuing negative guidance for Q1 2024 is above the 5-year average of 59% and above the 10-year average of 63%.
Remember, Q4 2022, Q1 2023 and Q2 2023 all had negative earnings growth.
Typically, we would like to see a strong year-over-year rebound. This doesn’t seem to be happening.
In fact, Q4 2023 earnings, while slightly higher than those from Q4 2022, are set to come in 1% below Q4 2021 earnings ($55.38).
While we recognize all of the challenges with sales growth, margins, supply chains, stimulus, inflation, currencies etc. that have impacted earnings since covid, earnings for Q4 just aren’t great.
But that’s not our issue.
Our issue is the expectation that Q4 2024 earnings ARE going to be great.
Looking at the chart below, Q4 2024 earnings are expected to exhibit the greatest percentage growth of the last 3 years.
How? Why?
The nearly 18% growth estimated for Q4 2024 allows analysts to estimate the full year 2024 earnings $242.58.
This in turn feeds into a valuation calculation for the S&P 500 of 20.6x forward earnings - which is 1 standard deviation over the long-term median.
While extreme is in the eye of the beholder (and we prefer not to make that judgement), we would characterize the current valuation as elevated.
If Q4 earnings were to grow at 8% (in the middle of Q2 and Q3 expectations), with all else equal, 2024 earnings would be $237 and the multiple would be 21.1x - which is obviously even more stretched.
This is all to say that this is an expensive market with lackluster earnings.
Does it matter?
We’ll see, but for now, we consider fragile or vulnerable and recognize that valuation is not a catalyst
(This is not investment advice).

Source: FactSet. Through February 9, 2024.
2. All Mag 7, All. The. Time.
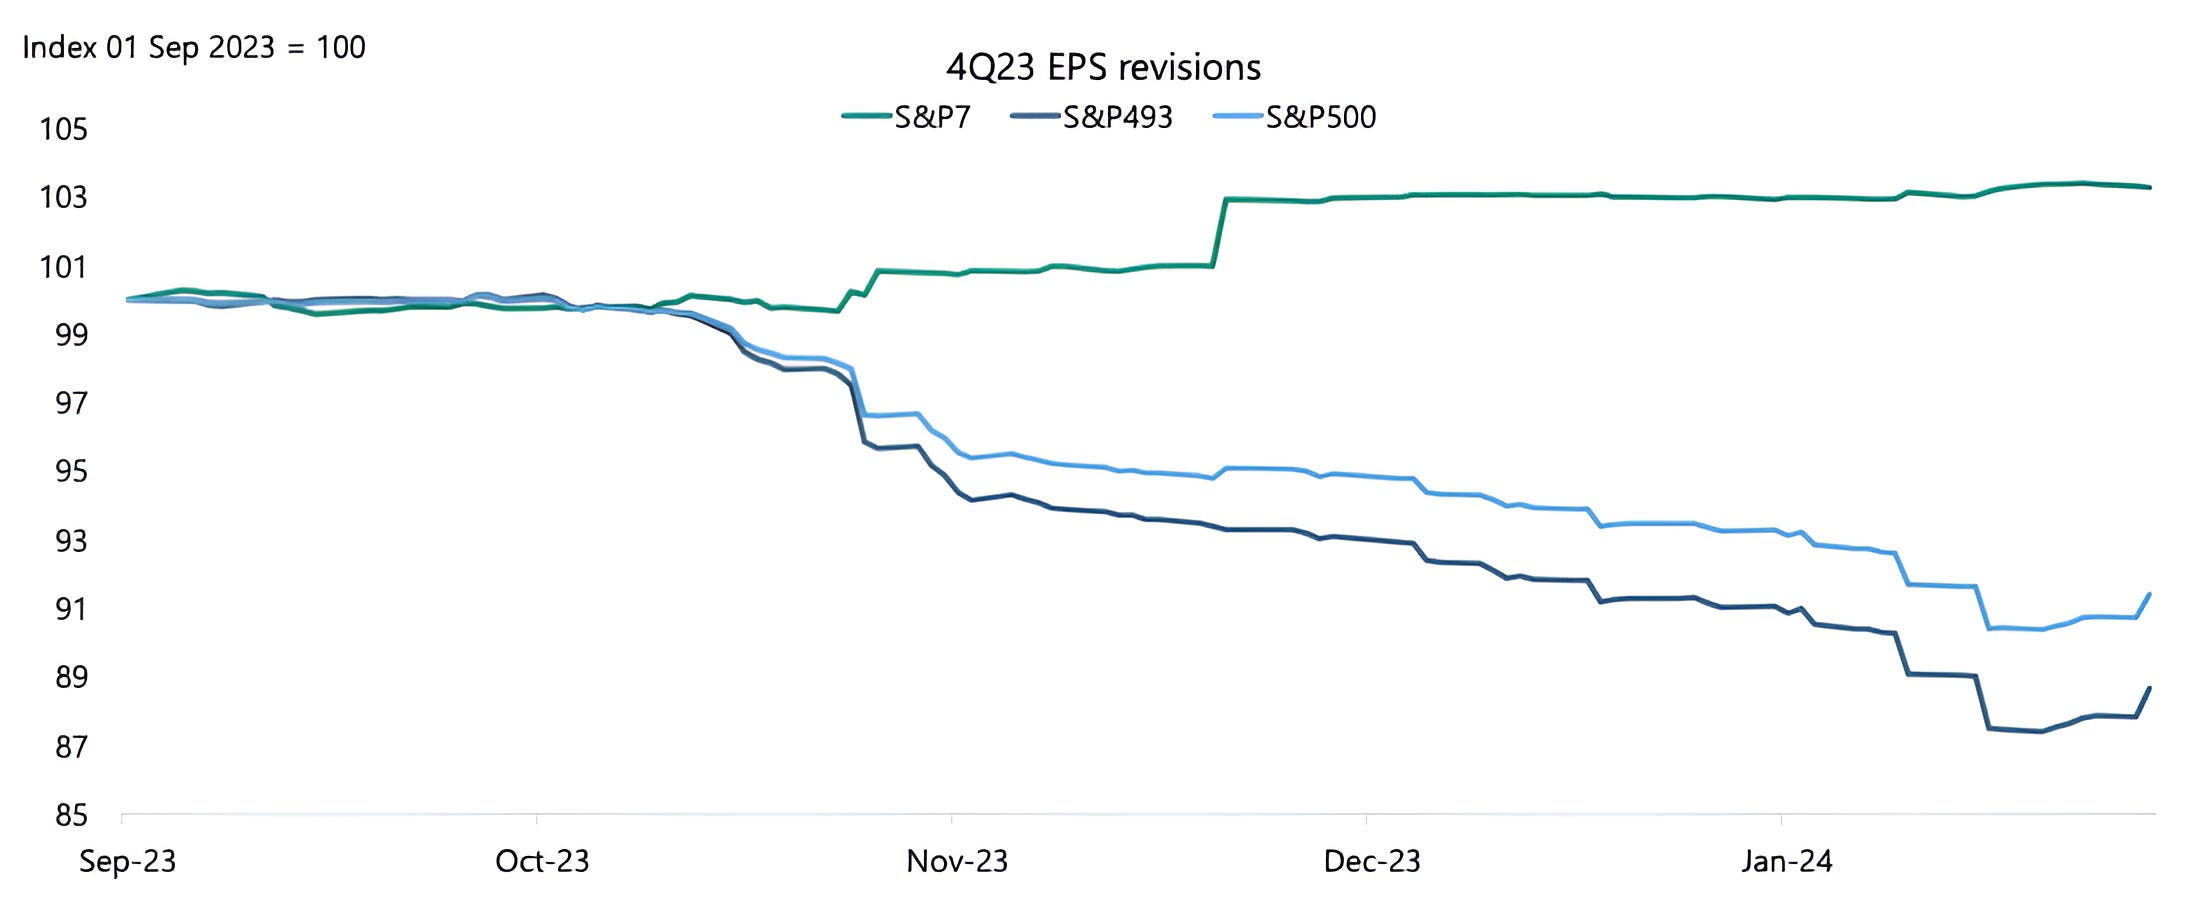
The chart below shows the evolution of Q4 2023 earnings expectations for the Magnificent 7, the other 493 and the S&P 500 as a whole.
What this essentially shows is that if it weren’t for the Magnificent 7, earnings expectations for the quarter would be down nearly 10% from the initial guidance.
In fact, Q4 S&P 500 earnings growth would likely have been negative without the contribution of the Magnificent 7.
That said, I don’t like to strip out the best or worst of anything and draw conclusions - all I am saying here is that the earnings story has been dependent on 7 stocks.
As a result, earnings growth and expectations from the Magnificent 7 need to be sustained or earnings from the other companies need to improve.
If not, it will be a challenging corporate earnings backdrop and potentially a difficult market environment.
(Past performance is not indicative of future results)
Source: Apollo, FactSet. Through year-to-date 2024.
3. Valuation is Stretched
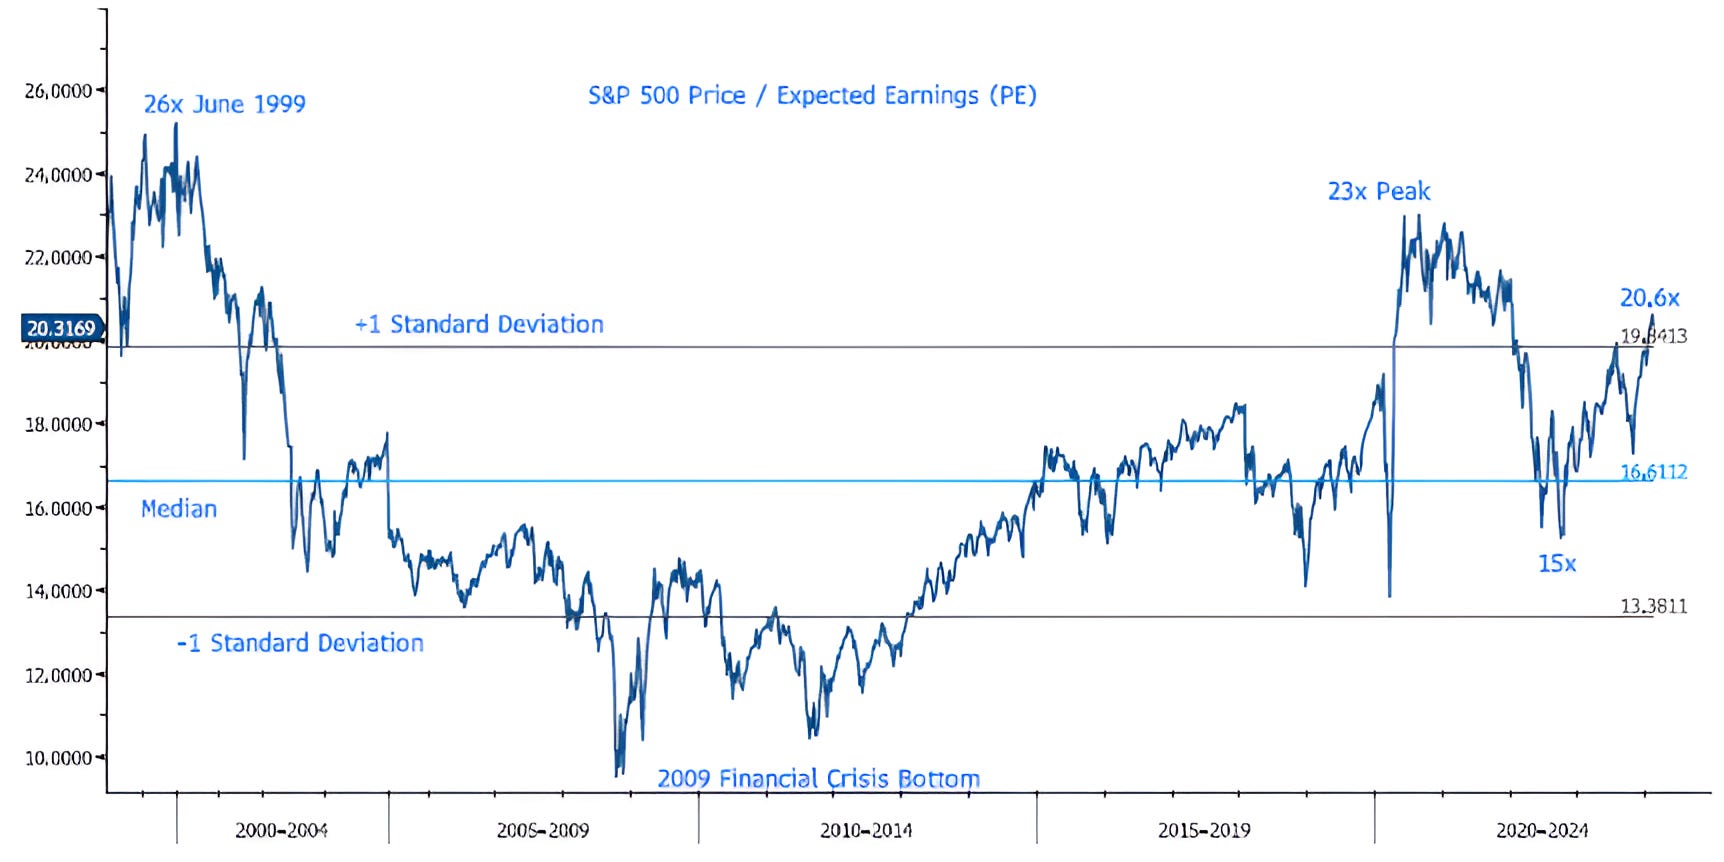
Below is a chart of S&P 500 price to expected earnings.
While valuation is stretched and is greater than 1 standard deviation above the long-term median, we do not view valuation as a catalyst.
What this means is that an expensive market will not go down simply because it’s expensive, and a cheap market will not go up simply because it’s cheap. (Past performance is not indicative of future results).
In September 2000 ( the beginning of the big dot-com decline, but not the peak) earnings and expectations began to disappoint and that was the negative catalyst.
Conversely, in March 2009 (the Financial Crisis bottom), investors began to identify “green shoots” in the economy that, aided by extreme monetary policy, reflected the potential for a significant earning recovery.
In January 2022, Fed tightening and higher 10-Year yields were the catalysts that led to a multiple contraction (see chart below).
What the elevated multiple does say to us is that further multiple expansion may be challenging and future growth in the index will likely need to be driven by earnings.
Source: Bloomberg. Through year-to-date 2024.
4. 10-Year Yields
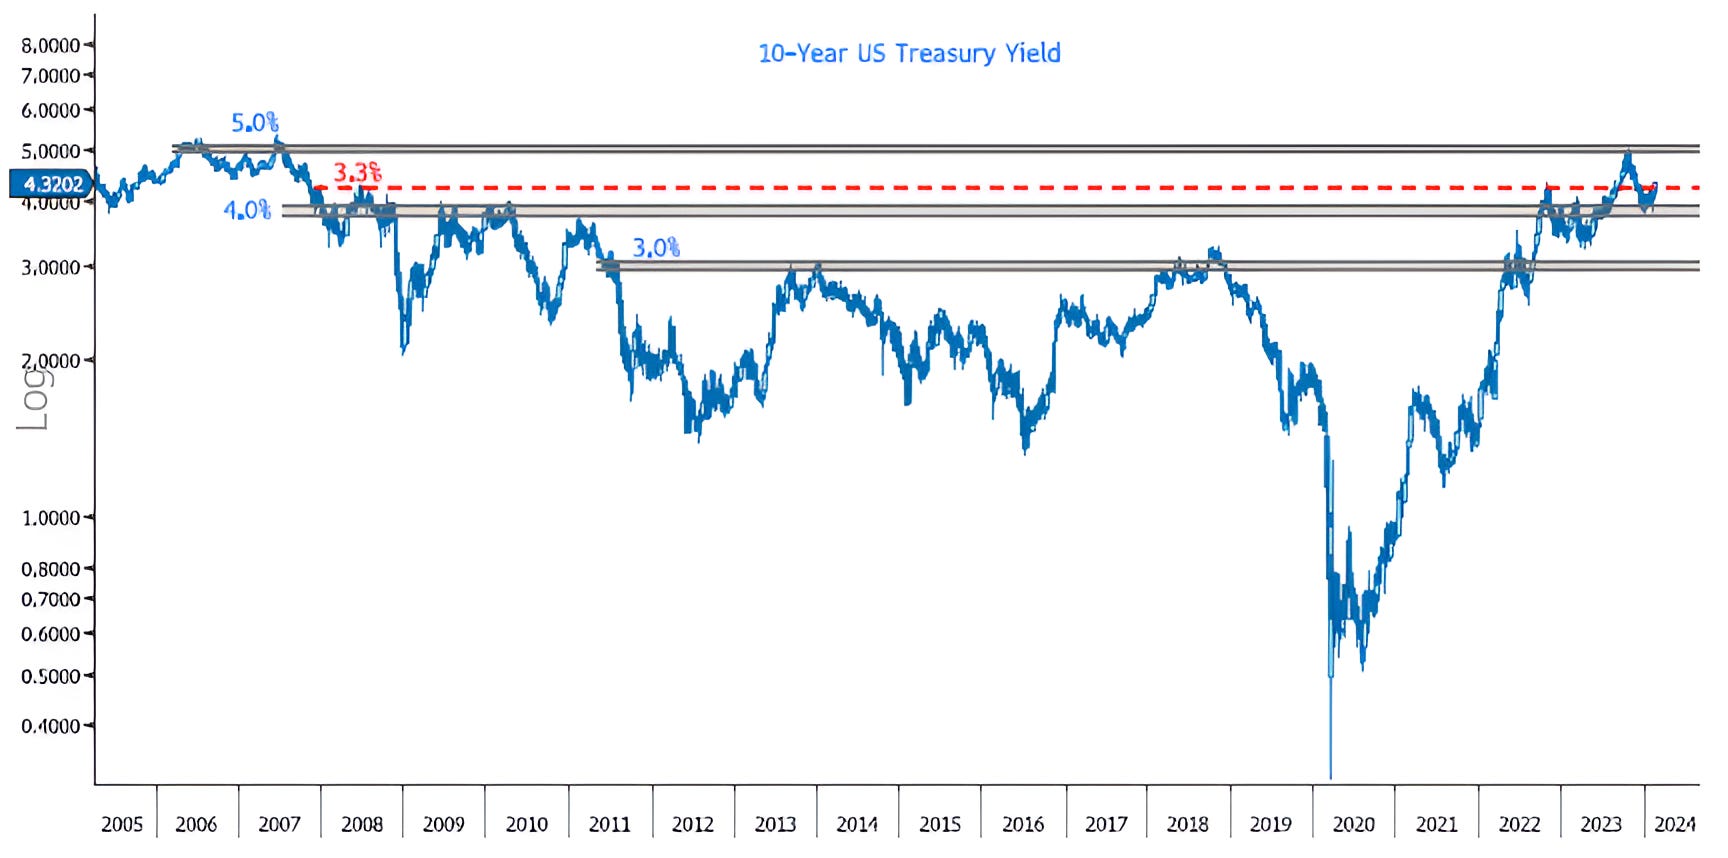
We recently showed 10-Year Yields here.
At the time, we wrote, “In our view, a break above the 4.2% and perhaps, more importantly the 4.3% barrier (this has been a critical long-term level) could re-open the door to 5.0% yields.”
With this mornings inflation report, 10-Year US Treasury yields closed at 4.32%.
Below, is a 20-year chart that may provide (chart) context into what we are seeing and thinking.
While the 10-Year US Treasury yield is above our “magical” 4.3% level, we want to see the reaction from here.
Will it drop back below, will it continue to trend higher?
This is why we often write significantly or meaningfully above or below key levels. Markets love to do a “fake” break.
In any event, Treasuries and Fed expectations seem to be moving in the direction that we highlighted here.
If 10-Year Yields continue to push higher, they may will likely put pressure on equity valuations. (Past performance is not indicative of future results).
Source: Bloomberg. Through year-to-date 2024.
5. Thinking About Inflation…
Obviously, this morning’s 3.1% CPI (inflation) print was higher than expectations (2.9%); while many have highlighted the lag in rents in the inflation data, I have continued to consider potentially inflationary elements.
Below is a chart of the average price of unleaded gasoline in the US.
While this may be a small component of the overall CPI and it is down significantly over the past 6 months, if gas price continues to increase:
Consumers will notice (we will see it in survey data) and
It will be difficult for the Fed to cut rates (by the way the first cut is now expected in June or July, rather than in March as was expected 5-weeks ago).
We will continue to dig into the inflation data…
