


Are You Experienced?
In 2024, the US equity markets have faced a perfect storm of negative catalysts, but have ignored them. However, the character "under the surface" seems to have changed today. Let's dig in...
If you had provided us with a bear-market catalyst checklist for 2024, it would have included higher than expected inflation; 10-Year US Treasury Yields above 4.5%; stronger US dollar; Hawkish Fed; and rising Middle East tensions.
Despite all of these factors being prevalent, through the end of last week, the S&P 500 has rallied over 7% through the first 3.5 months of the year and was only 2.5% from its all-time high - hardly a correction.
With this morning’s positive open, we questioned, as we did on Friday, whether we needed to respect the price action when the market didn’t behave as we would have expected given the circumstance.
That said, through our work, we have identified (and highlighted) soft spots in the market, that in our view, made it vulnerable.
Small Caps (the Russell 2000) closed on Friday slightly negative for the year.
The Equal Weight S&P 500 has fallen below what we viewed as important levels (chart 3 below - a follow up from last week).
Other inter-market relationships that we follow continued to reflect increasing market vulnerability to a correction.
However, since last October (the beginning of the most recent S&P 500 rally), we have seen the market rally in the face of conditions that seemed suitable for a sell-off.
As we show below, there are some characteristics today that are different those over the past 6 months.
1. The S&P 500 Falling through Its 50-Day Moving Average

Source: TradingView. Through year-to-date 2024.
Today, with the 1% sell-off in the S&P 500 (chart above) and 1.65% sell-off in the Nasdaq 100 (chart last Friday), both indexes have dropped below their respective 50-day moving averages for the first time since their lift-offs from their October 2023 lows.
Looking closely at the chart above (or the chart on Friday), you can see that, even during the late December / early January volatility, neither the S&P 500 nor the Nasdaq 100 even reunited with their respective 50-day moving averages.
What this says to us is that the character of the current sell-off is different than anything we have seen since the 10% correction from last July through October.
While this does not necessarily mean another 10% correction is on its way, it likely says that today’s drop wasn’t the bottom.
We believe that the first critical level under the 50-day moving average is 4966 on the S&P 500. This is the 23.6% retracement of the October to April 1 rally.
However, in our view, the level that is the most critical is 4800 - the January 2022 high.
(This is not a recommendation to buy or sell any security and is not investment advice).
2. Another Differentiating Factor
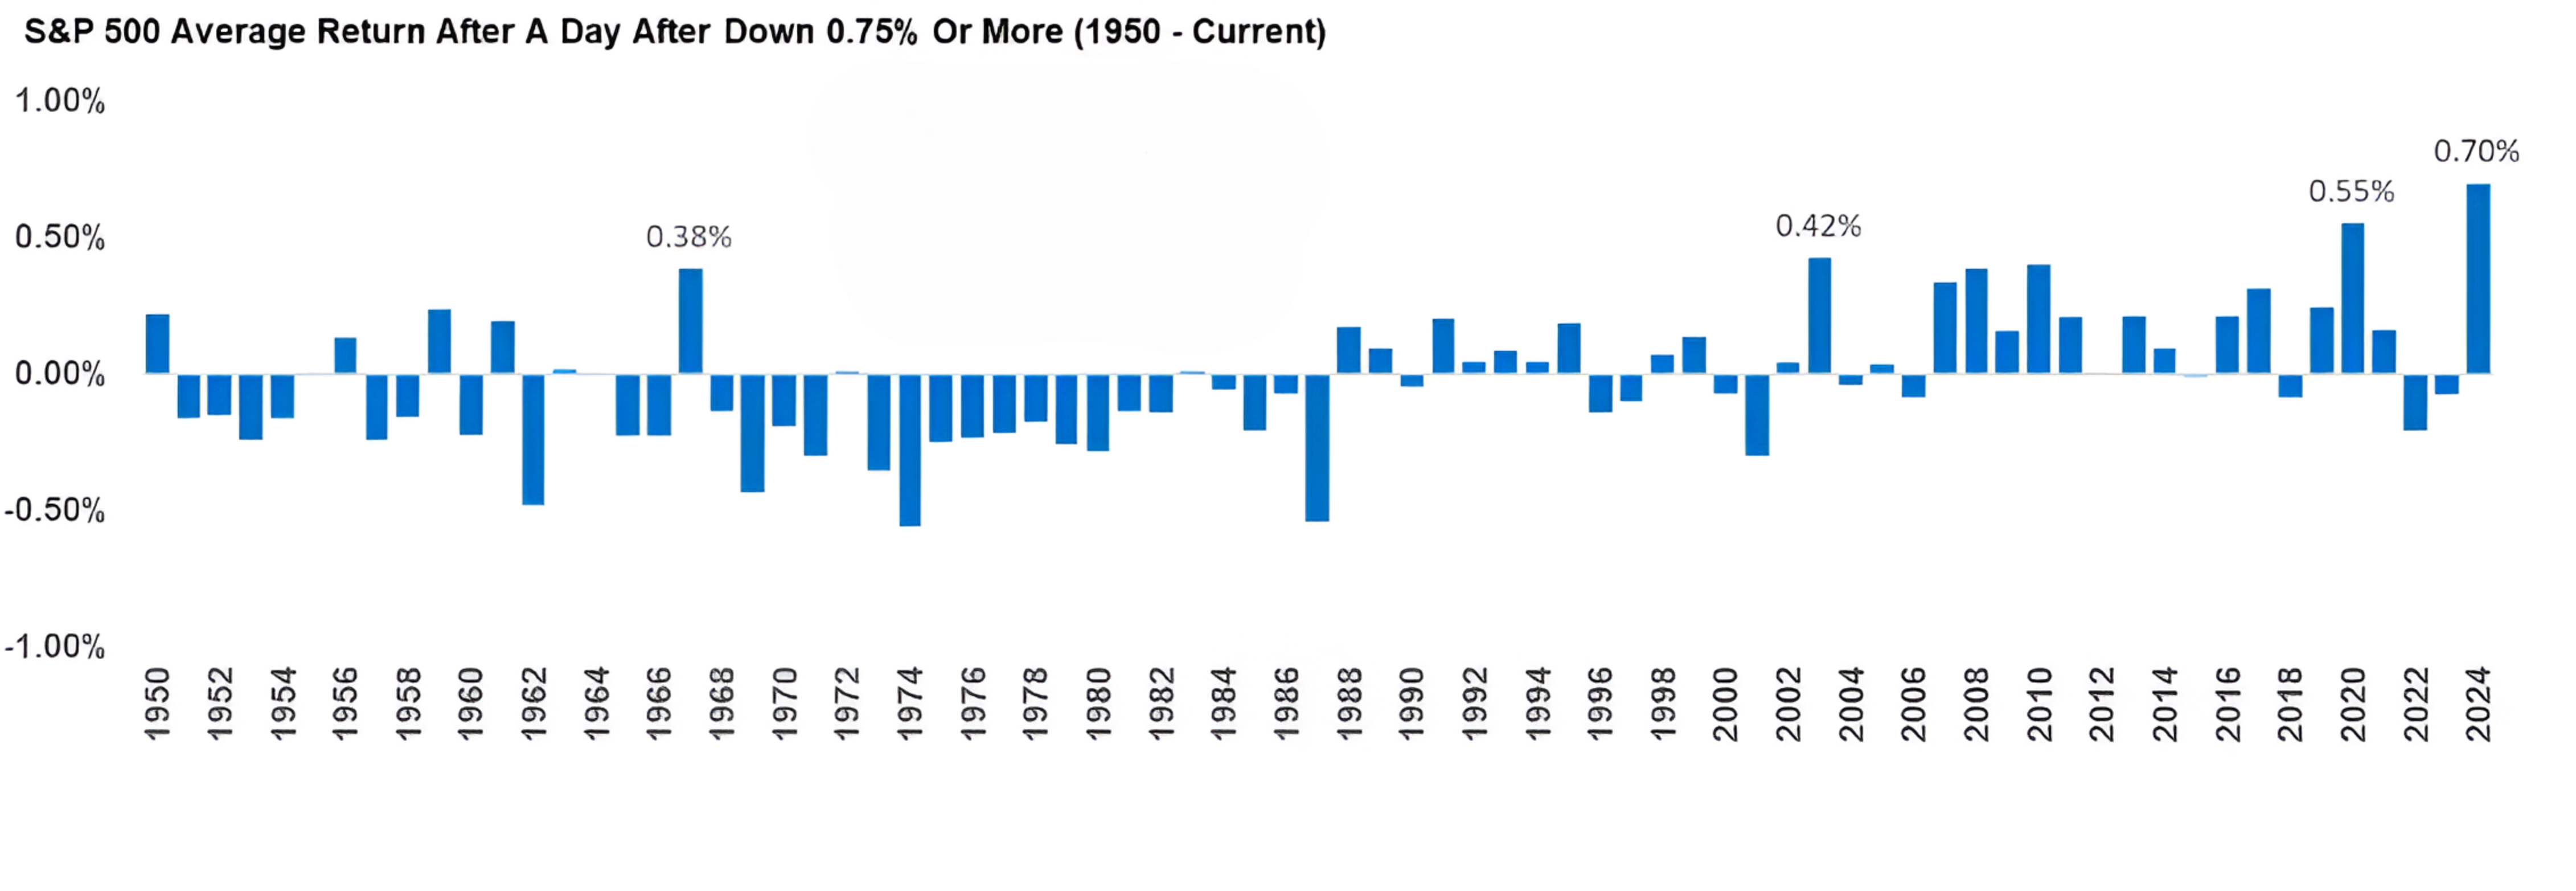
Source: Carson Investment Research. Through April 10, 2024.
The chart above shows the S&P 500 Average Daily Return After a Down Day of 0.75% or more from 1950.
On average, during 2024, after a down day of 0.75% or greater the S&P 500 has been up 0.70% and has nearly recaptured all of the previous days losses.
Up to today, the S&P 500 during 2024 has exhibited the greatest bounce back after large negative days since 1950.
After dropping 1.5%, the S&P 500 was down another 1.2% today.
(A fun fact to know and share: this was just the 86th time since the 5-day trading week began in late 1952 that the S&P 500 fell 1%+ on Friday and 1%+ on the following Monday).
This is clearly different than the character of the index to this point in the year.
(This is not a recommendation to buy or sell any security).
3. Some Good News in the Equal Weight S&P 500?

Source: TradingView. Through year-to-date 2024.
When we showed the Equal Weight S&P 500 last week (here) and presented the $160.50 target that the Index hit today, we did not expect the price to deteriorate this rapidly.
In our view, this is a reflection of a number of market participants with low levels of conviction.
These are often referred to as “weak hands.”
In other words, these are not long-term owners that will hold stock through thick and thin, they are “renters.”
Unfortunately, as can be seen above, an equity market built on “renters” does not have a strong foundation.
The 2-day drop between Friday and today, has moved the Equal Weight S&P 500 back below its January 2022 high and there may be work to do to recapture the north.
That’s the bad news.
The good news is that the Equal Weight S&P 500 hit our target and held. Where it goes from here, in our view, is critical.
Can it remain above $160.50 or will it move back down to its December / January congestion zone between $155.50 and $158.50.
Along with the other indicators that we consistently show, we view the Equal Weight S&P 500 as a key equity market barometer.
(Past performance is not indicative of future results and is not investment advice).
4. Earnings this Week…

Source: Savvy Trader. Through year-to-date 2024.
While this week is moderate in terms of the number of companies reporting earnings, there are a few names we see as “tone setters”, both in terms of their results as well as their share price reaction to the announcements (these two can vary).
Specifically, we are watching ASML on Wednesday morning and Taiwan Semiconductor on Thursday for a read on Semiconductors and AI.
ASML, is a $400 billion market cap company, that is the sole supplier of extreme ultraviolet lithography (EUV) photolithography machines that are required to manufacture the most advanced semiconductors.
Taiwan Semiconductor operates semiconductor manufacturing facilities (fabs).
The results of these two will provide an early read on the upcoming semiconductor earnings. The reactions to the results will be an indication of what’s “priced in” and “whisper numbers” within the sector.
We will also be watching Netflix after the close on Thursday.
While it doesn’t set the tone for the overall market like it once did, we always want to follow the earnings and market reaction to the reports of the original FAANG names (Facebook, Amazon, Apple, Netflix and Google).
Finally, on Friday morning, we are watching Schlumberger, the largest oil services company.
As Energy has been one of the best performing sectors over the past month, we want to hear the results and insights from one of the industry leaders.
(This is not a recommendation to buy or sell any security)
5. I’m Not Saying This Will Happen, But It Could

Source: TradingView. Through year-to-date 2024.
I have not been following Brazilian politics, monetary policy or economics lately and, even in the best of times, I am far from an expert.
With that in mind, I am presenting simply what I see in the Brazilian Real / US dollar cross.
If the Real weakens back above 5.50, the chart suggests risk up to 6.50 or 7.00.
I don’t know why this would happen - I am simply suggesting it could.
(This is not a investment advice and is not recommendation to buy or sell any security).