


A Rush and a Push and the Land is Ours
Despite selling off yesterday after the elevated CPI number equities recovered today based on a lower Producer Price Index. With this fragile set-up, earnings season starts tomorrow. Let's dig in...
Introduction:
While I have expressed tactical caution and referred to the market as fragile, I wanted to make a quick point about two words I have not heard often this year.
Recession - a year ago, we were (myself included) giving a well-above average to a recession. As equity investors, there are often corrections and intra-year drawdowns, they come with the territory, but recessions are the real risk.
Simply stated, there does not seem to be a recession on the near-term horizon. As a result, while there may be an equity market correction, our current perspective would be to view that opportunistically (buy lower).
Valuation - I have said to many of you, at different times, valuation doesn’t matter.
I never consider valuation as a catalyst, but rather a measure of risk. This is why I have characterized the current market as fragile.
Currently, the S&P 500 is trading 21x forward earnings - well above the 20-year average of 16.5x. Could the market trade at 18x and still be at a premium, yes. But that would represent a 10-15% drop. Would it be a normal correction - yes, but it would still be somewhat painful for most.
With 10-year yields moving above 4.5% and inflation ticking higher, we need to be aware of valuation.
That said, I was at an investment conference this week and while there was talk about the Fed, inflation, 10-Year yields, AI and cyclicals, there was little talk about valuation.
Finally, based on feedback from my son, we are going to start presenting the charts above the text. It is Charting Alpha after all…
Please let me know if you prefer it like this. If you do - full credit to him; if you prefer the old way - I take full responsibility for the new format.
1. “Before the year is out there’ll be a rate cut.” President Biden, April 10, 2024

Source: Apollo Chief Economist / Bloomberg. Through year-to-date 2024.
The chart above shows the “Supercore” measure of the US Consumer Price Index (CPI) that was released yesterday. This is apparently, the Feds preferred measure.
In general, yesterday’s US inflation data was 1) higher than expectations, 2) above the Fed’s 2% target level, and 3) reflected recent acceleration higher.
The headline CPI (including everything) was:
1 month: 4.8% (annualized)
3 months: 4.6% (annualized)
12 months: 3.5%
When the January inflation figure came out higher than expected, some economists called it “transitory.” (I’m looking at you Paul Krugman).
We now have 3-consecutive months of higher than expected CPI and on a 1- month and 3-month annualized pace above 4.5%.
I have reviewed core measures (ex-food and energy), super-core (core minus shelter - chart above) and trimmed mean (excluding the highest and lowest measures).
No measure of inflation is coming down and none seem to be in the range that the Fed has highlighted as its target.
Q1 GDP (chart 2) is on pace for 2.0-2.5%; unemployment (last Friday) is 3.8% which is historically low; and the S&P 500 closed last month at an all-time high.
Taken in a vacuum - without politics or forward guidance from the Fed - these conditions would call for a rate hike (see here, here, and in “What’s New Zealand Got to Do, Go to Do With It” - chart 3 here).
(As a an aside, this is not political as President Trump also called on the Fed to cut rates at a time when some believed a hike was warranted).
All of that said, as we have written in the past, there is the consideration of what the Fed should do (in our view tighten) and what the Fed likely will do (ease either through the balance sheet, Fed funds or both).
Why do we believe the Fed will ease?
We continue to comeback to our theme of Fiscal Dominance - the idea that the US has so much debt outstanding (which it is adding to aggressively by continuing to spend) that it must have lower rates at which to borrow.
(This is not a recommendation to buy or sell any security and is not investment advice).
2. 10-Year Yields: At Some Point, This Will Matter

Source: TradingView. Through year-to-date 2024.
We most recently showed 10-Year Treasury Yields here as they were moving up to the 4.34% level.
Before that we showed them here when 10-Year Yields were at the bottom of the furthest right arc we had drawn in. (The right shoulder of a potential head and shoulders bottom).
At the time, we called 10-Year Yields an inflation barometer.
With yesterday’s inflation report, 10-Year Yields breached the “neckline” of the reverse head and shoulders (3 arc formation) and seem to be on their way towards our 4.65% target level.
We continue to show this chart as we believe it is one of the most important for global markets overall and US equities specifically.
In our introduction, we highlighted that currently few seem focused on valuation.
Typically, higher 10-Year Treasury yields are negatively correlated with equity valuations for 2 specific reasons:
In a discounted cash flow valuation model, 10-Year US Treasury yields are often used as the “risk free rate” to “discount” future cash flows.
While we will not go into the calculation, higher 10-Year Yields, all else equal, leads to lower discounted cash flow valuations (at least on paper). Lower valuations are often expressed in equity markets through PE multiple contraction.
In an “equity risk premium” analysis, we compare the equity yield (the inverse of the PE ratio —> a PE of 20 = 1/20 = 5%; whereas a PE of 10 = 1/10 = 10%) with the Treasury Yield.
The concept is that equity investors should receive some premium for taking equity “risk.”
During the late 1990s, the Equity Risk Premium was negative (the earnings yield on equities was lower than the 10-Year Treasury yield). Alan Greenspan (in 1996) referred to this as irrational exuberance.
The current forward PE of the S&P 500 is 21.3x. The current earnings yield (1/21.3) is 4.7%. With the 10-Year Yield at 4.5%, Equity Investors are receiving 0.2% to take equity risk. Historically, this is low and below the long-term average.
Whereas PE levels are an absolute valuation measure, equity risk premium is a relative valuation metric - are equities expensive relative to the (less risky) fixed income? Currently, they are expensive.
In our view, at some point elevated and rising 10-Year US Treasury yields will will matter to equities like they did from August to October last year and at other points in the past.
One last point on the chart.
Sometimes “head and shoulders” patterns are not “confirmed”. They move back to the “neckline” and keep going. Failed “head and shoulders” reversals can be dramatic - we saw one on the left side of the 10-Year US Treasury chart and wanted to note it.
(This is not a recommendation to buy or sell any security).
3. The “Average” Stock: Bounce or Collapse

Source: TradingView. Through year-to-date 2024.
As we’ve noted recently, several of the indexes, sectors and relationships that we follow are at critical levels.
The Equal Weight S&P 500 (above), which we view as a reflection of performance of the “average” S&P 500 stock, is back down to its January 2022 (prior) all-time high.
We have drawn in a potential “head and shoulders” formation.
We would note that the right shoulder may not be fully formed.
In other words, if the Equal Weight S&P 500 were to bounce from current levels, we may view less as a “failed head and shoulders” (that we showed in the 10-Year US Treasury chart above) and more as the possibility of the right shoulder fully forming.
One of the major differences between the US equity market in 2024 vs. 2023 is that this year has been characterized by broader participation as the market has appreciated. This is captured in the significant move higher of the Equal Weight S&P 500 / “Average Stock” from January 19 to April 1.
2023 was historically “narrow” as the upside was primarily driven by the “Magnificent 7.”
With earnings season coming and the “Average stock” sitting on a fragile ledge, if the Equal Weight S&P 500 were to fall from here, it would represent a reversal of the participation that we’ve seen in 2024.
This reversal might have a more significant impact on the (traditional) S&P 500 than the underperformance of the Average Stock did in 2023.
(This is not a recommendation to buy or sell any security and is not investment advice).
4. It’s Not Just Gold, Check Out Silver…
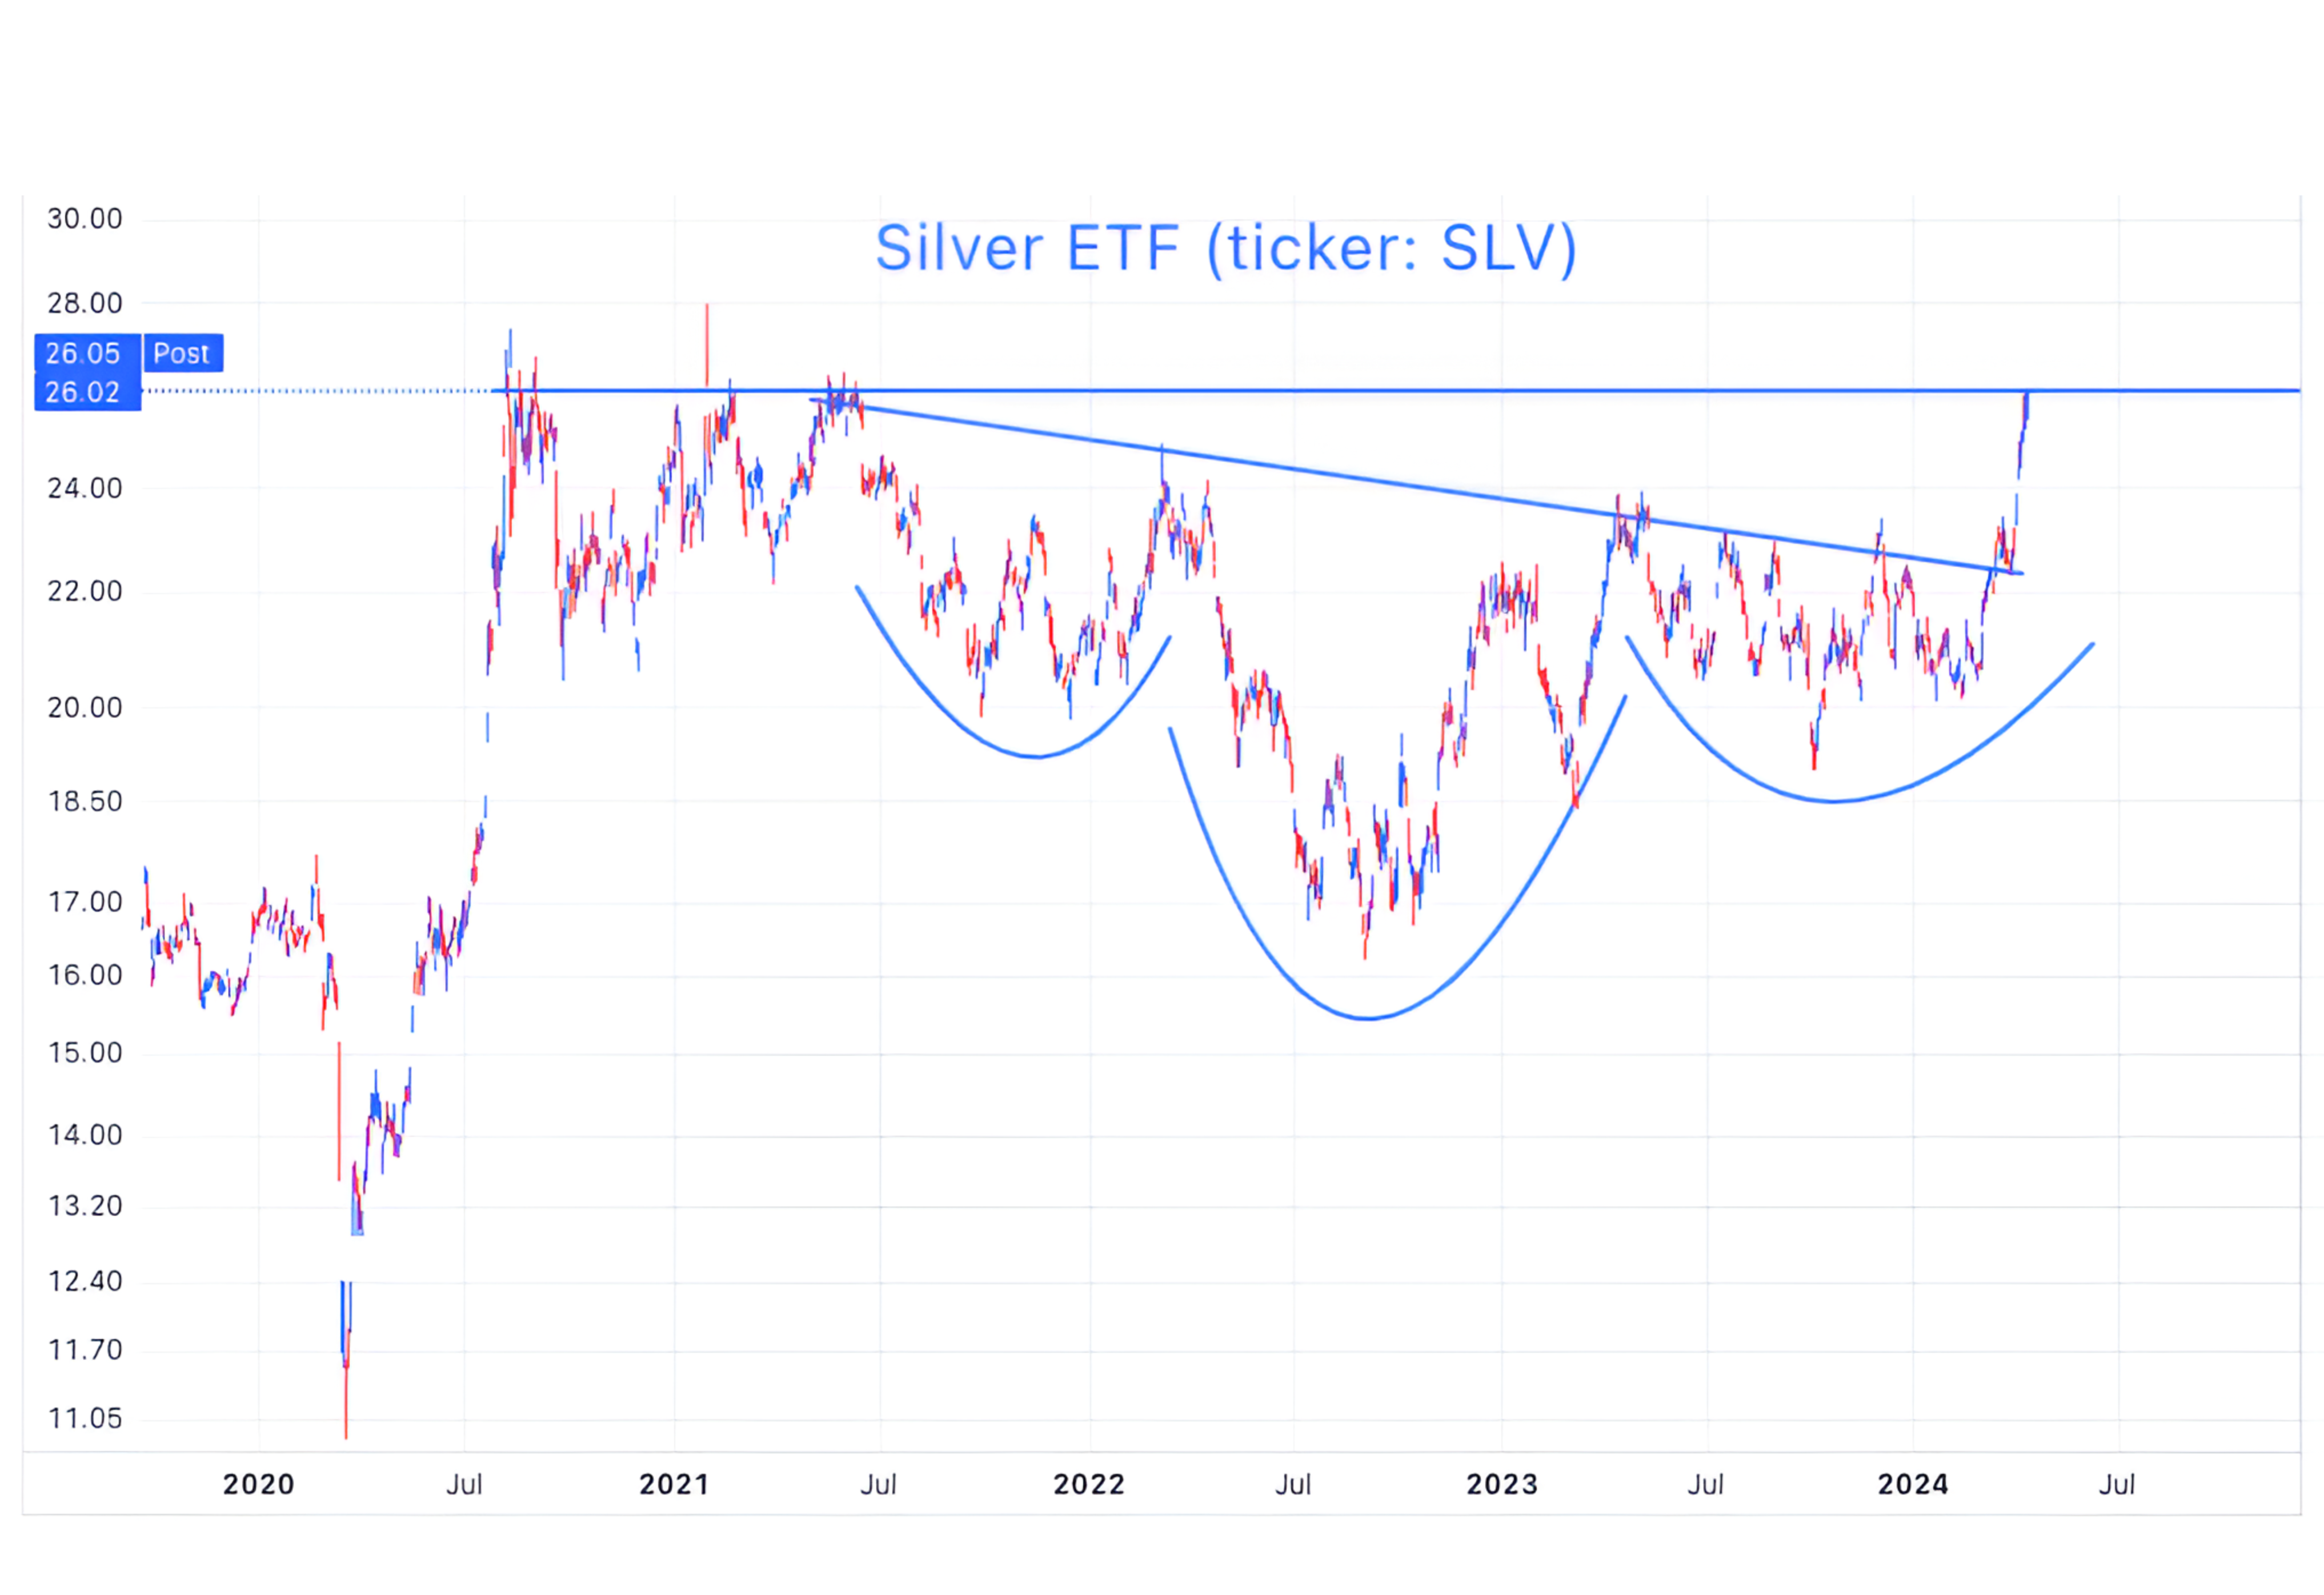
Source: TradingView. Through year-to-date 2024.
After its recent run higher into its 2020/2021 highs, Silver looks like it could pause at current levels.
However, longer-term, we might add Silver to the list of materials that may be appropriate in some broad allocations. (We have shown Gold, Copper, Uranium, Oil, Commodities in general and now Silver).
Gold and Silver have historically been coupled as the two most significant (not sure the right word) precious metals. While they don’t necessarily travel in tandem, higher Gold prices, have often been a pre-cursor to higher Silver prices.
Unlike Gold, however, Silver is not just a precious metal, it has meaningful industrial use.
Because of its conductivity, Silver is a critical component in solar photovoltaic cells. In other words, Silver is a key resource in the green energy revolution.
We think the combination of investor appetite for commodities in general, precious metals and silvers industrial use, could push prices higher.
(This is not a recommendation to buy or sell any security)
5. Dollar / Yen Again…

Source: TradingView. Through year-to-date 2024.
Yen just hit a new low of 153 today vs. the US dollar.
Why is this important?
We wrote a positive take on Yen weakness here and cited the “carry trade” and global liquidity as tailwinds for equities.
However, as the Yen continues to weaken, there is another (possibly more negative) consideration:
At some point the Bank of Japan might suggest that they want a stronger currency…
Why would they want that?
Unlike the US and other resource rich countries, Japan imports oil and other commodities many of which are priced in dollars. (In general, Japan imports resources and exports finished goods).
The recent moves higher in commodities prices are compounded for Japanese industries as the Yen weakens.
(As an aside, just over a year ago, Japan, with the Yen around 130, re-emphasized nuclear as a power source - this is consistent with our Uranium thesis that we highlighted on Monday here).
What could the Japanese do to “defend” or strengthen their currency?
Japan holds $1.14 trillion of US Treasuries and is the largest non-US holder of US debt. (Larger than China which has $816 billion in Treasuries).
Japan could sell some Treasuries (priced in US dollars) and buy Yen.
While this could strengthen the Yen and make resource imports less expensive (in Yen terms) for the Japanese, it might put upward pressure on Treasury yields.
Something to consider…
(This is not a investment advice and is not recommendation to buy or sell any security).