Running to Stand Still
Since February, there's been a tone change in markets. Is it a rotation, a correction, or election year seasonality? While we don't know the answer, it's important to ask the question. Let's dig in...
1. A Pause or Something More Significant?
The chart below shows the Equal Weight Nasdaq 100.
Unlike the market cap weighted Nasdaq 100 that is dominated by the Magnificent 7 (greater than 40% weight), each share in the Equal Weight Nasdaq 100 represents 1% of the index.
The Equal Weight Nasdaq 100 is back down to its late 2021 high (top blue line), a level it surpassed in mid-February.
In general, the Equal Weight Nasdaq 100 seems tired after its 26%, 4- month move higher from late October to February.
Is this simply a pause to regain strength or will it turn into more of a correction?
Last Thursday, we showed a comparison between the market-cap weighted (traditional) S&P 500 and the Equal Weight S&P 500 (here).
That relationship peaked in mid-February as the Equal Weight S&P 500 has recently been outperforming.
Last Wednesday, we showed Growth vs. Value (here). That relationship also peaked in mid-February.
Looking at the chart below and considering the relationships of the Equal Weight S&P 500 to the (market-cap weighted) S&P 500 and Growth vs. Value - I am wondering: have the past 6 weeks have simply been a pause from a market and sectors that are fatigued or if there a more significant sector rotation or trend change that should be acknowledged?
(This is not a recommendation to buy or sell any security and is not investment advice.)

Source: TradingView. Through year-to-date 2024.
2. The Set Up Going into US Earnings Season
Friday is the official start of Q1 US earnings season.
While it is almost a tradition for US companies to exceed quarterly earnings estimates, guidance into earnings can vary.
112 S&P 500 companies have issued quarterly earnings guidance for Q1.
Of those, 79 have issued negative guidance (chart below) and 33 have issued positive guidance.
In addition to the ratio of negative to positive, being worse than the recent averages, the number of companies issuing negative earnings guidance ties the mark with Q2 2019 and Q1 2016 for the second-highest number of S&P 500 companies issuing negative earnings guidance for a quarter since FactSet began tracking this metric in 2006. The record-high number is 82, which occurred in Q1 2023.
Despite the high number of companies issuing negative guidance for Q1, the overall earnings estimate for the quarter only fell 2.7% while the earnings estimate for the year was reduced by only 0.4%.
While the market has been able to ignore lackluster earnings (2023 S&P 500 earnings growth was 1.5%) as future expectations have remained elevated, valuation levels are stretched and near-term projections (Q2), in our opinion, are demanding.
We will look at this more thoroughly tomorrow.
For now, we would say that a number of companies have once again lowered the bar and the likelihood is that they will exceed it.
(This is not a recommendation to buy or sell any security).

Source: FactSet. Through year-to-date 2024.
3. When Multiple Themes Collide - Uranium
We have tried to highlight “Where the Puck is Going” as a metaphor for investment themes that will be partially driven by AI but are not necessarily directly related to the technology sector.
One of the key considerations of AI is the power (electricity) demands of data-centers.
With that in mind, we were excited to read the article in Datacenter Dynamics (here) that Equinix, the largest global data center and colocation provider for enterprise network and cloud computing, had signed an agreement to procure 500 megawatts of nuclear power from Oklo, a Small Modular Reactor (SMR) firm.
While nuclear energy has been surrounded by debate, recently, there seems to be momentum behind the idea that it is a viable clean energy solution. (See here).
Furthermore, when we consider the implications of Fiscal Dominance, in our view, a range of commodities may be appropriate as a portfolio allocation.
The Global Uranium ETF (below) is back at its late 2021 highs. We will see if it can break above its ceiling level.
When three themes - green energy, AI and Fiscal Dominance meet a chart at a key level, we want to pay attention.
(This is not a recommendation to buy or sell any security and is not investment advice)

Source: TradingView. Through year-to-date 2024.
4. Global Equity Supply is Negative for the 3rd Straight Year
While many don’t view global equities through the lens of supply and demand, this basic rule of economics applies to public shares as much as it does to many other assets.
Global equity supply is now the most negative as it has been over the past 25 years.
In other words, initial and secondary public offering plus options issuance are being more than offset by share buybacks and other forms of share acquisitions (e.g. take privates).
Year to date, global public equity supply has declined by $120 billion.
This is three times higher than the $40 billion decline that occurred in 2023.
Furthermore, public equities are on track for a third straight year of declines for the first time in history.
All as Goldman Sachs expects stock buybacks to cross $1 trillion for the first time ever in 2025.
Given increasing demand for equities (investors chase performance), perhaps this is a partial explanation for what we have characterized as “the Everything Rally” despited elevated valuations and mixed fundamentals.
(This is not a recommendation to buy or sell any security)

Source: Financial Times. Through year-to-date 2024.
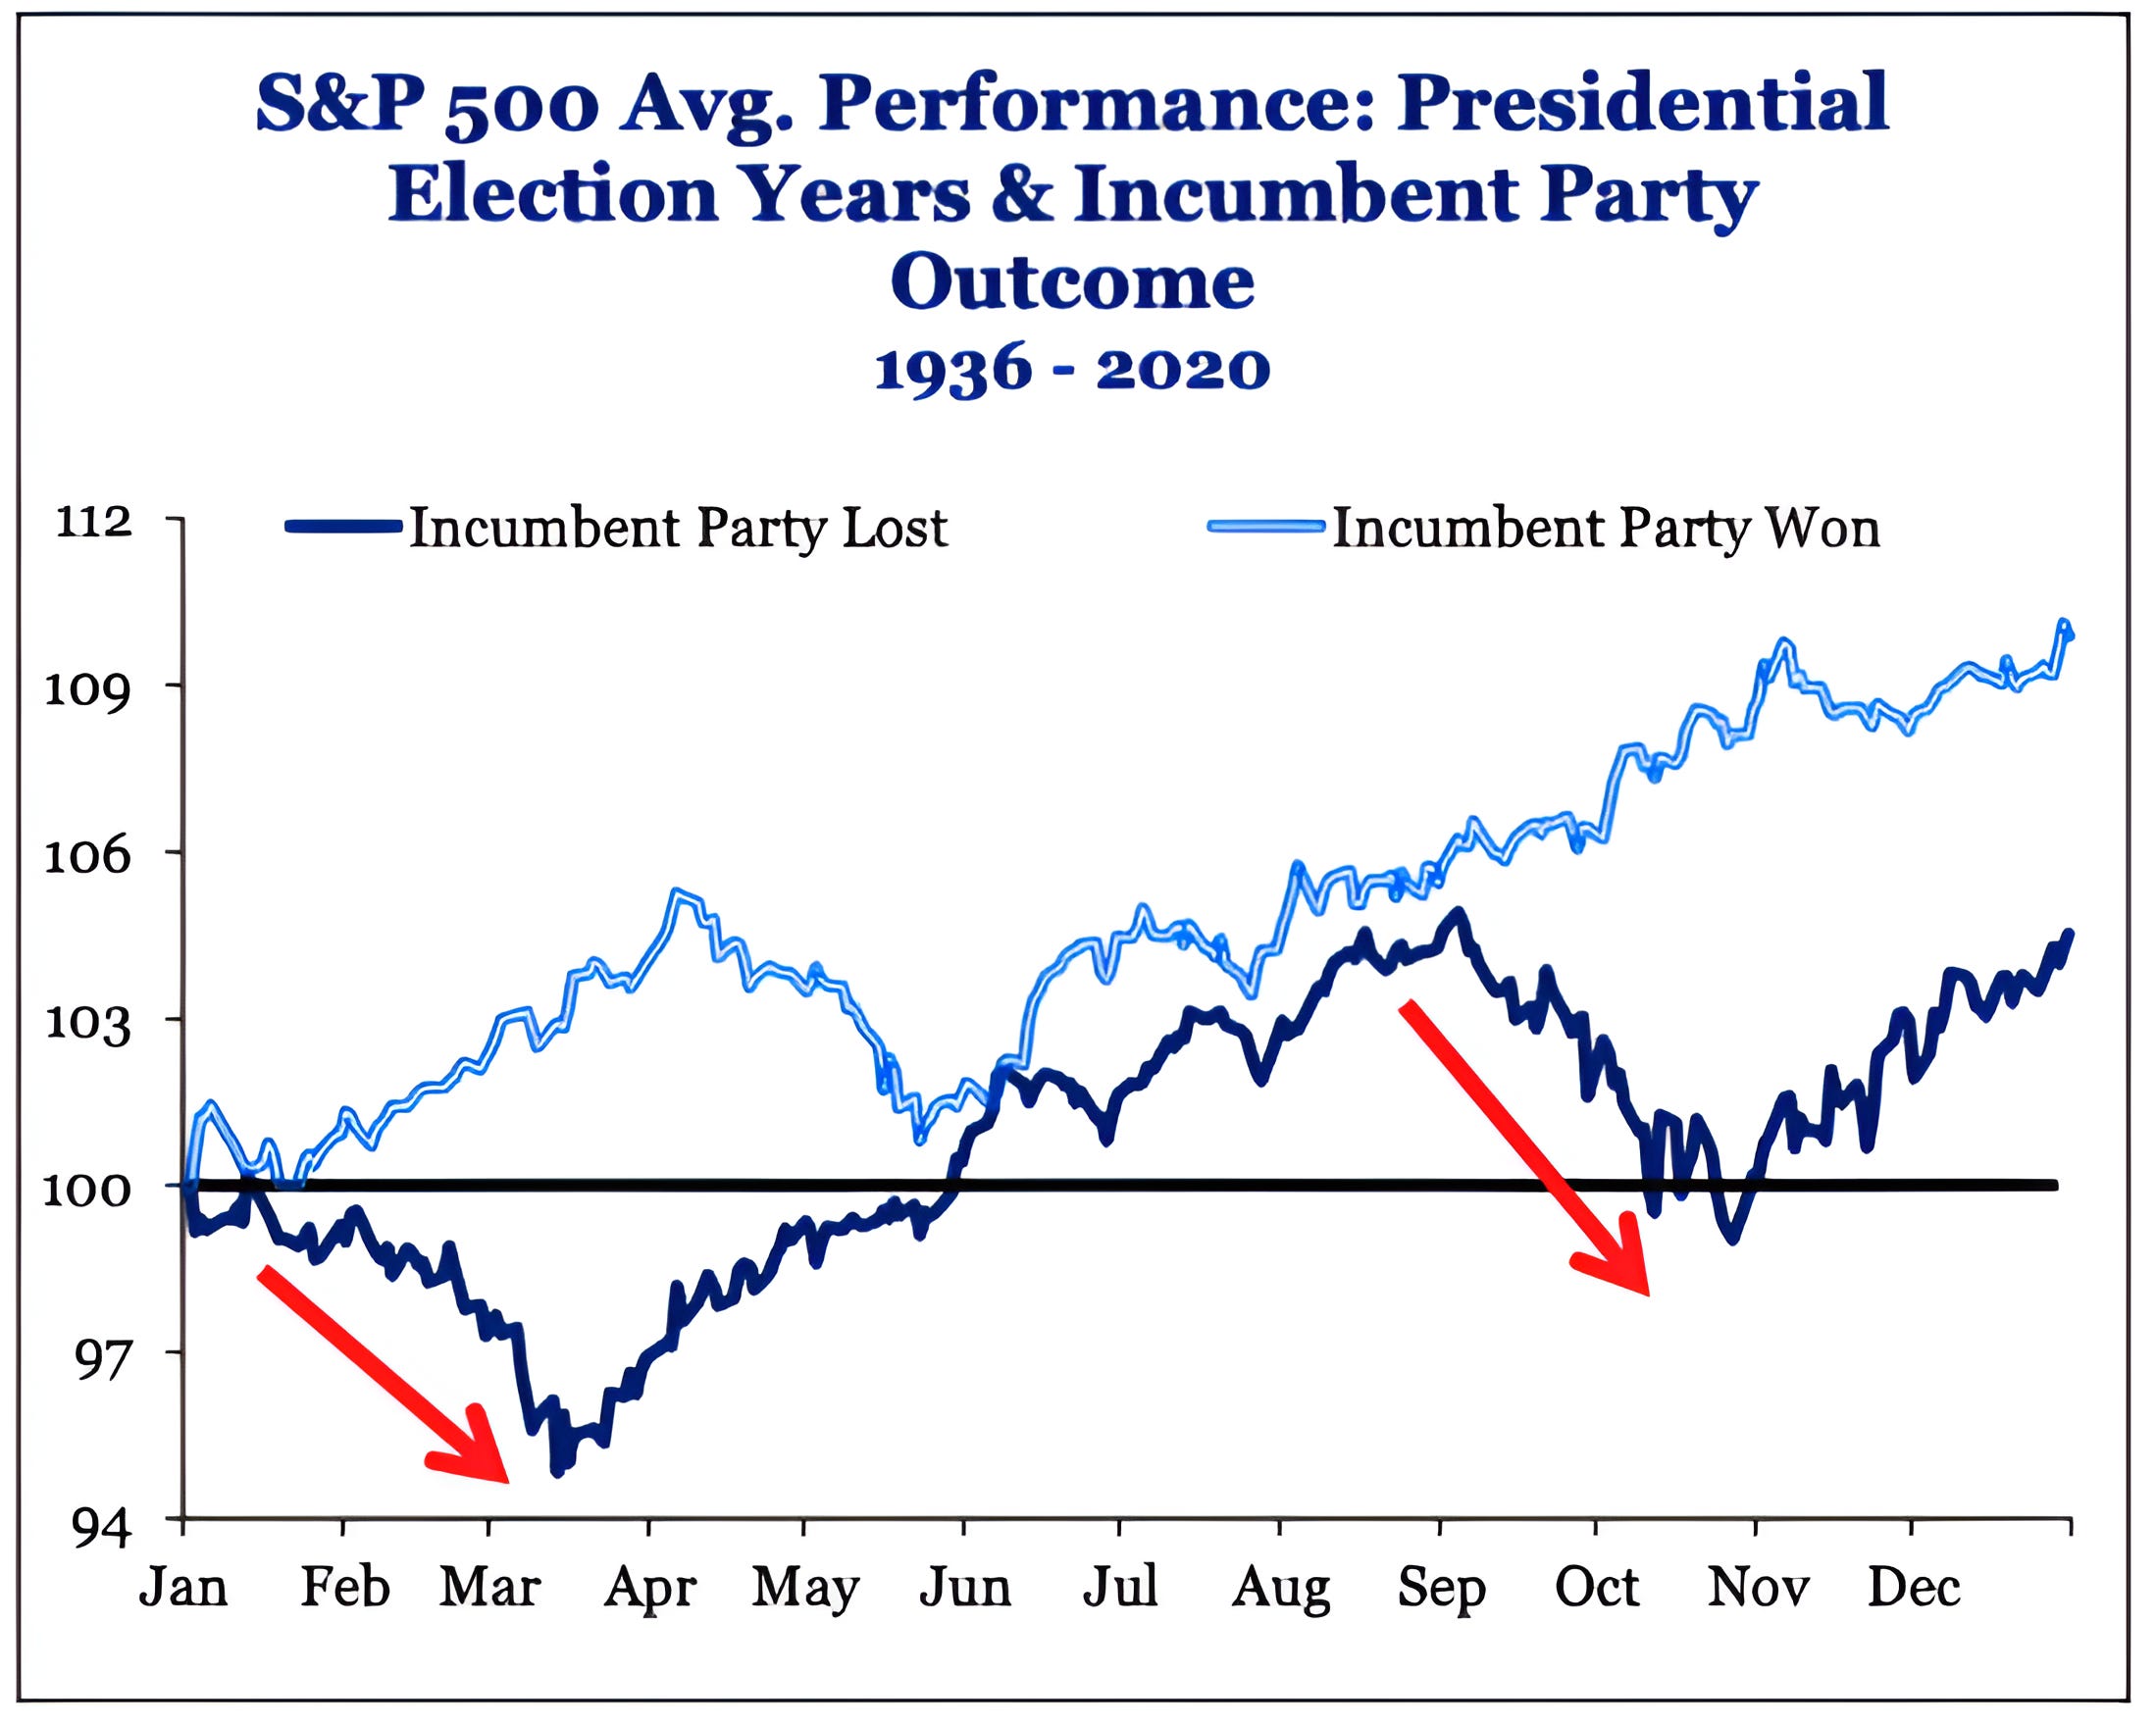
5. Another Look at US Election Year Seasonality
The chart below breaks down the election year equity cycle into those years in which the incumbent party has has won or lost.
We first showed this chart in mid-February (here).
At the time, it seemed like the S&P 500 could finish Q1 by moving in either direction.
We now know that during Q1 the S&P 500 was up over 10% and has looked much more like the performance in those election years when the incumbent party has won.
If the S&P 500 were to continue to follow the “Incumbent Party Won” seasonal pattern, we might begin to expect a correction.
(This is not a investment advice and is not recommendation to buy or sell any security).