You Spin me Right 'Round, Baby, Right 'Round!
With higher Treasury yields, a big payroll number on Friday and earnings season coming soon, the indexes are churning and the real action in equities is taking place under the surface. Let's dig in...
1. Growth vs. Value
On Monday, I posted the Q1 equal-weight sector returns of the Russell 1000 (here).
As we highlighted, Tech (on an equal-weighted basis) was an underperformer for the quarter while a number of more value-oriented sectors (Energy, Industrials, Financials and Staples) outperformed.
Below is a graph of the Russell 1000 Growth Index relative to the Russell 1000 Value Index.
(These are cap weighted indexes - Nvidia has a larger weight than Lululemon).
When the graph is moving higher, Growth is outperforming and when it’s moving lower, the opposite is true.
The first take-away is that Value has been outperforming since mid-February.
However, the Value outperformance comes after a 13-month epic run of Growth outperformance.
Value’s recent outperformance has brought the relationship right back to its 3.5 year ceiling (top horizontal light blue line).
Furthermore, the recent Value outperformance seems very normal within the context of the Growth outperformance “stair-step” climb.
It should be noted that all of the levels (light blue horizontal lines) are Fibonacci retracement levels of the November 2021 to January 2023 Growth underperformance period.
I am showing these levels because I’m amazed at how clearly they seem to line up with the price action that is comparing two indexes and a 1,000 shares.
I am also showing these levels because if you look closely, as Growth has outperformed over the past 13 months, while it has sometimes fought to move above each retracement level, once it has cleared the line, it has not fallen back below.
If Value were to continue to outperform and the relationship were to drop back below the ceiling level established in September 2020 and November 2021 (the top light blue horizontal line), it would potentially mark a significant change in character for US equities.
(This is not investment advice.)

Source: TradingView. Through year-to-date 2024.
2. Where the Puck Is…
The chart below from Morgan Stanley maps out the AI data center value chain. (If it’s too small - apologies, please email me).
I continue to try to provide these as I receive a lot of questions on AI.
We have tried to emphasize the broad implications of AI - “Where the Puck is Going” (here) in addition to the picks and shovels infrastructure plays highlighted below.
Over the past couple of weeks, Both Nvidia and Broadcom have held their respective AI events which presented two opposing views for the future of the AI datacenter.
Nvidia’s strategy is to have customers run all their AI workloads on Nvidia’s vertically integrated solution, from the company’s GPUs and now also CPUs, to Nvidia’s server racks and networking, all powered by Nvidia software and libraries.
The opposing view for the future of the AI datacenter was provided by Broadcom.
Rather than having everything vertically integrated, Broadcom is seeing a plug and play world, where components of different manufacturers can be swapped in and out of the AI datacenter at will from GPUs to CPUs, NICs and switches, communicating over open standard ethernet.
The AI world Broadcom is seeing will be running on lower power custom silicon, also commonly known as ASICs, as opposed to Nvidia’s higher power general purpose datacenter GPUs.
We have written about the power / energy requirements of AI, and the argument for power efficiency is an important one.
A way to consider this is that Nvidia has an Apple or Tesla-like approach, i.e. hardcore engineering combined with vertical integration to provide the best customer experience, while Broadcom is seeing more an Android smartphone or Windows PC world for AI, i.e. software platforms running on hardware from any manufacturer.
Both of these models have long and successful histories in tech as both have certain advantages.
(This is not a recommendation to buy or sell any security)

Source: Morgan Stanley. Through year-to-date 2024.
3. Don’t Tell Me What You Think They Should Do, Tell Me What You Think They Will Do
After writing about the US fiscal deficit and fiscal dominance yesterday (here), I understand the desire to cut rates.
As I wrote, in a fiscal dominance regime, the central bank is forced to lower rates to help fund the government deficits.
However, looking at the economic data - from the GDPNow data that recently moved higher to the US Purchasing Managers Index (ISM Manufacturing) which just moved back above 50 - and an equity market at new highs, I am confounded by the rationale.
In many ways, the economy and market are acting as though they are coming out of a recession despite not experiencing one (at least recently).
We began writing about this at the end of January in “Equities Exhibiting Characteristics We Normally See at Lows” (here) and continued it with our theme of the “Everything Rally” (here).
With that, it amazes me that the market is pricing in 3 rate cuts over the next 9 months.
That said, at the beginning of the year, the consensus was expecting 6 cuts and there are now there is less of a probability priced in for 6 cuts than no cuts.
At the beginning of March we questioned, “Will the Fed's Next Move Be a Hike?” (here). In our view it should be.
(This is not a investment advice).
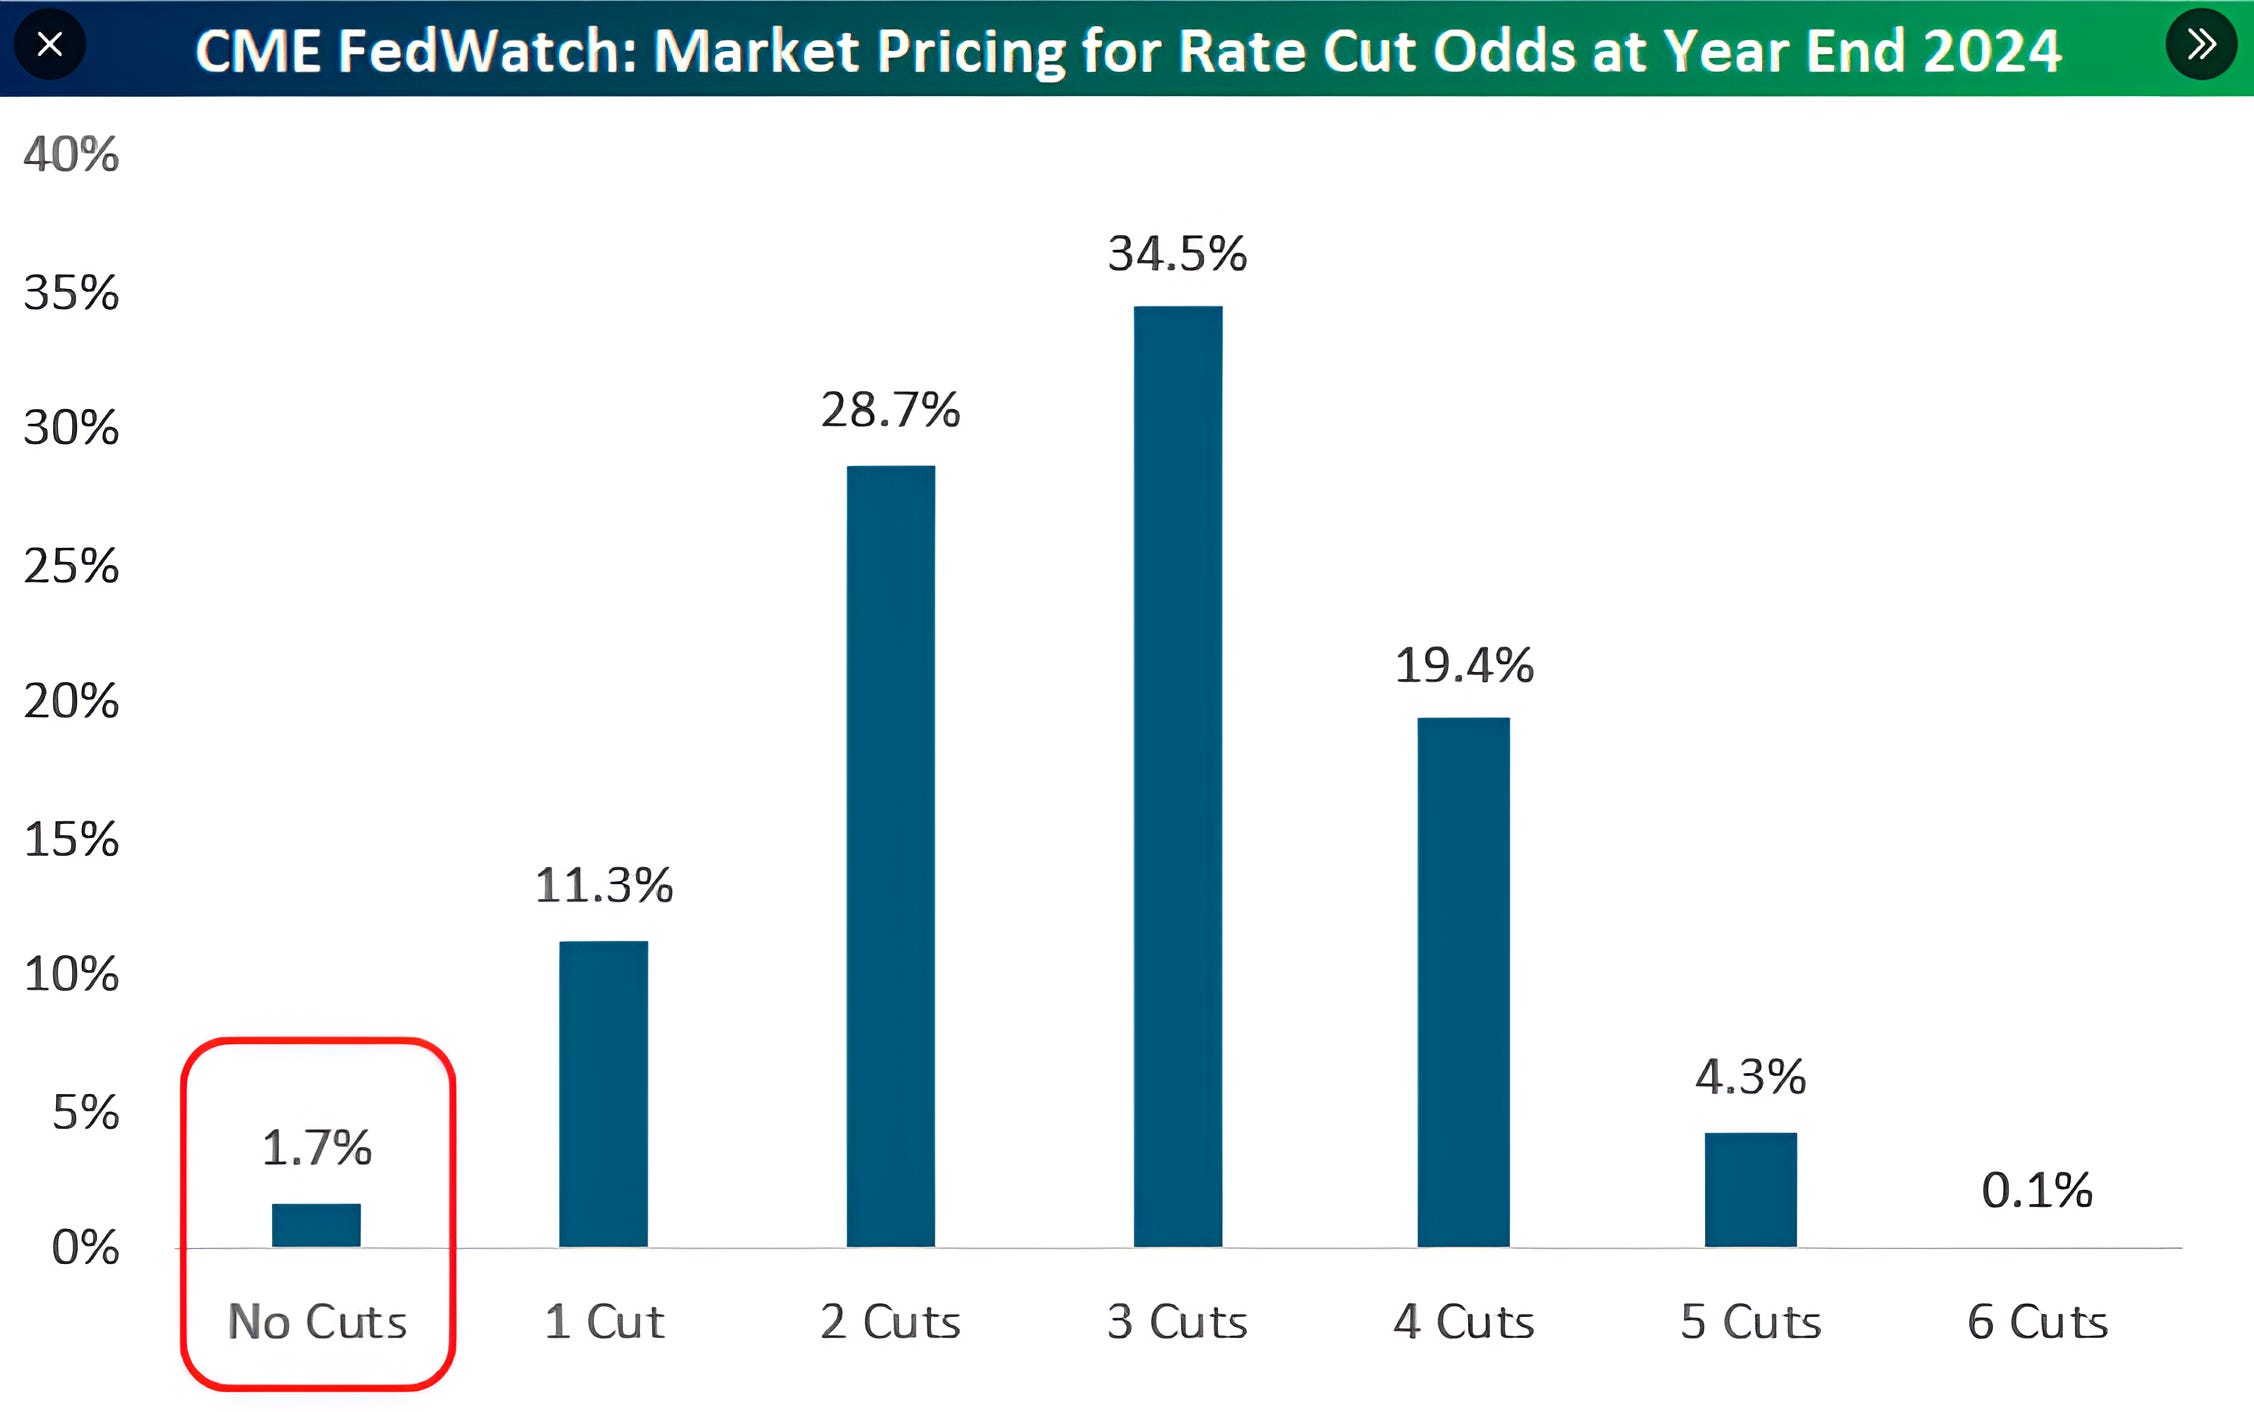
Source: Bespoke Investment Group. Through year-to-date 2024.
4. Keeping an Eye on Small Caps
Tom Lee, the perennially bullish former JP Morgan equity strategist who has now started his own firm Fundstrat, has been broadcasting the message that Small Caps will go up 50% this year.
I have incredible respect for Tom and while he has not been wrong with his bullish prognostications, from time to time he has been “early.”
Small Caps are now up 3.2% year-to-date and what has caught my attention is that they seem to have to work very hard to clear each of the congestion levels (the blue horizontal lines) of the past 3 years.
In fact, after Small Caps initially moved above the $198 level, they fell back below again before working their way higher. We are seeing a similar dynamic play out around $206.25 (the rung above $198).
While we see it as a positive that Small Caps have moved above their 2022-2023 sideways range and have joined the “Everything Rally,” we would have more confidence in the possibility of significant upside if the climb higher seemed a little easier.
(This is not a recommendation to buy or sell any security)

Source: TradingView. Through year-to-date 2024.
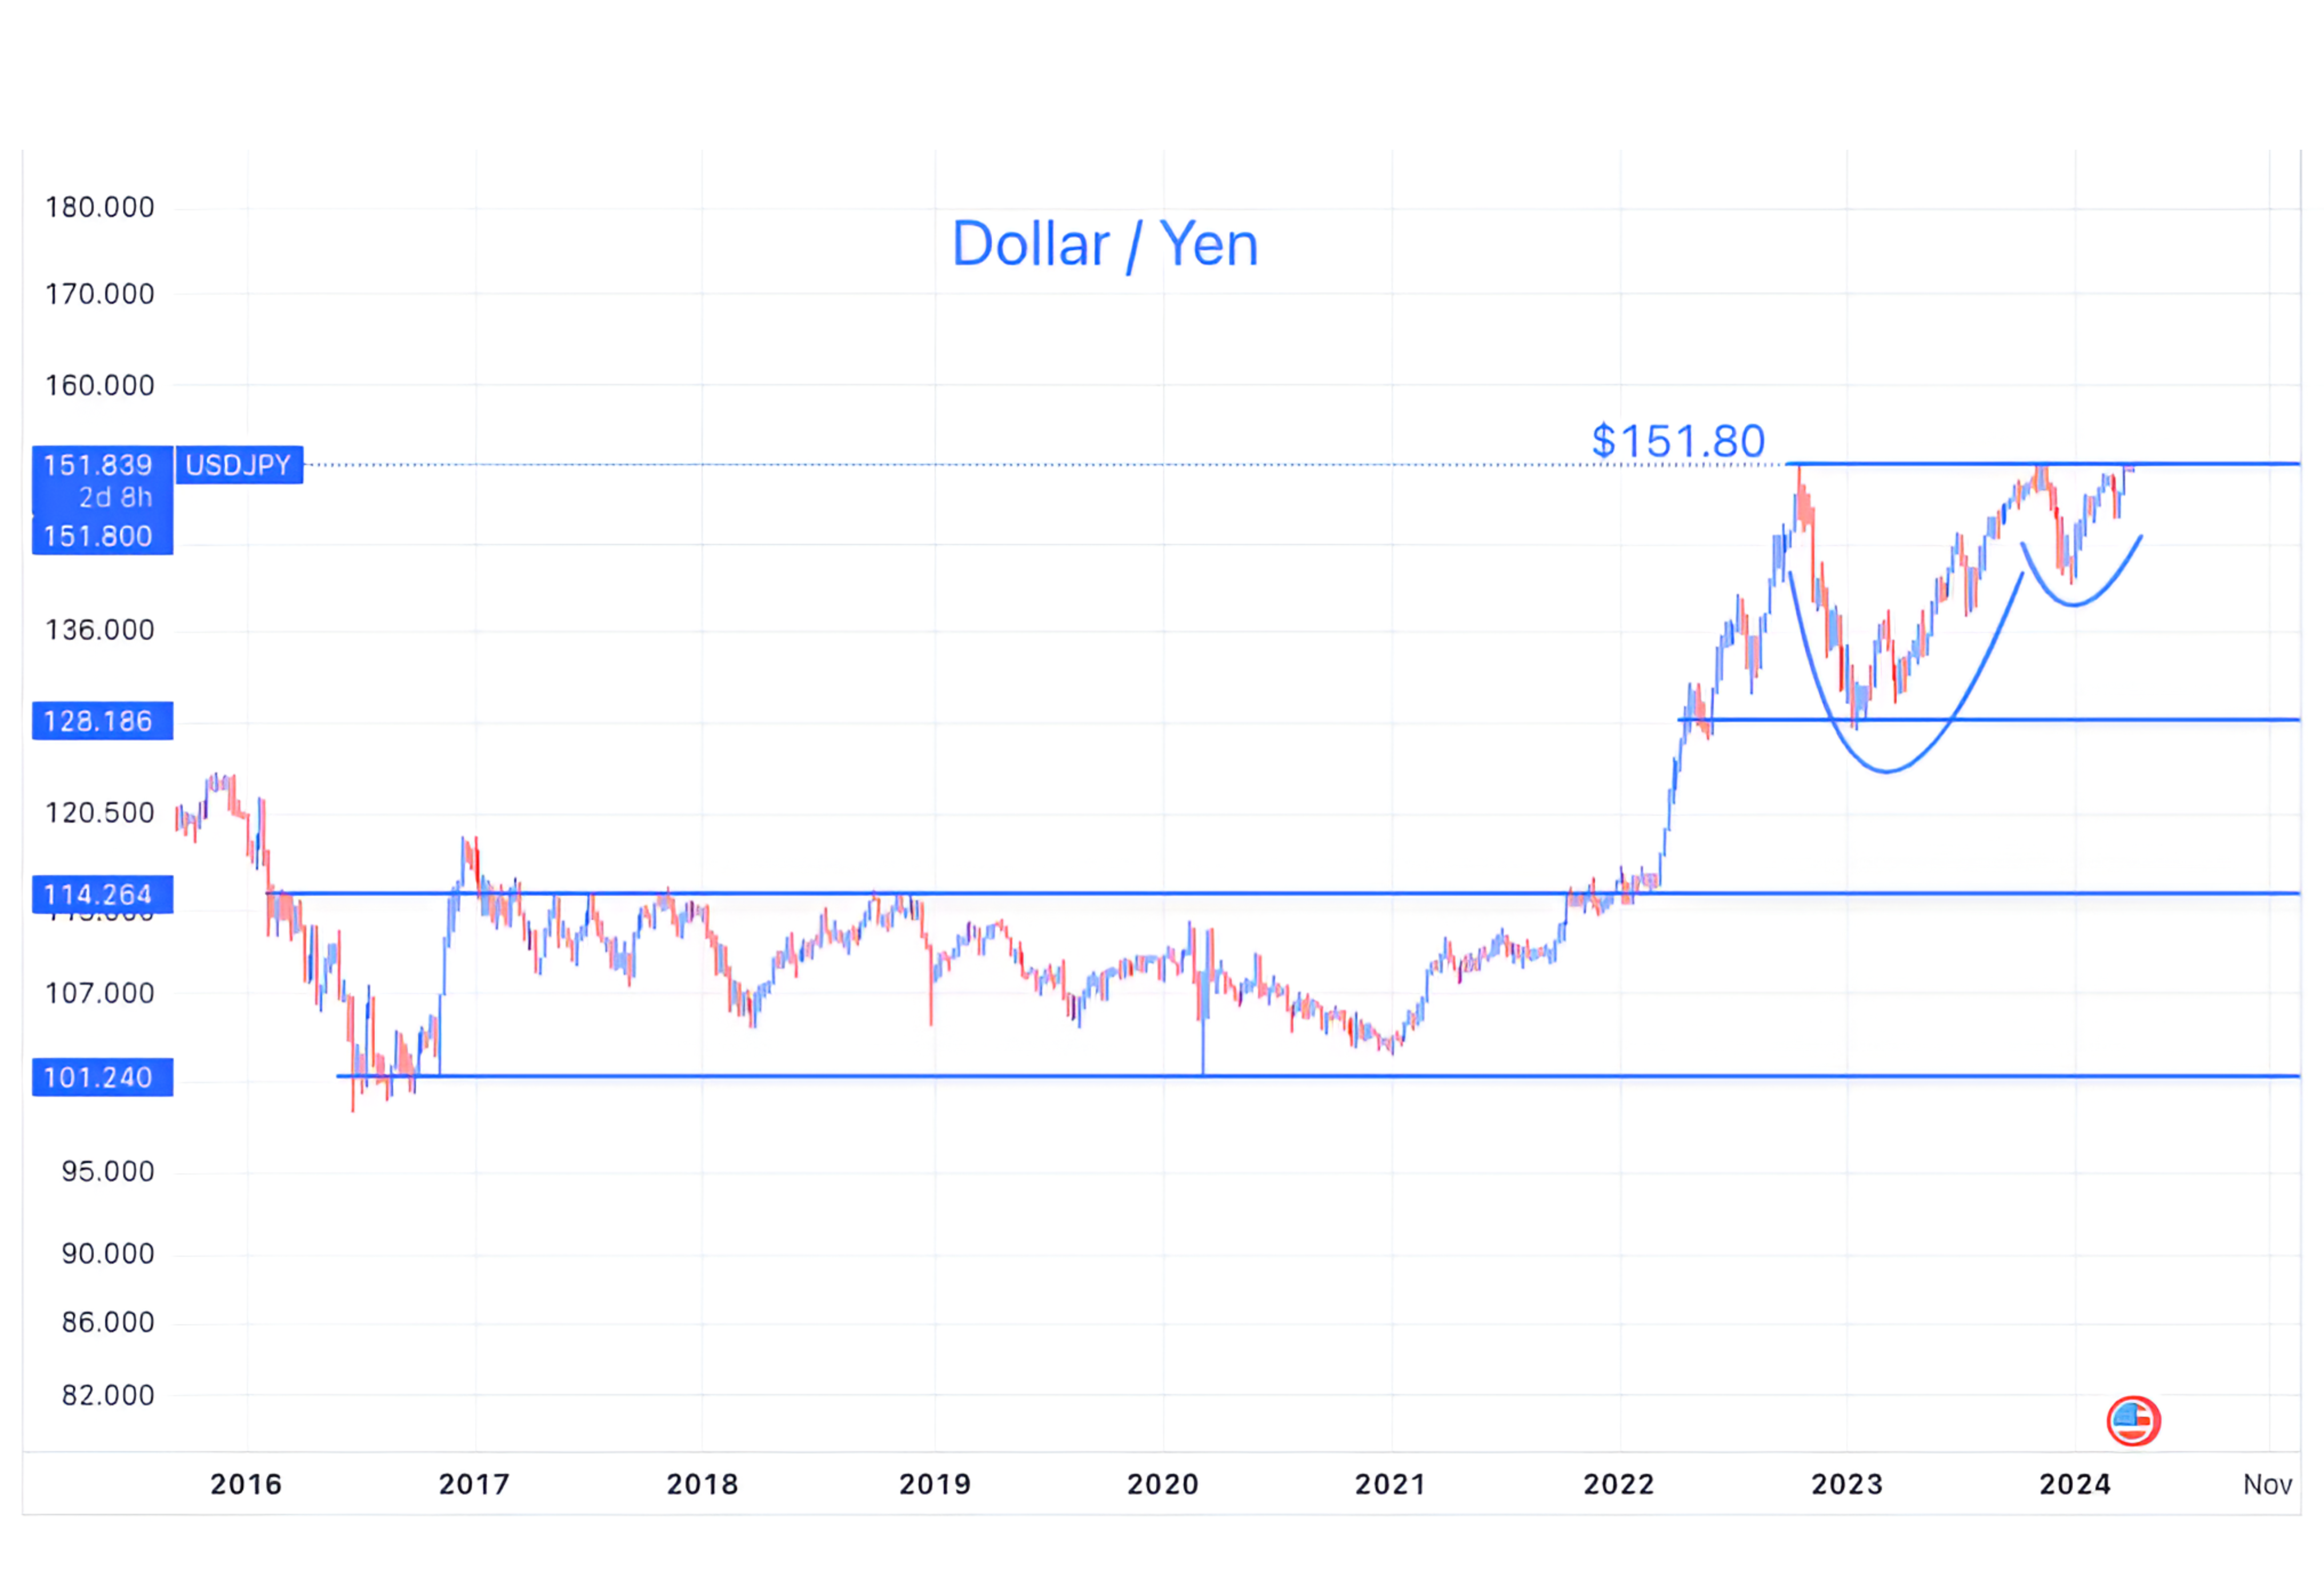
5. Meanwhile, in Japan…
The Yen seems to be testing an interesting level.
Why is it interesting?
Remember, two weeks ago, the Bank of Japan slightly tightened interest rates.
While policy remains more accommodative (+0.1%) than those of other developed markets, often after a tightening decision, the currency will strengthen (all else equal) as the market begins to price in future tightening.
In the case of Japan, this was a “buy the rumor” - as the Yen strengthened from $151.80 (top horizontal light blue line) to $140.00 in Q4 2023 as investors expected the BOJ to tighten - and “sell the news” as the tightening was not as aggressive as some feared and future tightening is uncertain.
All of that said, the weak Yen has an important positive impact on equities:
Japanese equities: many large Japanese companies are export oriented and benefit from a weak Yen.
Over the past year, as the Yen has weakened from $128 to $151, the Nikkei Japanese equity index is up 49% over the same period.
(For those interested, the currency hedged Japanese equity ETF - ticker: DXJ is available. Not advice. Please do your own due diligence).
Global equities: the “carry trade” which involves borrowing in Yen at ultra-low rates, selling the Yen and buying other currencies and investing in higher yielding securities including equities.
As Japan tightened monetary policy, there was concern that the Yen carry trade would be unwound and cause disruptions across markets.
The weakness in the Yen has off-set the slightly higher borrowing costs and has alleviated worst case scenarios of a carry-trade unwind.
In addition to being a positive for Japanese equities, in our view, further Yen weakness is supportive of global liquidity and investment.
(This is not a investment advice and is not recommendation to buy or sell any security).