


Karma Police
Today, I wanted to expound on the last graph that I showed yesterday - the total US interest payments - and consider the implications and drivers across markets. Let's dig in...
1. US Fiscal Deficit
After I circulated yesterday’s note, some comments that Ken Griffen from Citadel made in his investor letter caught my attention:
“The surging U.S. public debt is a growing concern that cannot be overlooked.
It is irresponsible for the U.S. government to incur a deficit of 6.4% when unemployment is hovering around 3.75%. We must stop borrowing at the expense of future generations.”
Typically, as can be see on the chart of the US fiscal surplus / deficit to GDP (below), the deficit grows during recessions and shrinks in recoveries.
We looked at this from a different perspective yesterday as we showed the government’s interest payments on the debt that is being used to finance the deficits. (Chart 5 here).
There are three ways that the government can reduce its debt and deficit:
Cut spending - there are no current plans for this in the US as far as I can tell;
Raise taxes - there are some proposals on tax increases, but from what I understand, they are unlikely to pass. Furthermore, nothing being discussed meaningfully address the problem;
Inflation - pay back today’s debt with less valuable currency in the future.
Which do you think the politicians in Washington will choose?
If you chose option 3, my view is that the bond market and gold are beginning to agree with you.
This is why our view has been that there is a significant risk of higher yields while the consensus is expecting lower (chart 2 here).
We have also continued to articulate why higher yields create a challenge for equity upside.
For those that have either studied history or have tried not to forget it (a club that seems to be becoming more exclusive), you might remember what happened in 1992 (a US election year).
At the time, the deficit hit a then-record $290 billion.
George Bush was forced to reverse his “no new taxes” pledge; Ross Perot, an independent that ran on a platform of fiscal responsibility won 19% of the vote; and Bill Clinton won the election.
While the bond market initially took a wait and see approach to President Clinton, in late 1993, 10-Year Treasury yields moved from 5.2% in late 1993 to above 8% a year later and coincided with a Republican sweep in the mid-terms.
Given the current amount of debt outstanding, a surge in yields similar to that of 1993 / 1994 could create a fiscal crisis. (As a reminder, as we showed yesterday and as we highlight below, interest expense is already a significant budget item).
While a fiscal crisis or a surge higher in yields is not a prediction, it’s a risk.
Although momentum and the “Everything Rally” keep us participating in equity markets, with the S&P 500 trading at 21x forward earnings, downside protection (puts / put spreads), in our view, is likely warranted.
“Karma police, arrest this man, he talks in maths.” Radiohead
(This is not investment advice.)
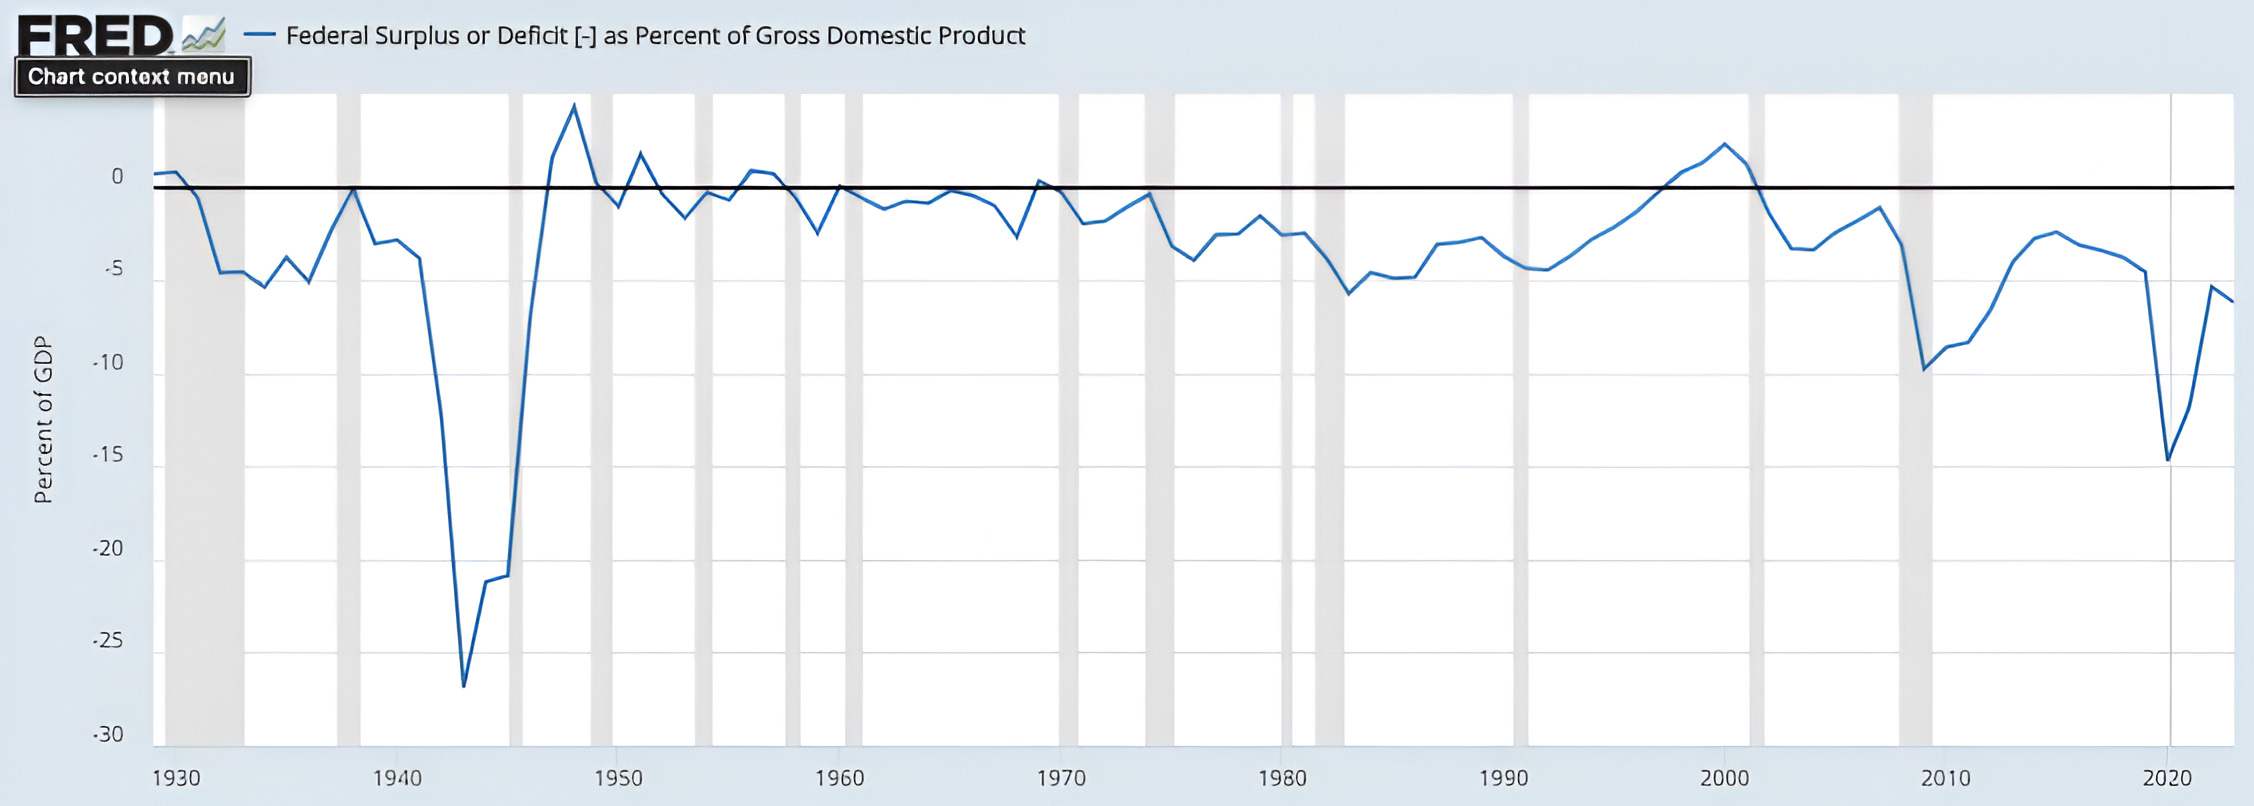
Source: Federal Reserve Bank of St. Louis / FRED. Through year-to-date 2024.
2. How Has the US Been Financing its Deficit?
The US has been disproportionately financing its deficit with short-term T-bills.
Just some quick definitions: Bonds typically mature in 20-30 years; Notes mature anywhere between two and 10 years; and T-bills have the shortest maturity terms—from four weeks to a year.
While the chart may be a little deceiving because short-term T-bills mature regularly and a lot of the issuance is “rollover,” it is clear that the government has been relying on short-term debt to finance its deficit.
Looking closely, it is also possible to see that the issuance of longer-term debt peaked around the time that longer-term yields began moving higher.
Fiscal dominance is an economic condition that arises when debts and deficits are so high that monetary policy loses traction.
In a fiscal dominance regime, the central bank is forced to lower rates to help fund the government deficits.
With the deficit growing; a significant amount of short-term debt rolling over; and total interest expense of $1.1 trillion (see chart 5 here) which is 16.5% of government spending and nearly 25% of total 2023 tax revenues, it is interesting to consider why the Fed is talking about lowering rates despite conditions that may favor increasing them.
While the Fed can, for the most part, control short-term yields with its overnight lending rate (the Fed Funds rate), it typically has less impact on the yields of longer maturities.
To tame longer-term yields, over the past 15 years, the Fed has used quantitative easing (QE) - which is a policy of buying treasuries and other longer-dated fixed income securities to lower yields.
The Fed is already talking about tapering quantitative tightening (QT). They also acknowledged that the balance sheet - where all of the purchased securities end up - will not go back to historical levels.
For years, some investors have believed that QE is a trap that would have to continue (“QE Infinity”).
Should we be on the lookout for quantitative easing?
“Karma police, I've given all I can, it's not enough.” Radiohead
(This is not a investment advice)

Source: Bank of America. Through year-to-date 2024.
3. This May be Why Gold is Rallying
I often call Gold an uncertainty hedge rather than an inflation trade.
However, there are moments when uncertainty and inflation meet.
While Gold was already in a longer-term uptrend when the Financial Crisis occurred, from its low in October 2008 to its September 2011 peak, Gold responded to the initiation of the post financial crisis zero interest rate policy and quantitative easing by climbing 175%.
In October 2023, Gold revisited those 2011 highs (12 years later).
Could the precious metal be responding to the fiscal dominance regime that the government has created (if you look at chart 1 - it was both parties - this is not partisan) or is the explanation as simple as Chinese buying?
I am not a Gold bug by any means, but with the risks outlined above, along with a very attractive looking chart below, Gold may make sense as a tactical part of a broad allocation.
(This is not a investment advice).

Source: TradingView. Through year-to-date 2024.
4. The Next Challenge for the Treasury and Fed - Oil
We consistently highlight the price of oil as we believe it is highly correlated with a) inflation; b) inflation expectations; and (we learned in 2022) c) Presidential approval.
In the first half of 2022, with the mid-term elections coming, a number of Presidential approval polls were conducted.
President Biden’s approval at the time was low and when those responding to the poll were asked why. The number one and two answers were generally inflation and the price of gasoline.
The Biden administration responded to this by a) allowing record oil production in the US; b) ignoring sanctioned Russian oil as it made its way out of Russia; c) engaging Venezuela in talks to allow investment into its oil fields; and d) by tapping and then draining the US strategic petroleum reserve (we will come back to this).
This 4 pronged approach (there may have been other prongs) conspired to bring oil, gas prices and inflation lower while helping move President Biden’s approval rating higher.
After oil prices bottomed in March 2023 around $68 per barrel, they traded in a range between $68 and $81 for the next six months.
Oil prices flirted with the north side of the $81 level in late August 2023 and then in September moved up to $95.
For those of us that are simple equity investors, the period when Oil moved from $81 to $95 was a difficult one.
Equities bottomed in late October 2023 around the exact time when Oil fell back below the $81 level.
Once again, Oil finds itself on the north side of $81.
Overnight, despite the Biden administrations requests to ignore energy infrastructure, Ukraine used a drone to bomb a Russian refinery.
The policy initiatives - ignoring sanctioned Russian fuel, appeasing Venezuela and allowing maximum US production - are all priced in.
OPEC is still withholding production partially because when they wanted stable (not lower) prices, they asked the Biden administration to stop using oil from the US strategic petroleum reserve and the Biden administration refused.
Now the strategic petroleum reserve is drained and China along with the global economy seems to be fully recovering from the covid slowdown.
All of this is happening as the Fed wants to ease and the Biden administration wants its approval higher going into the election.
“This is what you get when you mess with us.” Karma Police, Radiohead.
(This is not a investment advice).
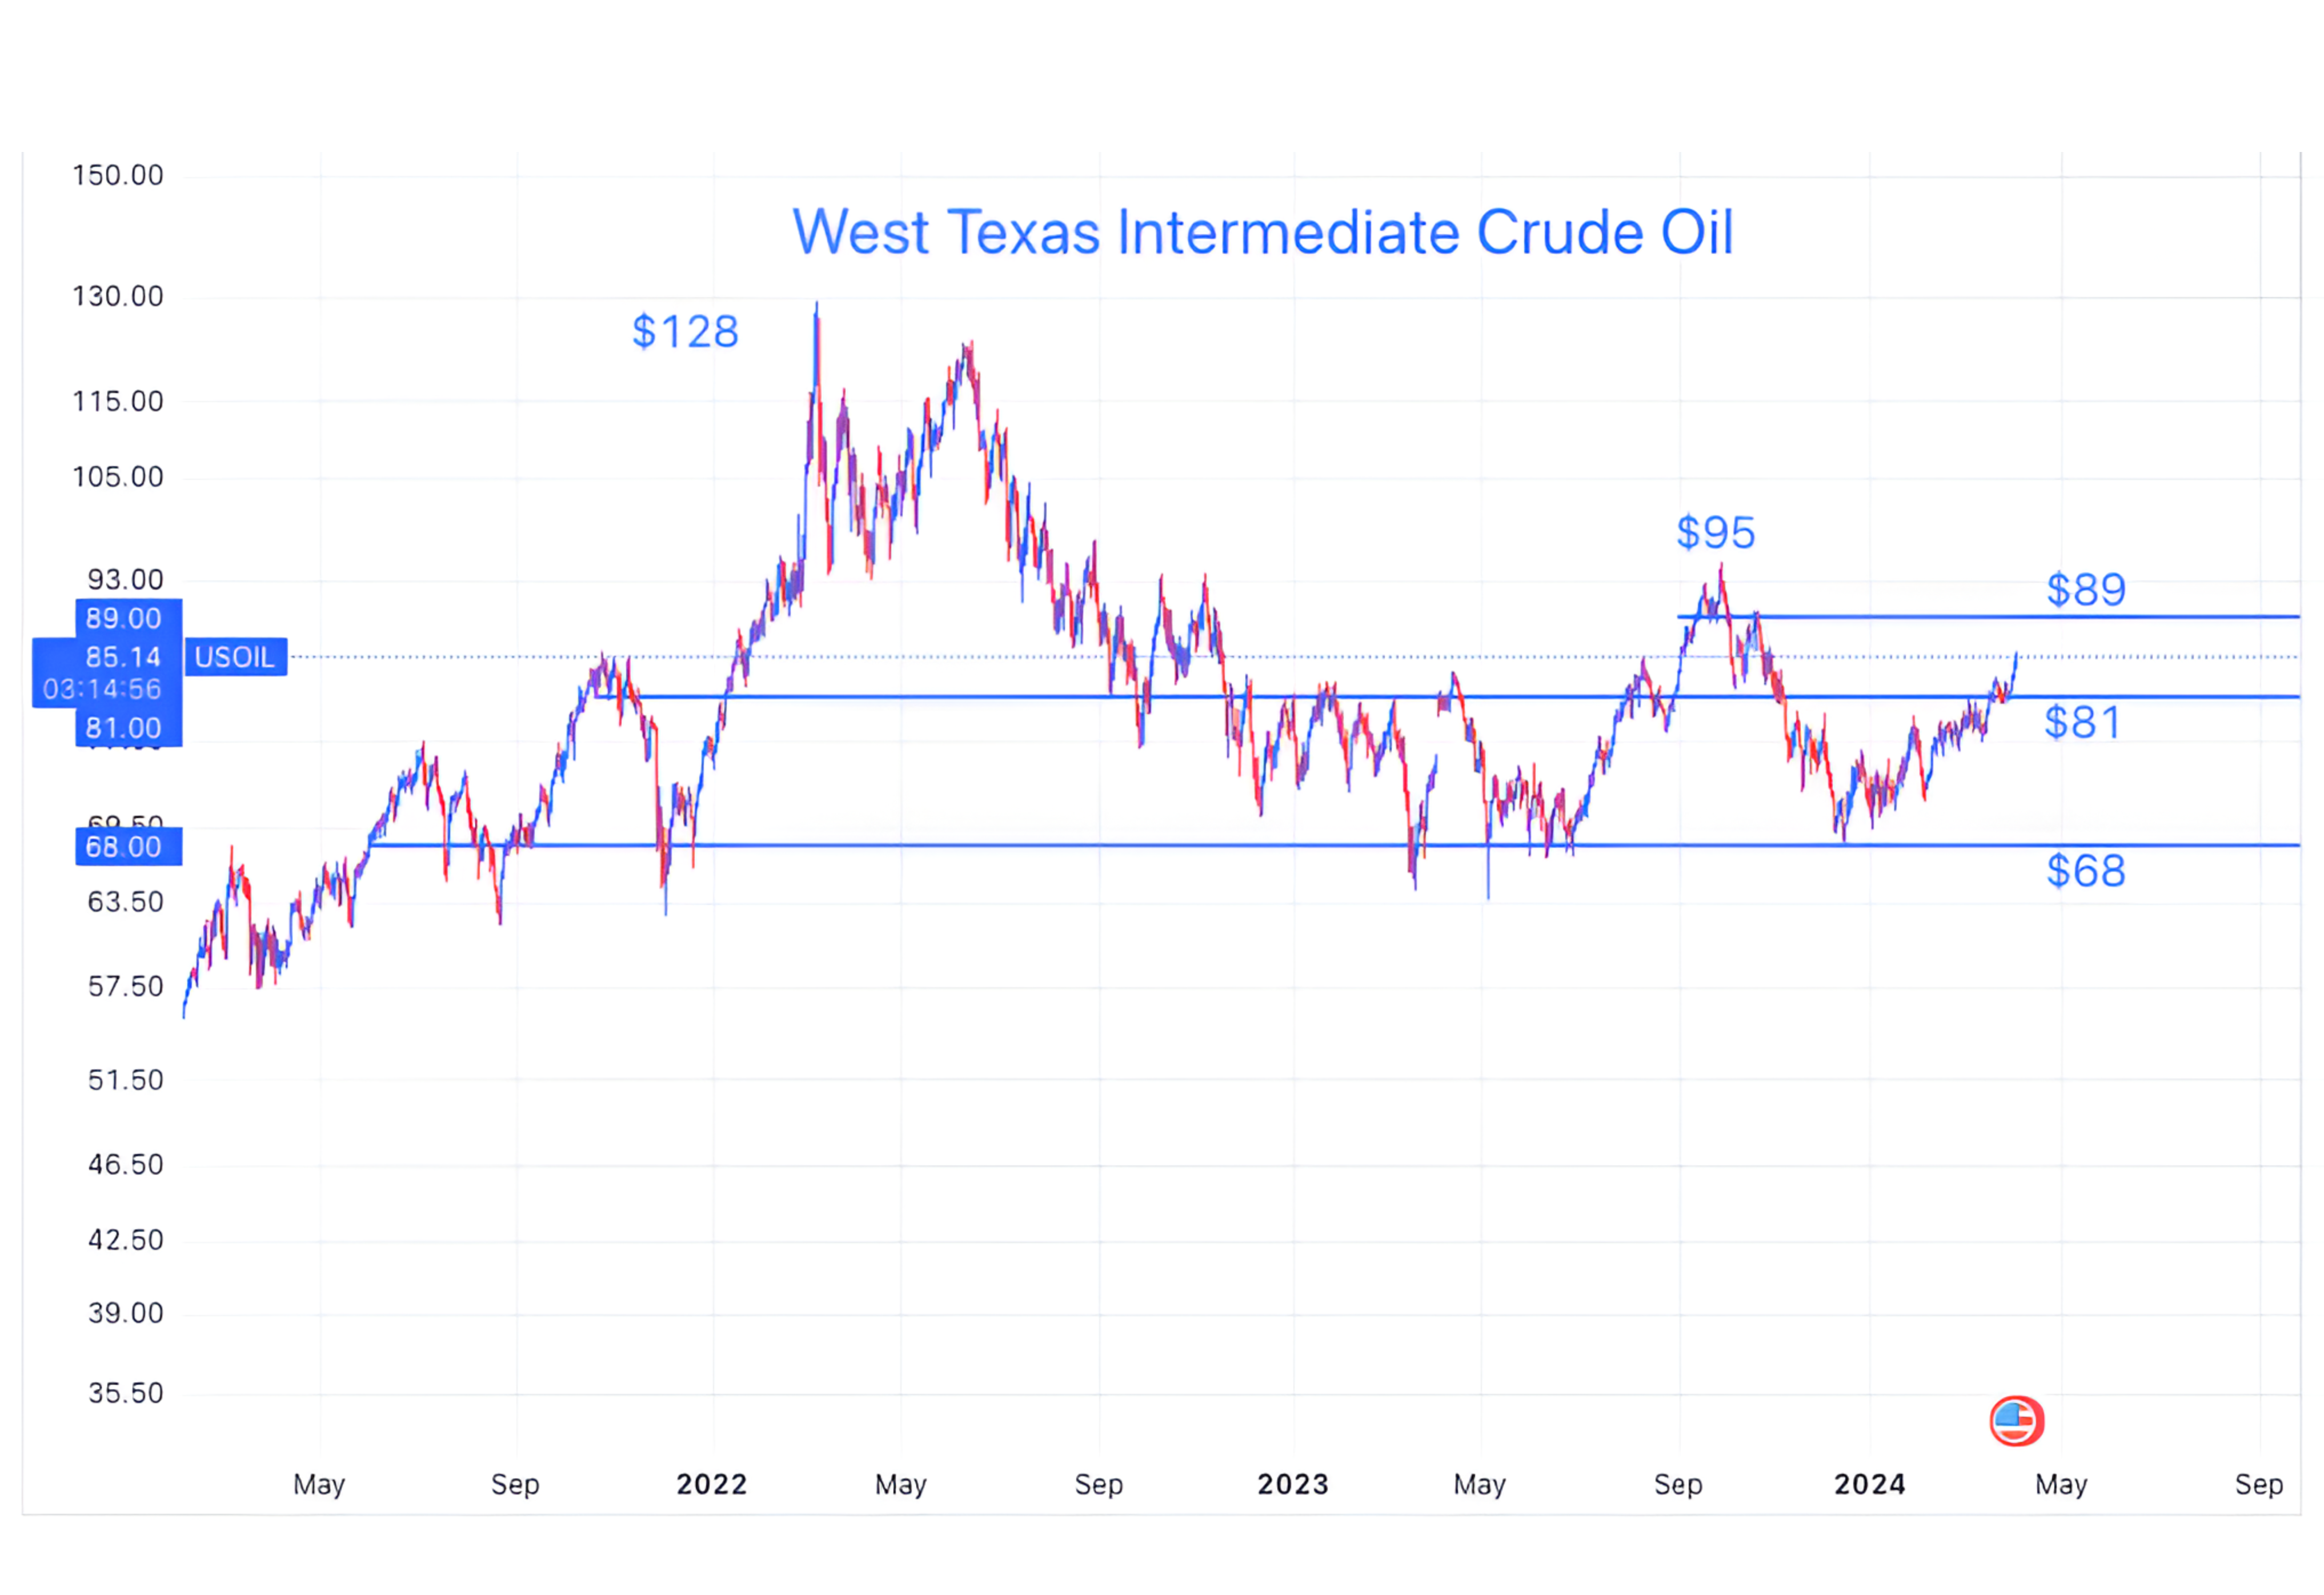
Source: TradingView. Through year-to-date 2024.
5. How Does the Utility Sector Fit into all of This?
The chart below shows US Utilities sector with its 200-day moving average (green curved line).
For the first time since September 2022 the Utilities sector has moved above its 200-day moving average. It has also moved back above its 2021-2023 floor (blue horizontal line).
Why is this interesting?
This may simply be good news as Utilities may be joining the “Everything Rally” that we’ve been highlighting.
It also may also simply be a recognition on the part of investors that AI is going to have significant power requirements that Utilities will aim to fulfill.
It also may be more complicated:
Utilities often rally as a “safety trade.”
If you look at the left side of the chart, you can see that equity investors crowded into Utilities in late 2019 / early 2020 right before covid hit the overall market.
In other words, strength in this sector can be a warning.
Because US Utilities often have above average dividend yields, they are often seen as a proxy for fixed income in equity markets.
If fixed income yields move lower, often Utility share prices move higher which pushes down their dividend yield. This maintains a competitive balance between fixed income yields and the yields on Utility shares.
However, in the current environment, Treasury yields are moving higher while Utility shares are also moving higher (making dividend yields lower).
While this is a bit of a conundrum, it could be, as the theme of today’s piece indicates that Treasury’s are not a safety trade in the current environment and therefore investors are going to Gold and Utilities for safety.
We will watch and continue to monitor.
“Phew, for a minute there I lost myself, I lost myself.” Karma Police, Radiohead.
(This is not a investment advice and is not recommendation to buy or sell any security).
