Here Comes the Hotstepper!
After the Fed's latest decision, press conference and dot plot, the likelihood of a dovish pause has heightened. Like fuel on a fire, this has given support to the Everything Rally. Let's dig in...
1. Watch What We Say, Not What We Do
Yesterday, the Fed announced it’s most recent decision (hold rates steady) but also released its summary of economic projections (SEP) which includes a “dot plot” of each Fed members future interest rate expectation.
One commentator summarized the Fed’s economic projections, by saying:
“The majority of Fed board members project that thru the end of 2025:
growth will remain above potential;
unemployment will remain at secular lows;
core PCE will remain above the mandate (for the 5th year);
and the Fed will cut 1.75% or more.”
As I’ve written, the conditions for a rate cut don’t seem to be there (the first three bullets above), but here we are.
That said, it is important to remember that at the beginning of January, the market had priced-in a hike at yesterday’s meeting with a nearly 100% probability.
While the possibility of rate cuts are the headline this morning, our focus has remained on the balance sheet (chart below).
In yesterday’s meeting, Fed Chair Powell said that it is “appropriate to slow pace of asset runoff soon.”
What this means is that they are going to slow the shrinking of the balance sheet.
Remember, the Feds expansion of its balance sheet began in 2008 (after the financial crisis) as an additional easing measure when the Fed funds rate was a 0%.
This was called Quantitative Easing (QE).
Under QE, the Fed went into the open market and bought longer-term Treasuries and Mortgage Backed Securities to bring interest rates on those instruments lower in order to spur borrowing (cheaper borrowing costs).
Those securities ended up on the Fed balance sheet which expanded.
It has been our view, that each time that the Fed has tried to shrink its balance sheet through Quantitative Tightening (QT) (when the green line on the chart below has moved down), equity volatility has occurred with the exception of the current period.
Why has this period been different?
In our view, “Stealth Liquidity” (see here and, more recently, chart 4 here).
The concept of what we have characterized as “Stealth Liquidity” is that the Fed and Treasury have been off-setting the reduction in the balance sheet (Quantitative Tightening) first by using the Treasury’s General Account and more recently, by using excess reserves from money it printed in 2020 / 2021 in response to covid that was sitting dormant in the Reverse Repo (RRP) accounts.
I have tried to describe the use of the Reverse Repos in the past, but it is basically banks' money coming back out of lockup at the Fed and into banks' hands to lend.
The Reverse Repo account is almost drained.
We wrote about this 2.5 weeks ago (here) and, among other things, said:
“As the RRP is expected to be completely drawn down over the next two months, the Fed is now considering slowing its Quantitative Tightening (Tapering the Tightening).”
Tapering the tightening is exactly what the Fed announced yesterday.
This is ok and the market can rally.
The risk is inflation (see Chart 3) and inflation expectations - if the market becomes unsure of the Fed’s commitment to fighting inflation.
As a reminder, when the Fed stopped hiking rates in late July 2023, the 10-year yield was 3.95%. (see Chart 2).
Even though inflation had declined from 9% to 4%, the market was "unsure" about the Fed's commitment to fighting inflation. 90 days later, in October 2023, the 10-Year Treasury yield peak at over 5%.
Equities sold off during that period.
If the he market thinks the Fed is not serious about fighting inflation, in our view, 10-Year US Treasury Yields will once again move higher.
Fed dovishness only works if the market is convinced that inflation is not a problem. Right now, in our view, the market is unsure.
How do we know?
Despite the rally in equities, 10-Year yields are hovering around a recent ceiling area and haven’t moved much since the Fed’s announcement (chart 2).
(This is not a recommendation to buy or sell any security, it is not investment advice).

Source: 3Fourteen Research. Through year-to-date 2024.
2. 10-Year Yields - the Inflation Expectation Barometer
We have been and are laser focused on 10-Year Treasury yields for two specific reasons that pertain to equities:
In a discounted cash flow valuation model, 10-Year US Treasury yields are often used as the “risk free rate” to “discount” future cash flows.
While we will not go into the calculation, higher 10-Year Yields, all else equal, leads to lower equity valuations (at least on paper). Lower valuations are often expressed in equity markets through PE multiple contraction.
In an “equity risk premium” analysis, we compare the equity yield (the inverse of the PE ratio —> a PE of 20 = 1/20 = 5%; whereas a PE of 10 = 1/10 = 10%) with the Treasury Yield.
The concept is that equity investors should receive some premium for taking equity “risk.”
During the late 1990s, the Equity Risk Premium was negative (the earnings yield on equities was lower than the 10-Year Treasury yield) for multiple years. Alan Greenspan (in 1996) referred to this as irrational exuberance.
The current forward PE of the S&P 500 is 21.3x. The current earnings yield (1/21.3) is 4.7%. With the 10-Year Yield at 4.3%, Equity Investors are receiving 0.4% to take equity risk. Historically, this is low and below the long-term average.
Whereas PE levels are an absolute valuation measure, equity risk premium is a relative valuation metric - are equities expensive relative to the (less risky) fixed income?
As we highlighted in Chart 1, with the Fed’s move yesterday, we believe the Treasury market will digest the news and react.
We see the risk that 10-Year US Treasury yields move above the 4.34% level.
If they do (in a meaningful way), we believe they will trend towards 4.65%.
In our view, this could lead equities to retrace some of their recent gains.
As we always write, valuation is not a catalyst, however, higher inflation and higher 10-Year Yields can be.
(This is not a recommendation to buy or sell any security and is not investment advice. Past performance is not indicative of future results).

Source: TradingView. Through year-to-date 2024.
3. Inflation and PEs
With the S&P 500 trading at 23.5x trailing twelve month (TTM) earnings, we are not showing this chart to say that the market is expensive, we are showing it to reflect that with higher inflation (CPI), historically, there have been lower PE multiples. (Past performance is not indicative of future results).
When CPI moves above 4%, historically, the PE multiple has really begun to contract.
Currently, with CPI at 3.2% and with near-term trends moving higher (especially in core - we showed this here), we see inflation and inflation expectations as fragile and an equity market that is already trading at a premium.
Like we wrote above, the risk is inflation and inflation expectations.
If the market becomes unsure of the Fed’s commitment to fighting inflation, it will be expressed in 10-Year Treasury yields and may be reflected in contracting PE multiples.
(This is not a recommendation to buy or sell any security).

Source: Strategas. Through year-to-date 2024.
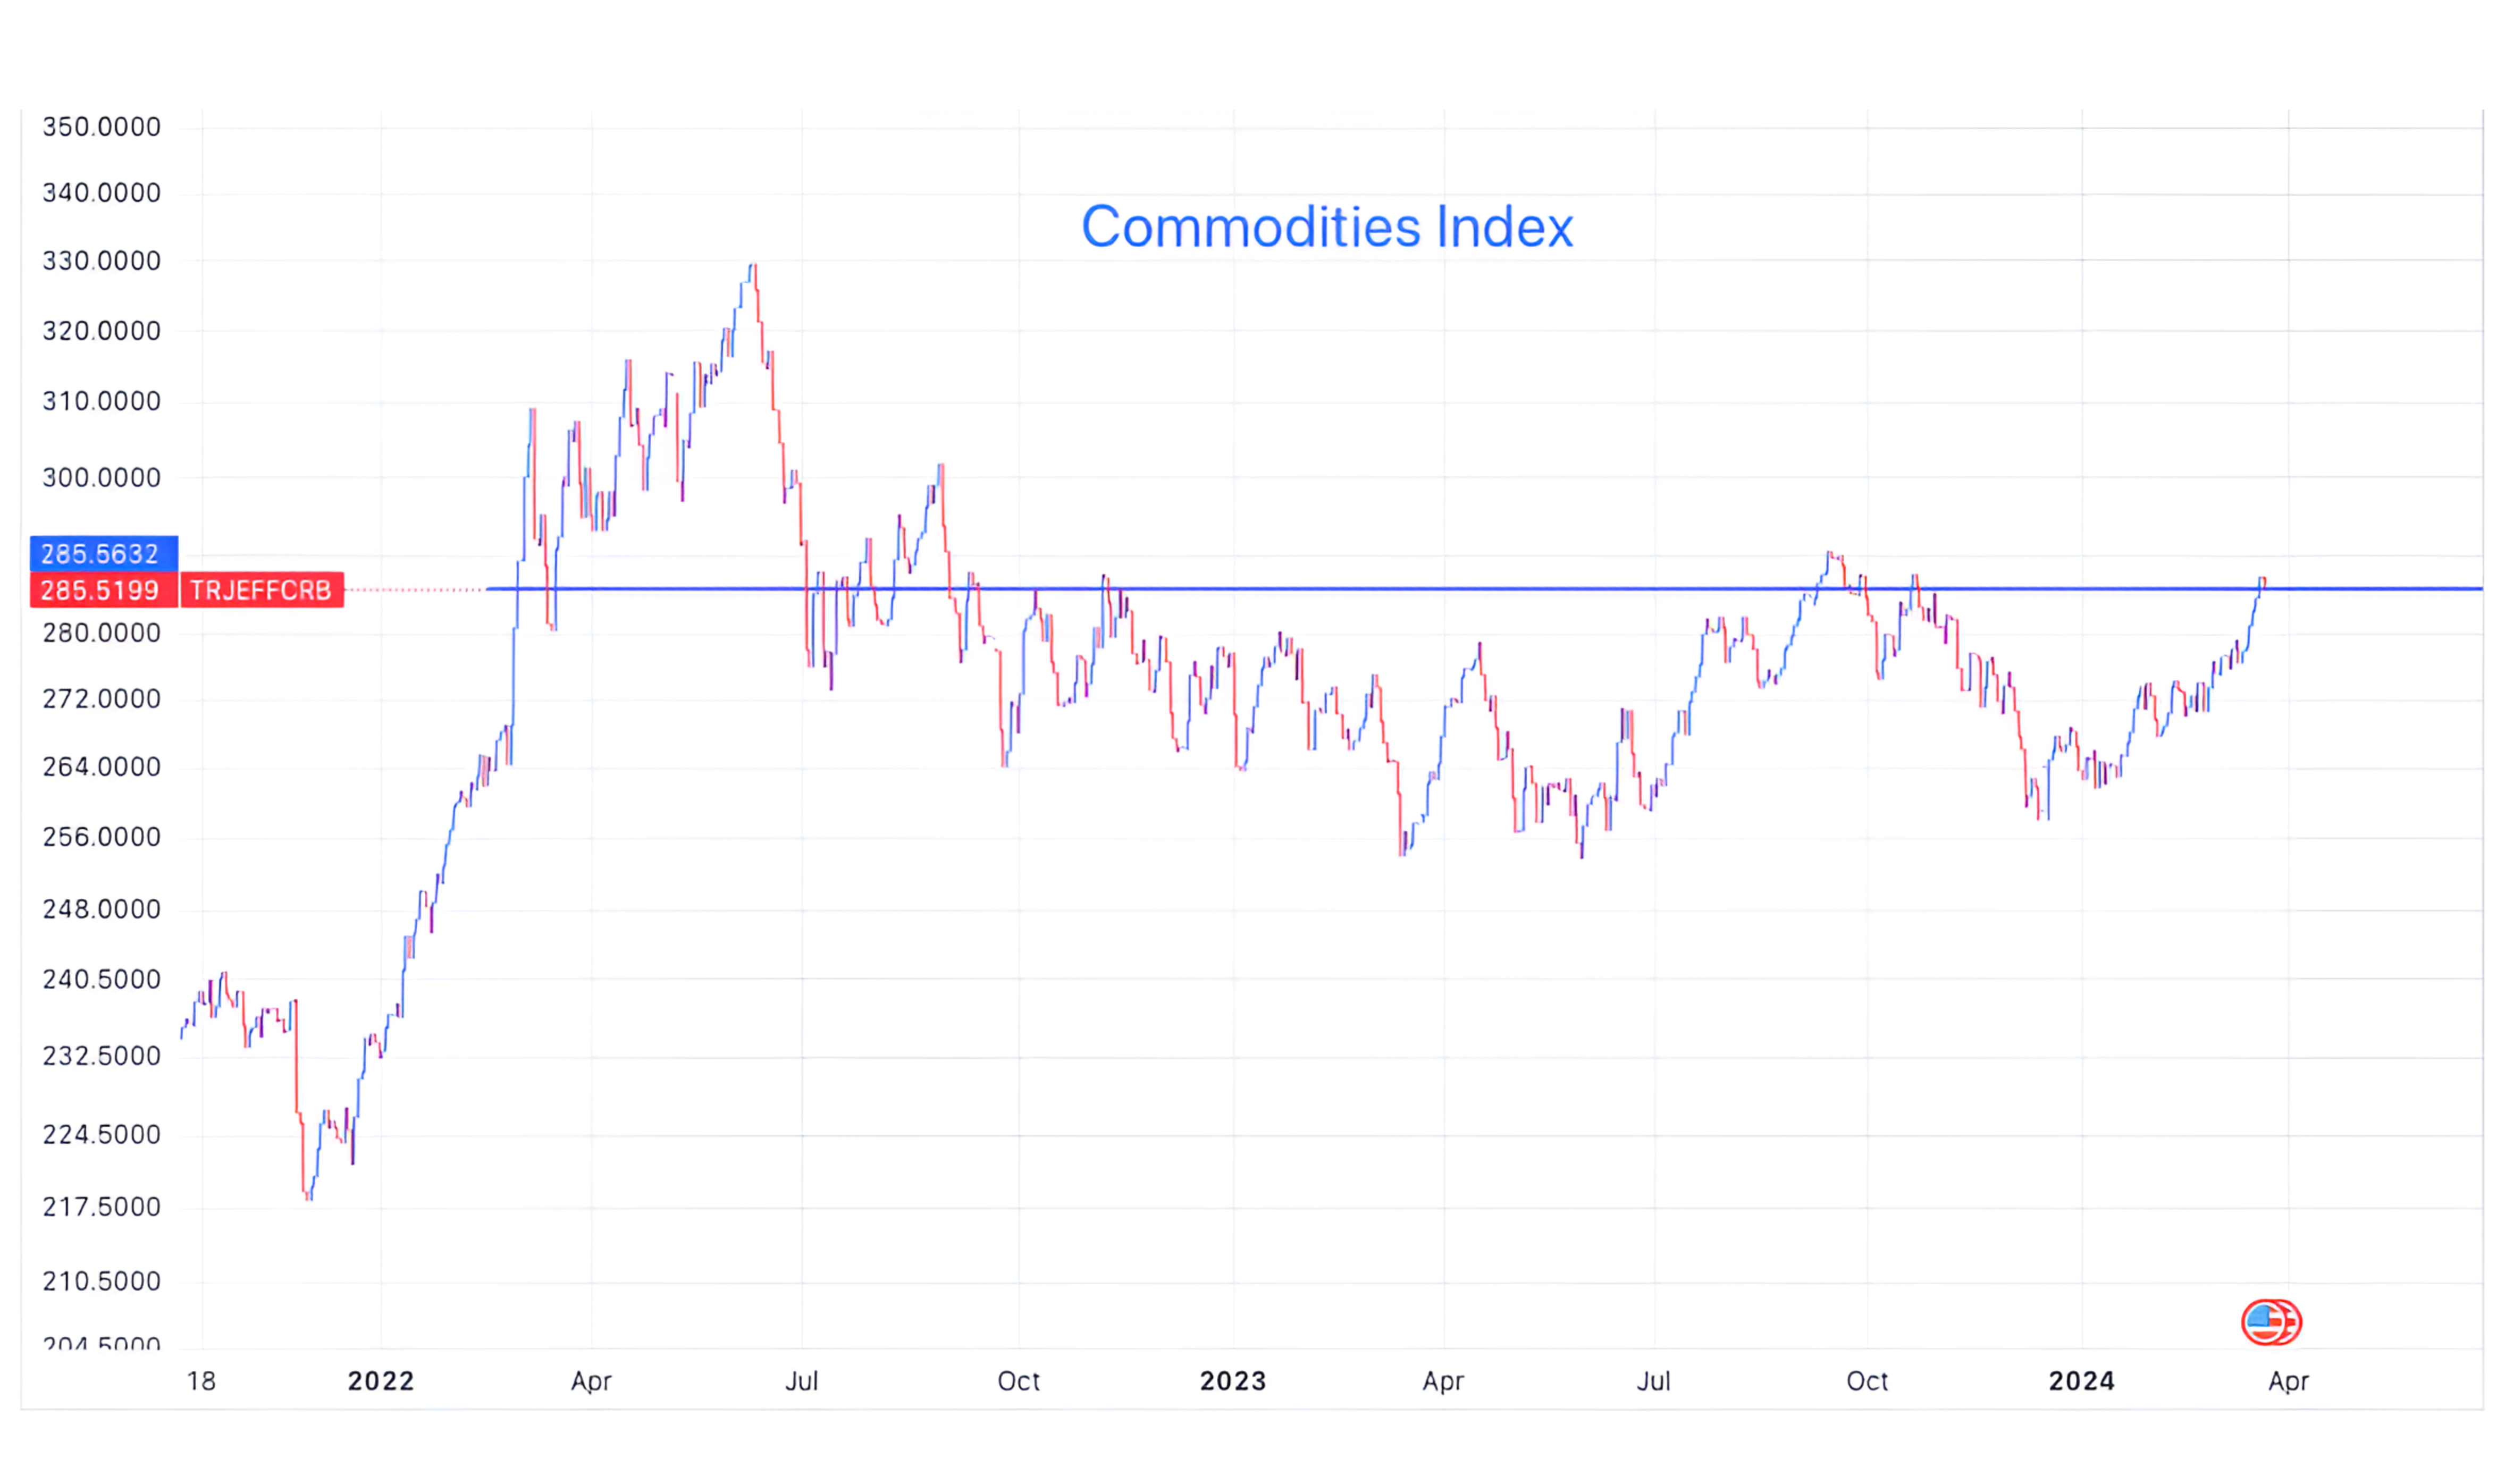
4. Don’t Wake the Sleeping Beast
Why would we be concerned about inflation, while the Fed doesn’t seem to be?
The Commodities Index (chart below) is once again testing its 15-month ceiling level.
Why is this important?
Despite central banks efforts to exclude commodities from inflation indicators (core measures that exclude food and energy); oil, gas, metals, soy, sugar, cotton, meats are pervasive in the final prices of almost all goods.
In other words, the root of inflation to an extent can be found in the chart below.
It is notable, in our view, that as commodities prices were rising through the early part of 2022 (furthest left on the chart), equity markets struggled.
Equity markets bottomed in October 2022 when the commodity index tried to move above its ceiling level (the horizontal blue line) and was denied.
We believe that if the commodities index has a meaningful move above its ceiling level, this may lead to higher 10-Year Treasury Yields and be a headwind to equity markets both in terms of earnings margins (higher input costs if they can not be passed to the end user lead to lower margins) and possibly PE multiple compression.
(This is not a investment advice and is not recommendation to buy or sell any security).
Source: TradingView. Through year-to-date 2024.
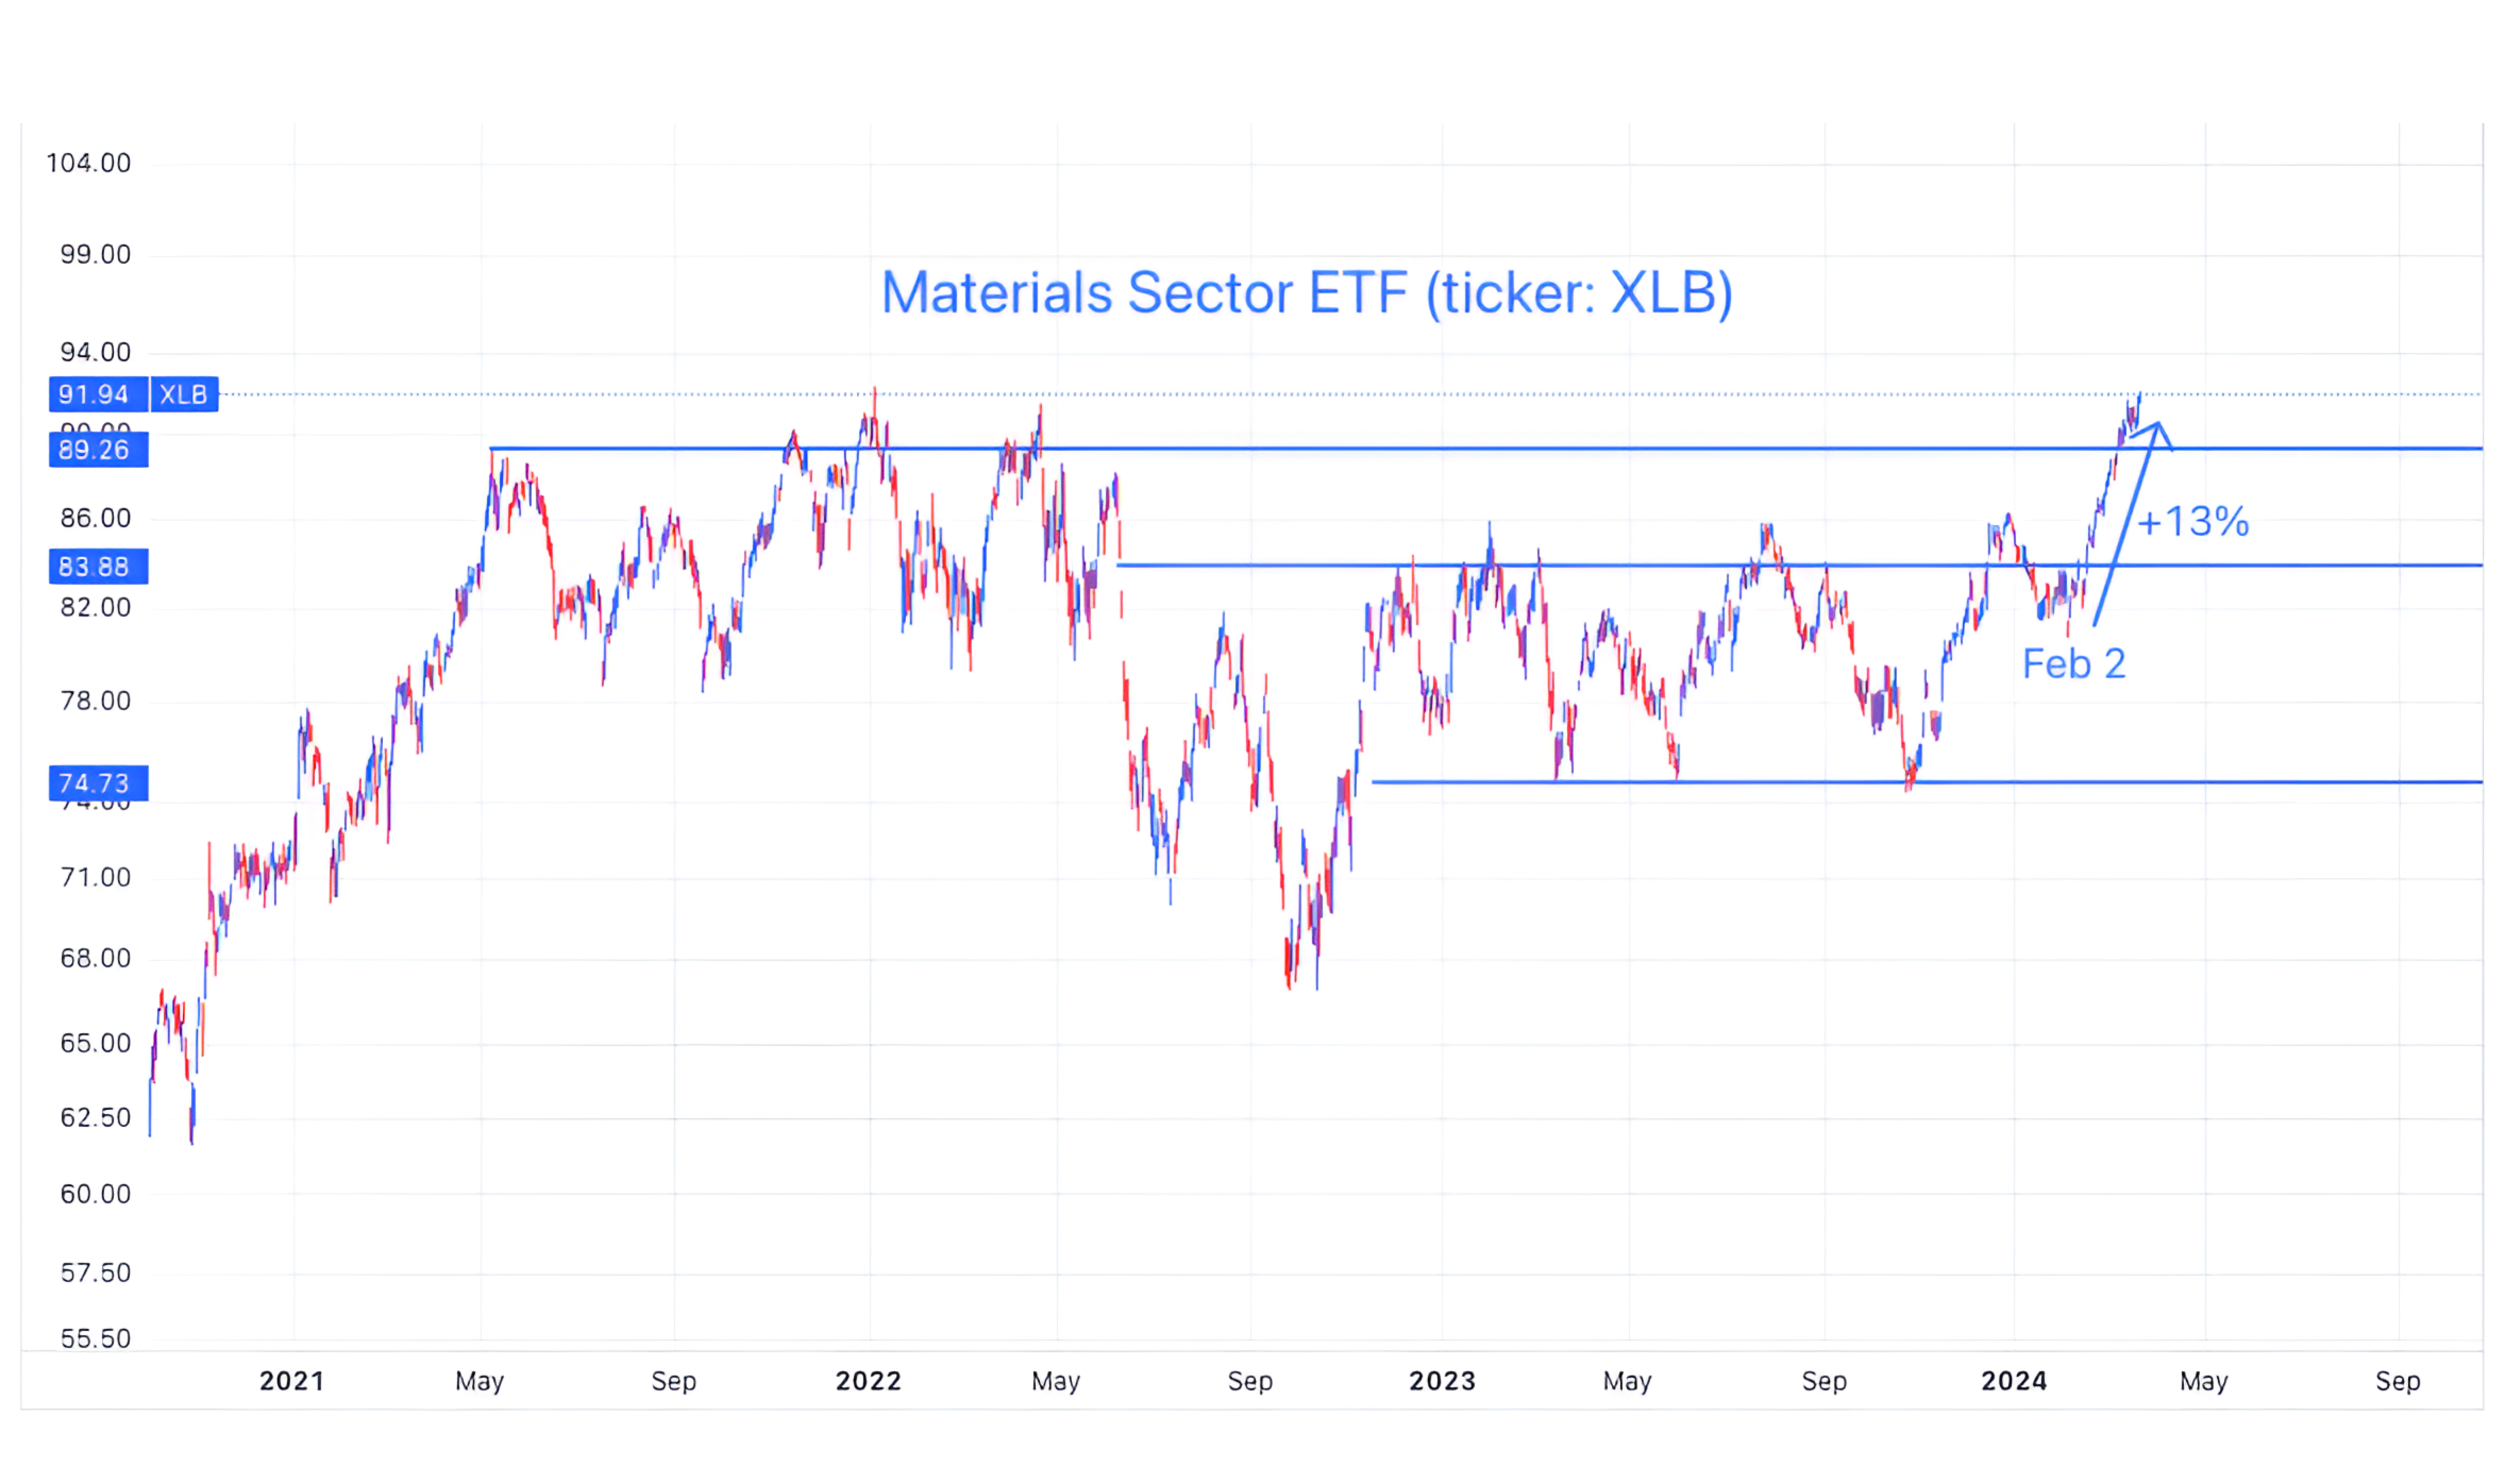
5. Equity Markets May Have Begun to “Sniff” This Out
If you look closely at the chart below, you can see that the Materials Sector has closed at a new all-time high.
Is this equity investors pricing in the potential for higher materials prices (think copper, steel, metallurgical coal, industrial gases, plastics etc.)?
Is this equity investors hedging the possibility of higher inflation while they ride their AI exposure?
Is this simply a part of the “Everything Rally” that may be reflecting sustained global economic growth and the “Soft Landing”?
Is this a reflection of China’s recovery after real estate challenges (being kind) and covid lockdowns?
One thing we have learned (and a reason we show the charts) is that markets often lead and the narrative (or reason) follows.
I will be back on Monday. Have a great weekend!
(This is not a investment advice and is not recommendation to buy or sell any security).