


How Soon is Now?
Imbalances - sentiment (chart 2); inflation (chart 3); and 10-Year Yields (back near 4.3%) - seem to be percolating. Equities have ignored them recently, can they ignore them again? Let's dig in...
1. Have the Stairs Been Replaced by an Escalator?
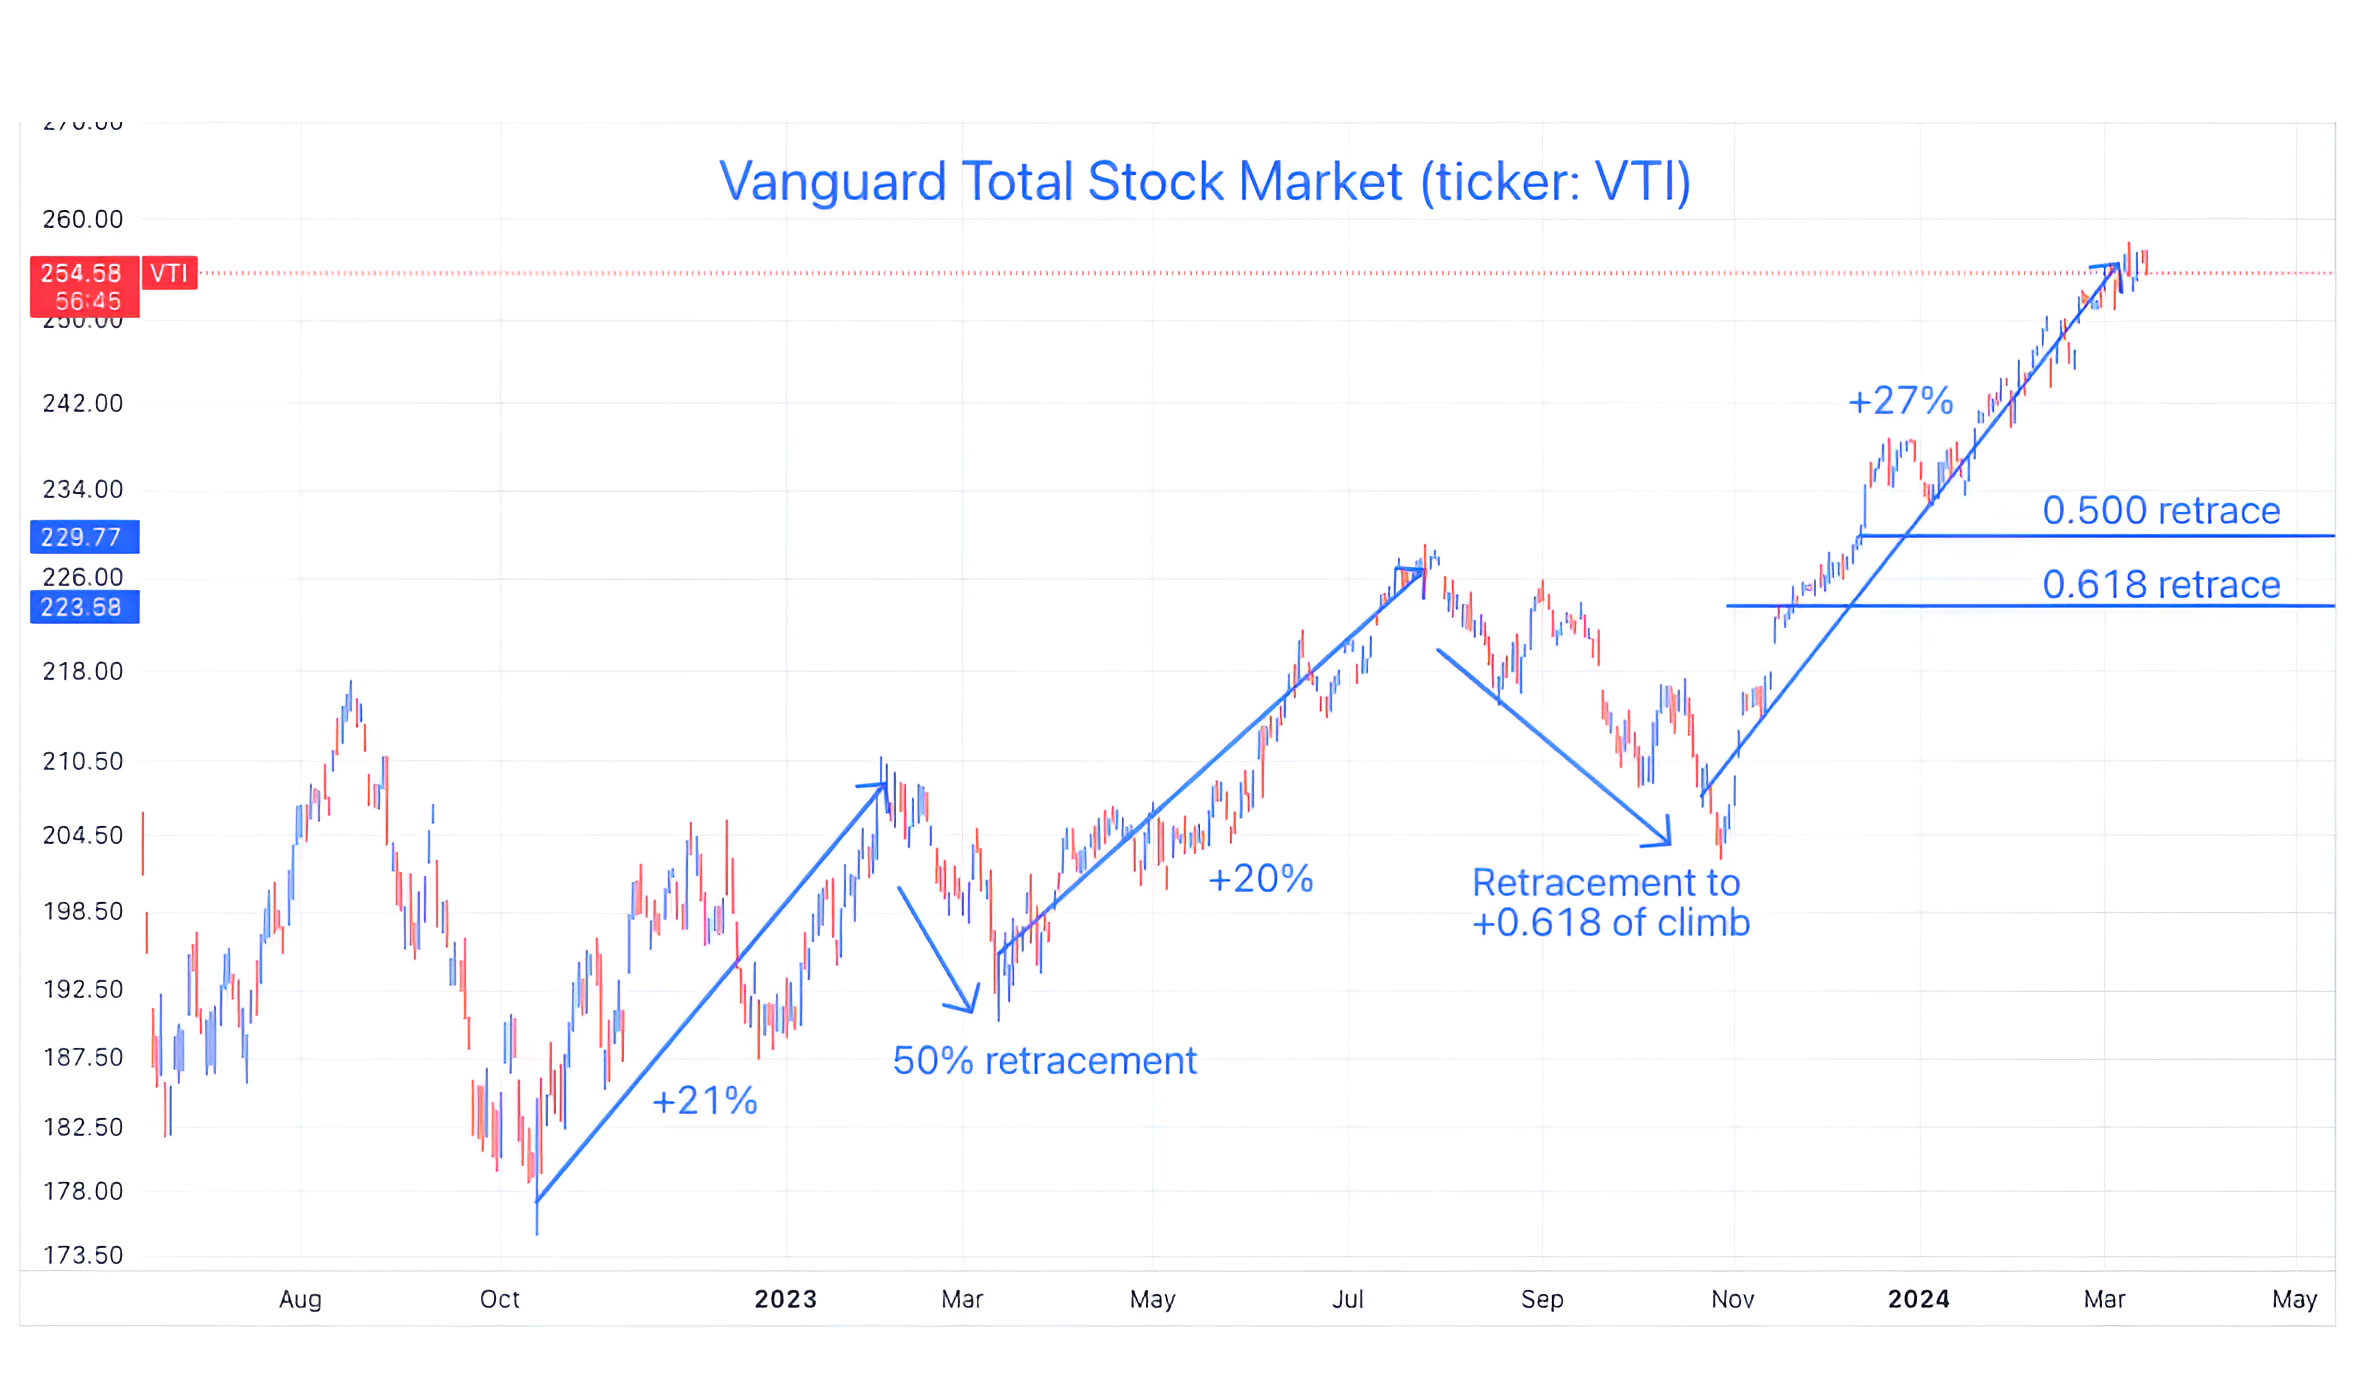
On the chart below of the Vanguard Total Stock Market ETF (ticker: VTI), we have aimed to highlight the pattern of the broad equity market since the October 2022 low. (This is not a recommendation to buy or sell any security).
In general, the equity market has “stair-stepped” higher with each move higher followed by correction.
The first correction, after the October 2022 to February 2023 21% rally gave back 50% of the climb.
After the 20% March 2023 to July 2023 ascent, the equity market retraced to the 61.8% (Fibonacci level) of its move higher (more than 50%).
While this is not a prediction, if the current 27% rally were to retrace 50% of its climb it would represent a 10.5% correction and if it were to retrace 61.8% its climb, it would be a 13.0% drop from current levels.
Although a much less significant correction is possible, in the event of a more meaningful draw down, these might be levels to keep an eye on.
(This is not a recommendation to buy or sell any security, it is not investment advice).
Source: TradingView. Through year-to-date 2024.
2. Sentiment is Running Hot!
We wrote about sentiment here (this was also the first piece in which we considered that the Fed’s next move could be a hike - see inflation in chart 3).
In late October, we recognized that investment sentiment, in general, had become overly pessimistic and we were able to take advantage of that by increasing equity exposure and buying call options.
That said, in late December, with sentiment back at its highs of the cycle, we became concerned about the possibility of a meaningful sell-off.
Despite overly positive sentiment, a weak Christmas week (no Santa rally) and a negative first week of January (often a concerning signal), there has been no sell-off greater than 2% in 2024.
This week, the National Association of Active Investment Managers (NAAIM) hit its highest level of the past year at the same time the American Association of Individual Investors (AAII) Bears is near its low (not shown).
While these do not represent catalysts that will make the equity market go down, we do see sentiment as possible accelerant in the event of a sell-off.
In addition, in our view, with sentiment at or near extreme levels, significant near-term upside from current levels may be constrained.
In general, our view of markets is probabilistic. We try to view things in terms of odds or likelihoods.
Although markets do not need to pause or correct, given sentiment, we view the near-term probability of profit taking as higher than the likelihood of significant near-term upside.
(This is not a recommendation to buy or sell any security and is not investment advice)

Source: National Association of Active Investment Managers (NAAIM). Through March 5, 2024.
3. Inflation
I have continued to question why the Fed would cut rates this year (most notably here).
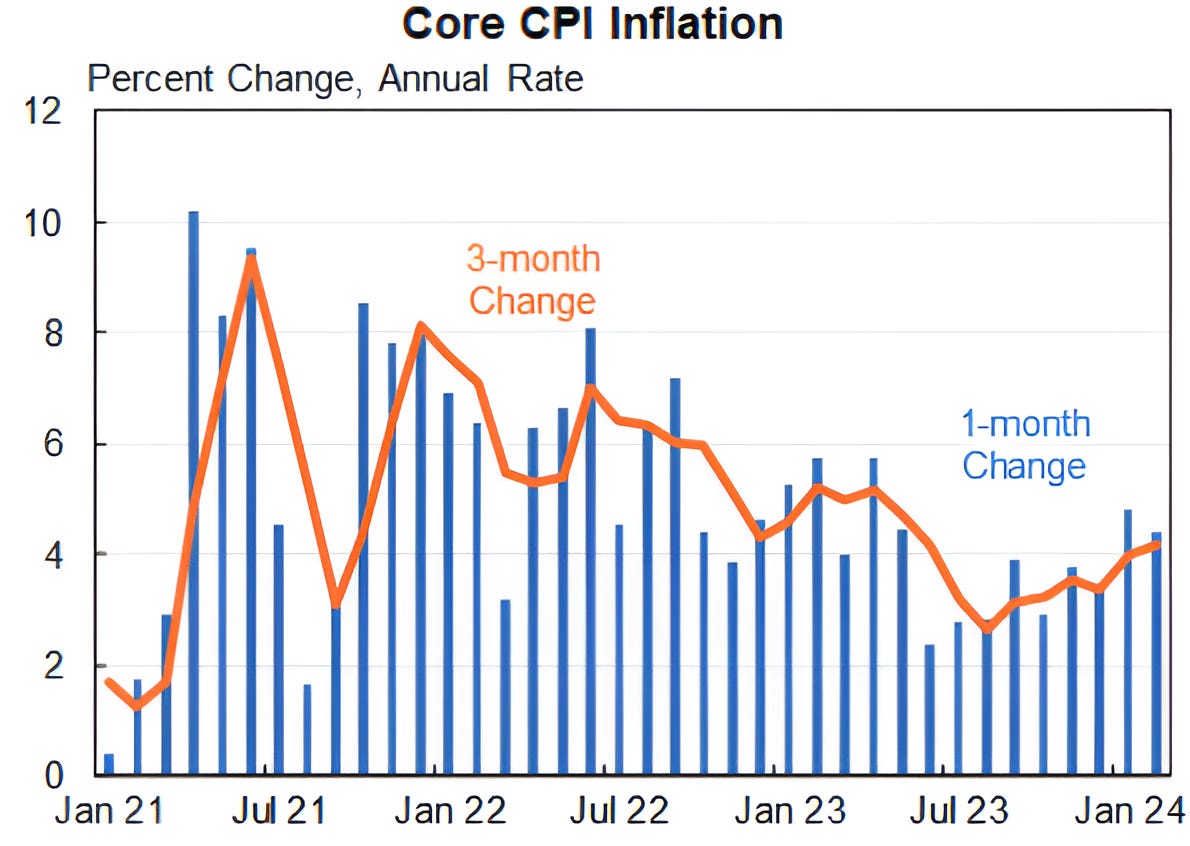
On Tuesday, the most recent batch of Consumer Price Index (CPI) US Inflation data was released.
While I don’t love annualizing monthly (or even quarterly) data, this is the same technique that many economists used to indicate inflation was coming down.
By annualizing February’s Core CPI data based on averages of different time frames, the annualized rates were:
1 month: 4.4%
3 months: 4.2%
6 months: 3.9%
12 months: 3.8%
When the annualized figures based on shorter time periods are higher than those over longer-time periods, it is an indication, as can be seen on the chart, that inflation is moving higher.
For perspective, the 3,6 and 12 month rates are higher than any time from 1992-2019.
I would again question why the Fed would be cutting rates in this environment, particularly given the strength in employment.
Markets did take some solace in the fact that wage inflation is easing and in the belief that the housing component (which is the largest portion of core inflation) of inflation will continue to move down.
(This is not a recommendation to buy or sell any security).
Source: TradingView. Through year-to-date 2024.
4. Energy Sector vs. the S&P 500
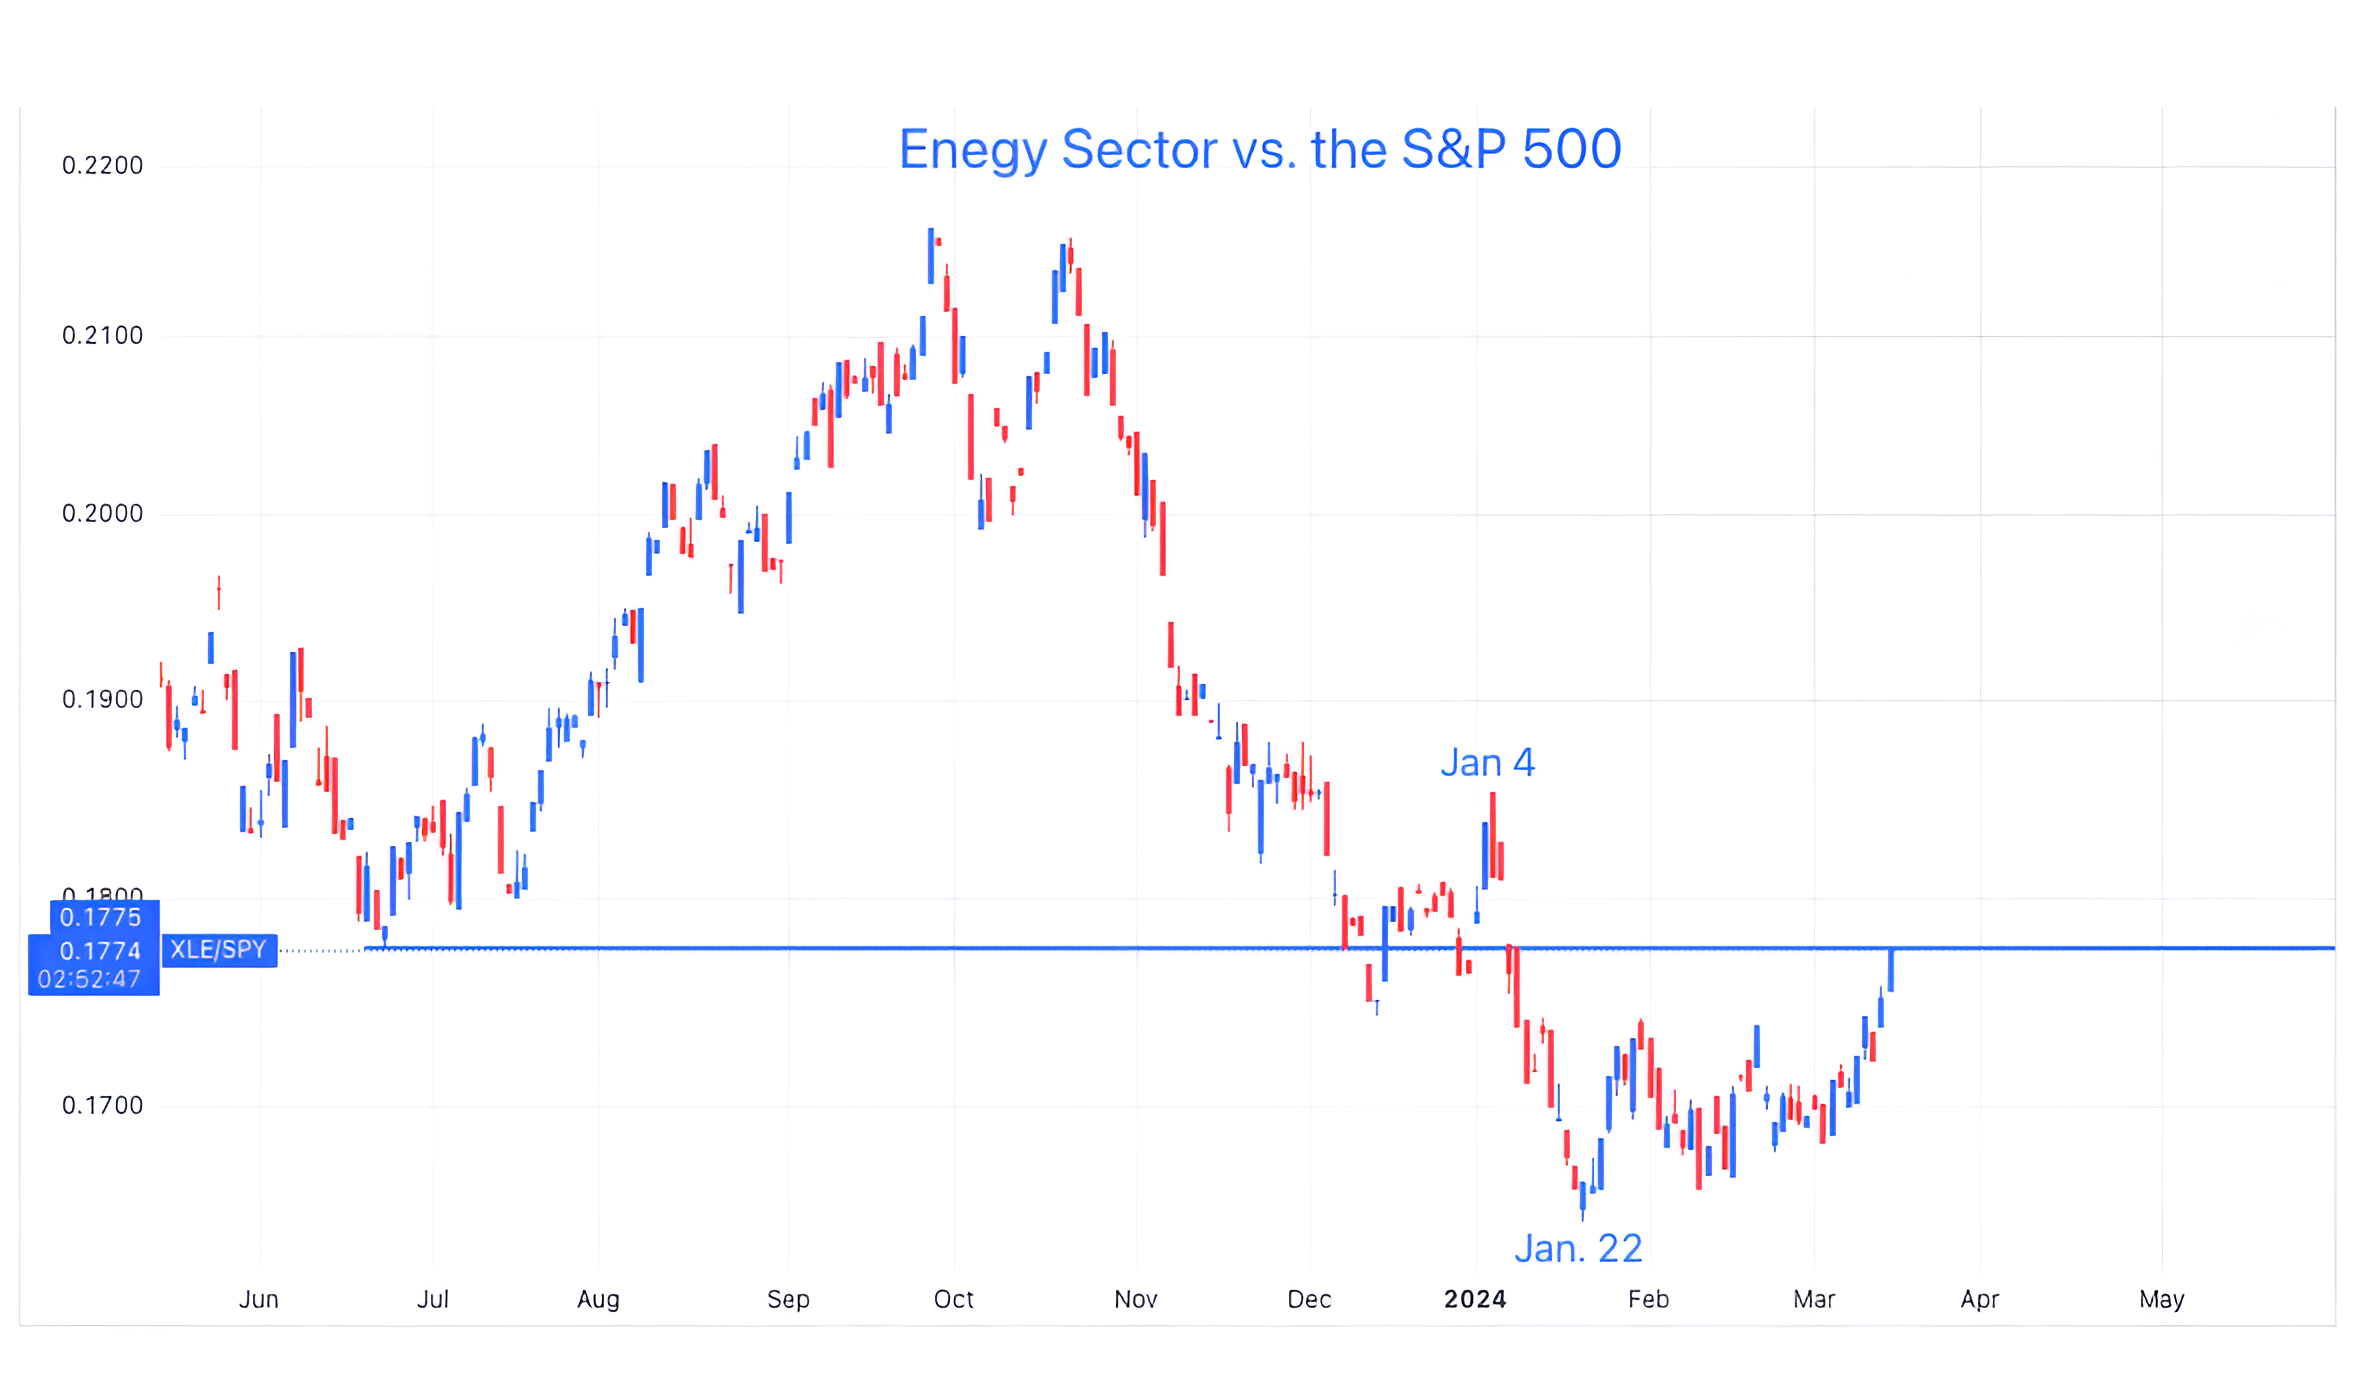
Quietly, over the past 6 weeks, the Energy sector has been outperforming the S&P 500.
At this point, like the charts we showed on Tuesday (here), Energy relative to the S&P 500 seems to be at a critical juncture.
When we look at the price of oil, it seems to be creeping higher.
We will see. But if oil and the energy sector continue to move higher, it will not help the Fed as it considers rate cuts.
(This is not a investment advice and is not recommendation to buy or sell any security).
Source: TradingView. Through year-to-date 2024.
5. We Have an Answer…
In chart 5 of “I Don’t Want to Wait in Vain” (here) we asked the question, “How Much Institutional Memory is in Markets?”
The concept behind the horizontal lines that we draw and the “battlegrounds” that we highlight is that there is “institutional memory” in these areas.
What this means to us is that somebody has bought (in the case of the Nikkei) or sold at these levels and has been waiting to “break even.”
This is investor psychology 101.
As we described it at the time:
“Many believe that after climbing back to a past peak level after a fall, asset prices pause because those that bought at or near peak levels sell with the relief of “getting back to even.”
The question is what holder of the Japanese Nikkei has been waiting 34 years to “get back to even” before selling?”
When we asked the question “How Much Institutional Memory is in Markets?” 3 weeks ago, the Nikkei 225 Japanese equity index had hit its early 1990 high after 34 years.
We wondered whether it would pause at that level.
Over the past three weeks the Nikkei 225 has oscillated around its January 1990 peak level.
We would acknowledge that, in the case of the Nikkei, this does not necessarily represent “institutional knowledge” but rather algorithmic hedge funds that had identified this area as a level to sell.
Nevertheless, it is fun to watch and consider.
(This is not a investment advice and is not recommendation to buy or sell any security)
