


"That don't matter," he said, "'Cause it's all the same."
Despite the "Everything Rally," some of the technical are confusing (chart 1) while the fundamentals look questionable (charts 2 and 3). It may not matter, until it does. Let's dig in...
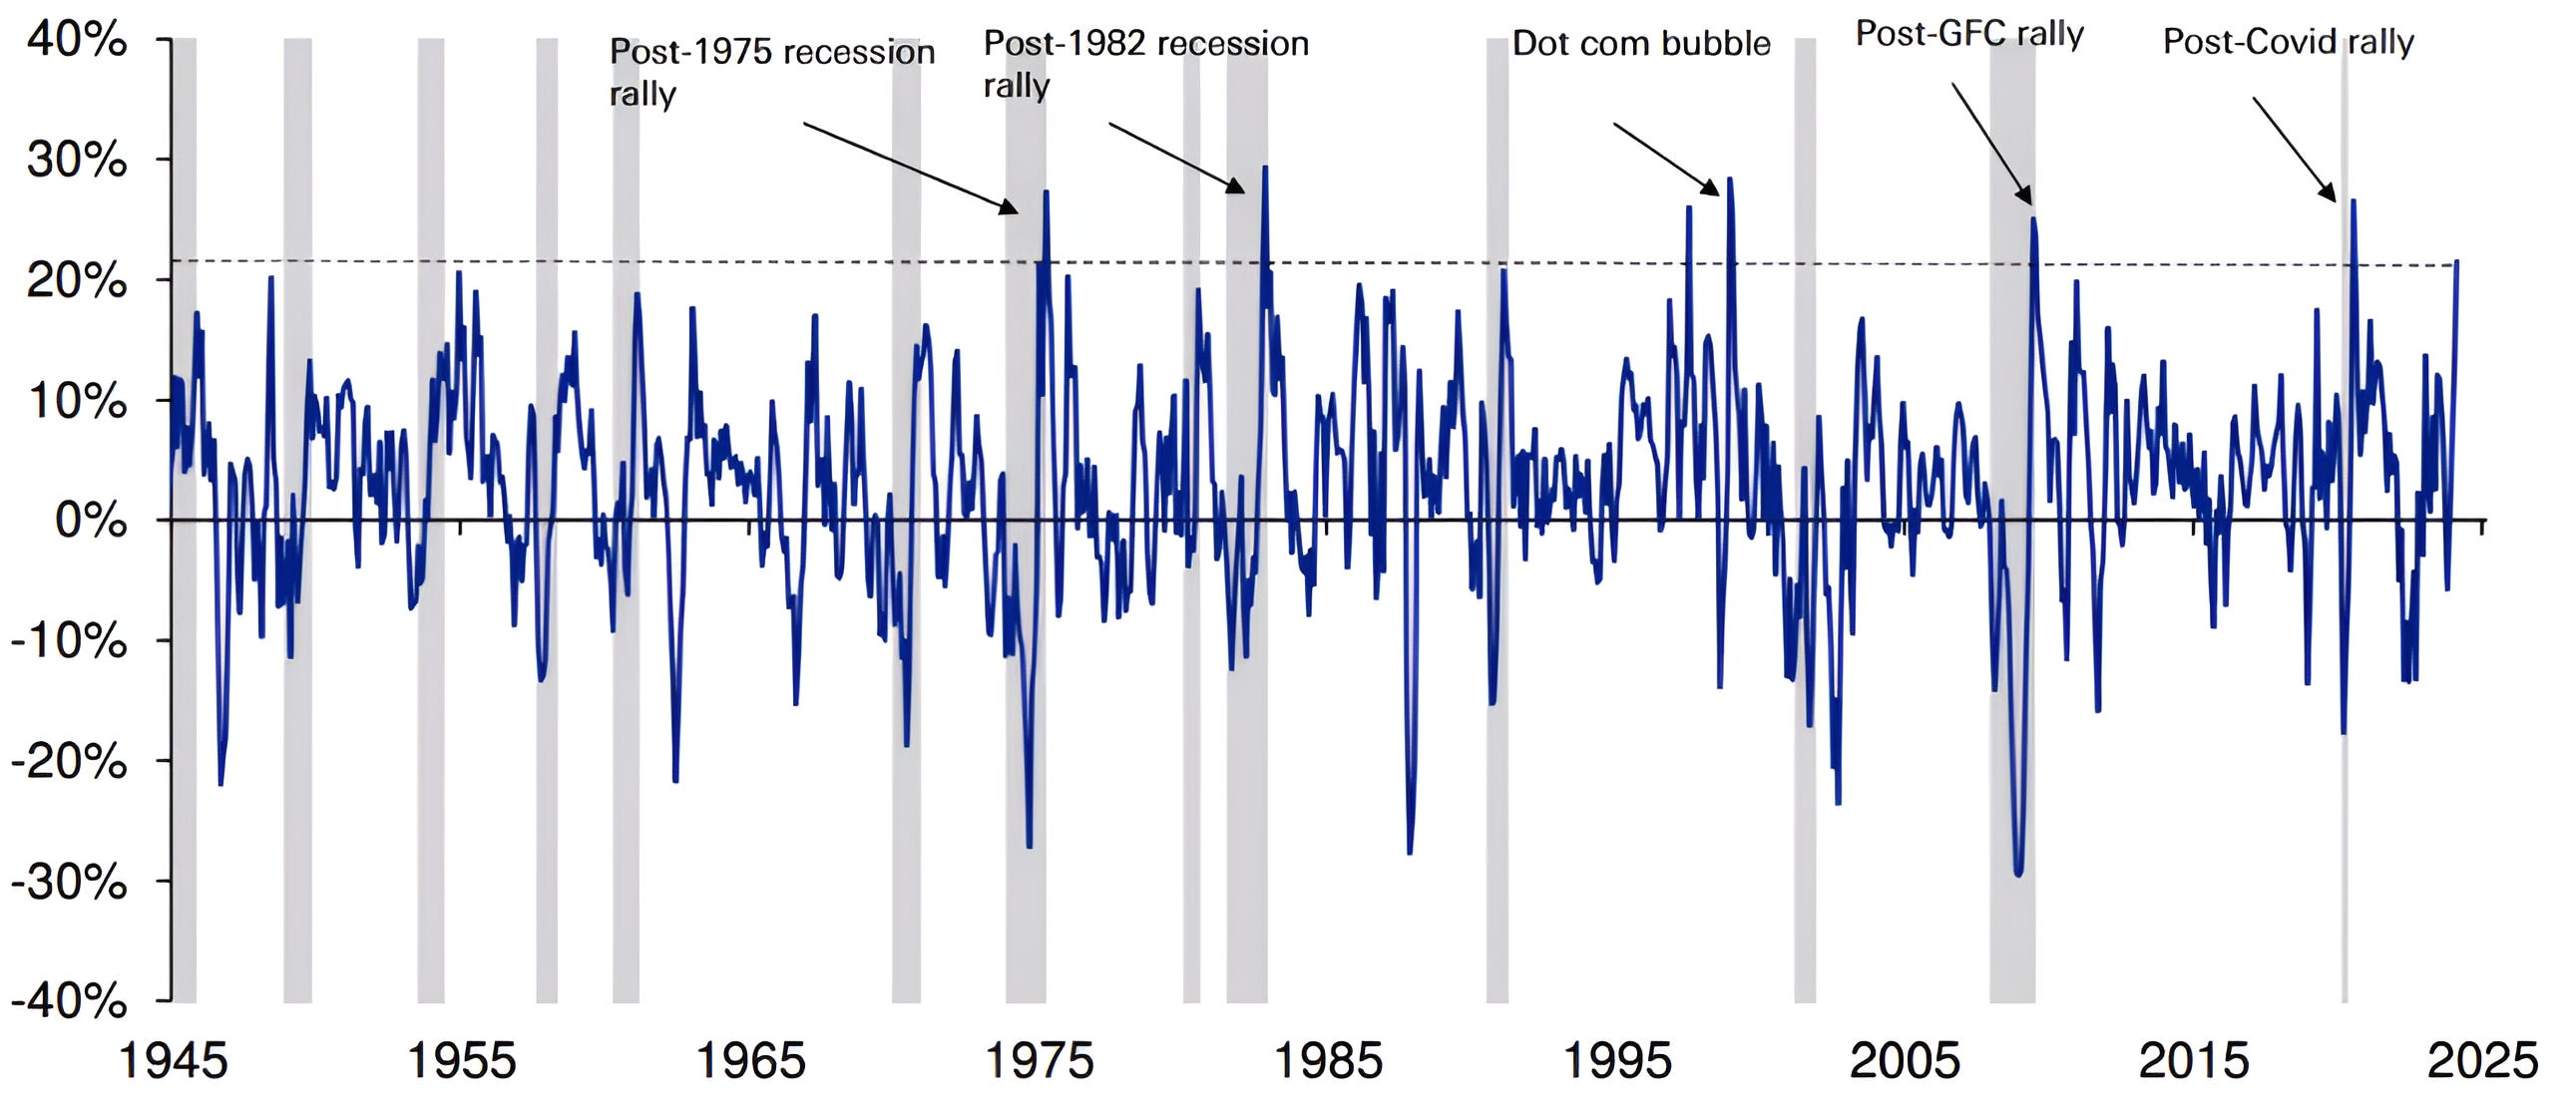
1. Post Recession, a Bubble or Something Else?
In chart 2 yesterday, we presented the times that the S&P 500 has experienced a 20%+ gain in 4 consecutive calendar months. The chart showed that positive momentum continued over the next 6 and 12 months. (Past performance is not indicative of future results).
The chart below from Deutsche Bank shows similar data in a slightly different way by presenting the 4-month “rolling” returns in the S&P 500.
Deutsche Bank attempts to characterize the economic cycle during each instance of 20%+ (actually the line of demarkation is slightly greater than 20%) 4-month returns.
Slightly greater than 20%+ rallies in the S&P 500 (dashed line on the chart below), have occurred in post recession periods, in the post-Long Term Capital Management Period of 1998 (just to the left of the the dot com bubble) and the dot com bubble.
What most of these periods have in common is:
Monetary stimulus; and
The possibility / likelihood of future earnings recovery and growth (“green shoots”).
The current period is not post-recessionary (recessions on the chart below are shaded in grey) and while we don’t see the current period as a bubble, there are characteristics of the current period that are reminiscent (careful word choice) of the 1998 to 2000 period.
In response to the collapse of Long Term Capital Management, the fear of contagion risk and a 20%+ drawdown in the S&P 500, the Fed provided significant stimulus in 1998.
Over the past two years, there has been significant fiscal stimulus and what we have referred to as “stealth” stimulus from the Treasury that has offset at least a portion of the Fed’s tightening measures. (see Chart 4)
These stealth measures have included using draining the Treasury’s General Account (“TGA”) during the debt ceiling debate and more recently by using its Reverse Repo (“RRP”) account to buy Treasuries (quasi QE) (see chart 4). (We also wrote about stealth liquidity here).
The second part of these past rallies has been based on the expectation for future earnings growth / green shoots.
This is also a characteristic of the current rally.
We have shown the “green shoots” in earnings in some industries (chart 3 here) and throughout earnings season expectations for AI related sectors were dramatically raised.
While the S&P 500 dot-com bubble peaked at a level of 1550 in the S&P 500 in March 2000, it is less well remembered that in late August / early September, the index had climbed back to 1530 (~1.5% below) before collapsing as earnings began to significantly miss lofty expectations.
In other words, it was a combination of heightened earnings expectations and large misses that ultimately popped the dot-com bubble.
While we have questioned earnings expectations during the current period and do so again today in chart 2, we do not currently see signs large misses.
Although we are not expecting a significant drawdown, given that the market is trading at 21x 2024 expected earnings, in our view, further appreciation is likely more dependent on earnings growth than multiple expansion.
Throughout this period, we have remained invested but given fundamentals (charts 2 and 3) and valuation have maintained put spreads within our portfolios.
(This is not a recommendation to buy or sell any security, it is not investment advice).
Source: Deutsche Bank. Through year-to-date 2024.
2. S&P 500 Earnings Growth
The chart below shows the Actual and Estimated S&P 500 year-over-year quarterly earnings growth.
First, the good news, at the beginning of Q4 2023 earnings season (finishing now), the expectation was that earnings would decline by 2%.
With 97% of companies having reported, Q4 S&P 500 earnings have grown 3.7%. In other words, better than expected.
That said, during earnings season companies cut their Q1 expectations by 2.2%. Hopefully, this is a case of lowering the bar in order to leap over it.
Our concern is not with Q1 expectations, but with Q2 and beyond.
In Q2 analysts are expecting nearly 9% year-over-year growth and 8% sequential (quarter-over-quarter) growth.
However, the real challenge is the 17% expected growth in Q4 and 15% growth in Q1 2025.
It is never easy to tell the assumptions that go into these aggregated figures, but in our view, they will be difficult to achieve.
During the current earnings season, we have noticed that as analysts have cut Q1 earnings, they have raised Q4 expectations. This has helped keep the full year 2024 earnings level steady in the $242-243 zone.
In our view, S&P 500 2024 earnings will likely be closer to $230-235.
However, if near-term earnings expectations come down slowly while future future earnings are padded (in the same way that we have seen with Q1 expectations moving down and Q4 expectations moving higher), it may not matter.
That said, with a market trading at 21x 2024 expected earnings, an earnings miss or significant recalibration of future expectations may have a meaningful impact on price.
(This is not a recommendation to buy or sell any security and is not investment advice)

Source: FactSet. Through March 1, 2024.
3. Small Cap Earnings
Yesterday, we showed that after 2+ years and several attempts, the Russell 2000 Small Cap Index was moving above its trading range.
Today, we wanted to look at the Small Cap Q4 earnings.
On October 1, Russell 2000 Q4 earnings growth was expected to be 4.7%, by January 1 (prior to earnings season), the expectation had moved to a decline of 11%.
With approximately two thirds of the Russell 2000 Small Cap Index having reported, year over year earnings growth is now expected to fall 13%.
Given the 1.5% decline in sales and the 13% drop in earnings, the majority of the earnings decline can be explained by lower margins / higher expenses.
We often write that the Small Caps are sensitive to the US economy.
With that in mind, we find it notable that in a period of 5-6% US nominal growth (real growth + inflation), Small Cap companies were not able to grow sales (which often correlate with nominal gdp growth). Challenging sales growth was prevalent across sectors with healthcare the exception.
(This is not investment advice).

Source: Strategas. IBES, Refinitv. Through year-to-date 2024.
4. Stealth Stimulus Revisited
Along with rate hikes, the Fed and Treasury have been using three facilities to manage liquidity: Quantitative Tightening, the Treasury General Account and Reverse Repo facilities.
Starting with the the Financial Crisis the Fed has bought Treasury securities and Mortgage Backed Securities through different Quantitative Easing (QE) programs to reduce yields and to stimulate investment and growth (the Fed funds generally impacts short-term yields).
These purchases led the Feds balance sheet to grow from $900 billion in 2006 to nearly $9 trillion in mid-2022.
Since mid-2022, the Fed has been reducing the size of its balance sheet through Quantitative Tightening (QT) (orange bars below).
In the past, Quantitative Tightening has generally been consistent with periods of equity drawdowns. (Past performance is not indicative of future results).
However, over the past year, the Fed’s Quantitative Tightening was offset first by spending from the Treasuries General Account (TGA) (green bars) (the spending is not seen on the chart, but discussed below) and later by the use of the Reverse Repo (RRP) facilities.
In late March 2023, the US hit its “debt ceiling.”
As an increase to the “debt ceiling” was debated in Washington, the Treasury used its General Account (TGA) to provide liquidity.
By May 2023, when an agreement was reached on the debt ceiling (the new debt ceiling is no debt ceiling), the TGA was essentially drained and needed to be refilled.
Refilling the TGA and Quantitative Tightening (the upper portion of the chart) would drain liquidity from the US economy.
Since May 2023, the Treasury has used excess reserves from money it printed in 2020 / 2021 in response to covid that was sitting dormant in the Reverse Repo (RRP) account (bottom of the chart) to offset the tightening impact from Quantitative Tightening and refilling the Treasury General Account.
As a result, while the Fed has talked tight, when combined with Treasury operations, the tightness has been offset.
When fiscal spending (which has been supported by the no debt ceiling agreement) is added to the neutralized monetary policy, the US has been applying net (stealth) stimulus to the economy.
As the RRP is expected to be completely drawn down over the next two months, the Fed is now considering slowing its Quantitative Tightening (Tapering the Tightening).
We believe that this “Stealth Stimulus” (which we have been highlighting since the beginning of the year) has helped support the Everything Rally.
(This is not a investment advice and is not recommendation to buy or sell any security).

Source: GLJ Research, Bloomberg. Through year-to-date 2024.
5. Super Tuesday
We’ve shown a number of seasonality charts this year.
As a reminder, US equity market seasonality, in general, is based on the 4 years of the US Presidential election cycle.
In 2022, the mid-term election year, seasonality was directionally accurate but magnitudely light (the smoothed averages did not capture the large drops and recoveries in the equity market).
The pre-election year has historically been the strongest of the election cycle and is typically punctuated by a Q4 rally. 2023 was consistent with history and did not disappoint.
In general (as we have shown), February in election years has been the weakest month.
However, in years when the President is seeking re-election, as the chart below shows, weakness on average has been pushed back to March. (Past performance is not indicative of future results).
While its possible for a sell-off to erase the year-to-date gains (as it has on average at this time of year during US Presidential Election Years when the incumbent is running), this would represent a 6% drawdown and is larger than our current correction expectation.
If a correction of this size were to occur, depending on accompanying factors, we would likely evaluate it as a buying opportunity.
On average, after April in US election years when the President is seeking re-election, equity markets have been strong. (This is consistent with the technical work we’ve recently been showing). (Past performance is not indicative of future results).
That said, as we always say when we show seasonality, we do so for informational purposes. We want to be aware, however, our views are not based on seasonality or on any single indicator.
(This is not a investment advice and is not recommendation to buy or sell any security).
