


Is This the Soft Landing?
We have continued to see and show various themes, sectors and regions emerge - while it may be transient, is this indicative of the soft, albeit seemingly bumpy landing? Let's dig in...
One of our themes or expectations for this year was that there would be a rotation from the Magnificent 7 into other areas of the equity market.
In our first piece on this platform “Charts and Thoughts to Start 2024,” (here) our 4th chart was titled “After a Year of Dramatic Outperformance, are the Magnificent 7 Done?”
While the Magnificent 7 are not necessarily “done,” 2 trends seem to be emerging:
1. Magnificent 7 performance in 2024 is being driven almost all by Nvidia - some have joked that the group should now be called “the Fab 4” (see chart 2); and
2. The market as we have been trying to highlight is broadening out beyond technology and AI. (see charts 1, 3, 4 and 5)
We tried to highlight this with the “It’s Not Just AI” charts last Friday (here) that we have continued through today.
In chart 2 of that email, we showed the ARK Next Generation Internet ETF (ticker: ARKW); in chart 5 on Tuesday’s email (here) we showed the Biotech ETF (ticker: IBB) and in chart 4, below, we show the On-line Retail ETF. (This is not a recommendation to buy or sell any security).
These charts look nearly identical.
These areas of the market were disproportionately negatively impacted (said differently - essentially crashed) in 2021 - 2022, when the Fed tightened and 10-Year Treasury yields moved higher.
Despite the 10-Year Treasury yield remaining elevated in the 4.2%-4.3% zone, these formerly beaten down portions of the equity market - in industries that have little to do with one another - are moving higher and breaking above former ceilings. This, in our view, is bullish.
What the market may be saying, in our view, is that these companies have learned to navigate the higher rate world, fundamentals are improving, and / or valuations have hit a level (even relative to 10-Year Yields) where buyers have stepped in sensing opportunity.
Either way, we believe this is constructive and reflects a broadening out of participation across industries.
This brings me to my point - and the title of today’s note - it is based on something I read from Krishna Guha at Evercore that has been rattling in my mind:
What if the “soft-landing” is here?
Even if there are imbalances, even if it is temporary.
What would it look like, how would it feel?
My best guess is that the equity market would be doing exactly what it’s doing - moving higher and rotating (from Mag 7 to elsewhere) with more sectors and industries participating and joining the party.
1. The Broadening
The Equal Weight S&P 500 (below) (“the average large cap stock”) - after moving above its late-2022 - 2023 ceiling is at its highest level in 2-years.
In our view, this is an indication that the rally is broadening.
Looking at the chart below, one characteristic that I view as “healthy” is the sideways move in from mid-December 2023 - mid-January 2024.
Buyers and sellers during this period traded shares and had the market equivalent of a debate over the future direction of the index.
Those with less conviction (weak hands) sold and, as a result, in our view (compliance makes me write this), many of today’s owners are long-term holders that didn’t sell when others did.
The debate was resolved upwards with strong, convicted long-term ownership (our characterization).
It should be noted that while the S&P 500 trades at a forward PE of 21x which is over 1 standard deviation above the long-term mean and the highest level outside of the dot-com and covid bubbles (see chart 3 here) the Equal Weight S&P 500 trades at 17x forward earnings which is elevated, but not 1 standard deviation above average. (This does not consider relative earnings growth between the indexes).
(This is not a recommendation to buy or sell any security, it is not investment advice).

Source: TradingView. Through year-to-date 2024.
2. Has the Magnificent 7 Become the Fab 4?
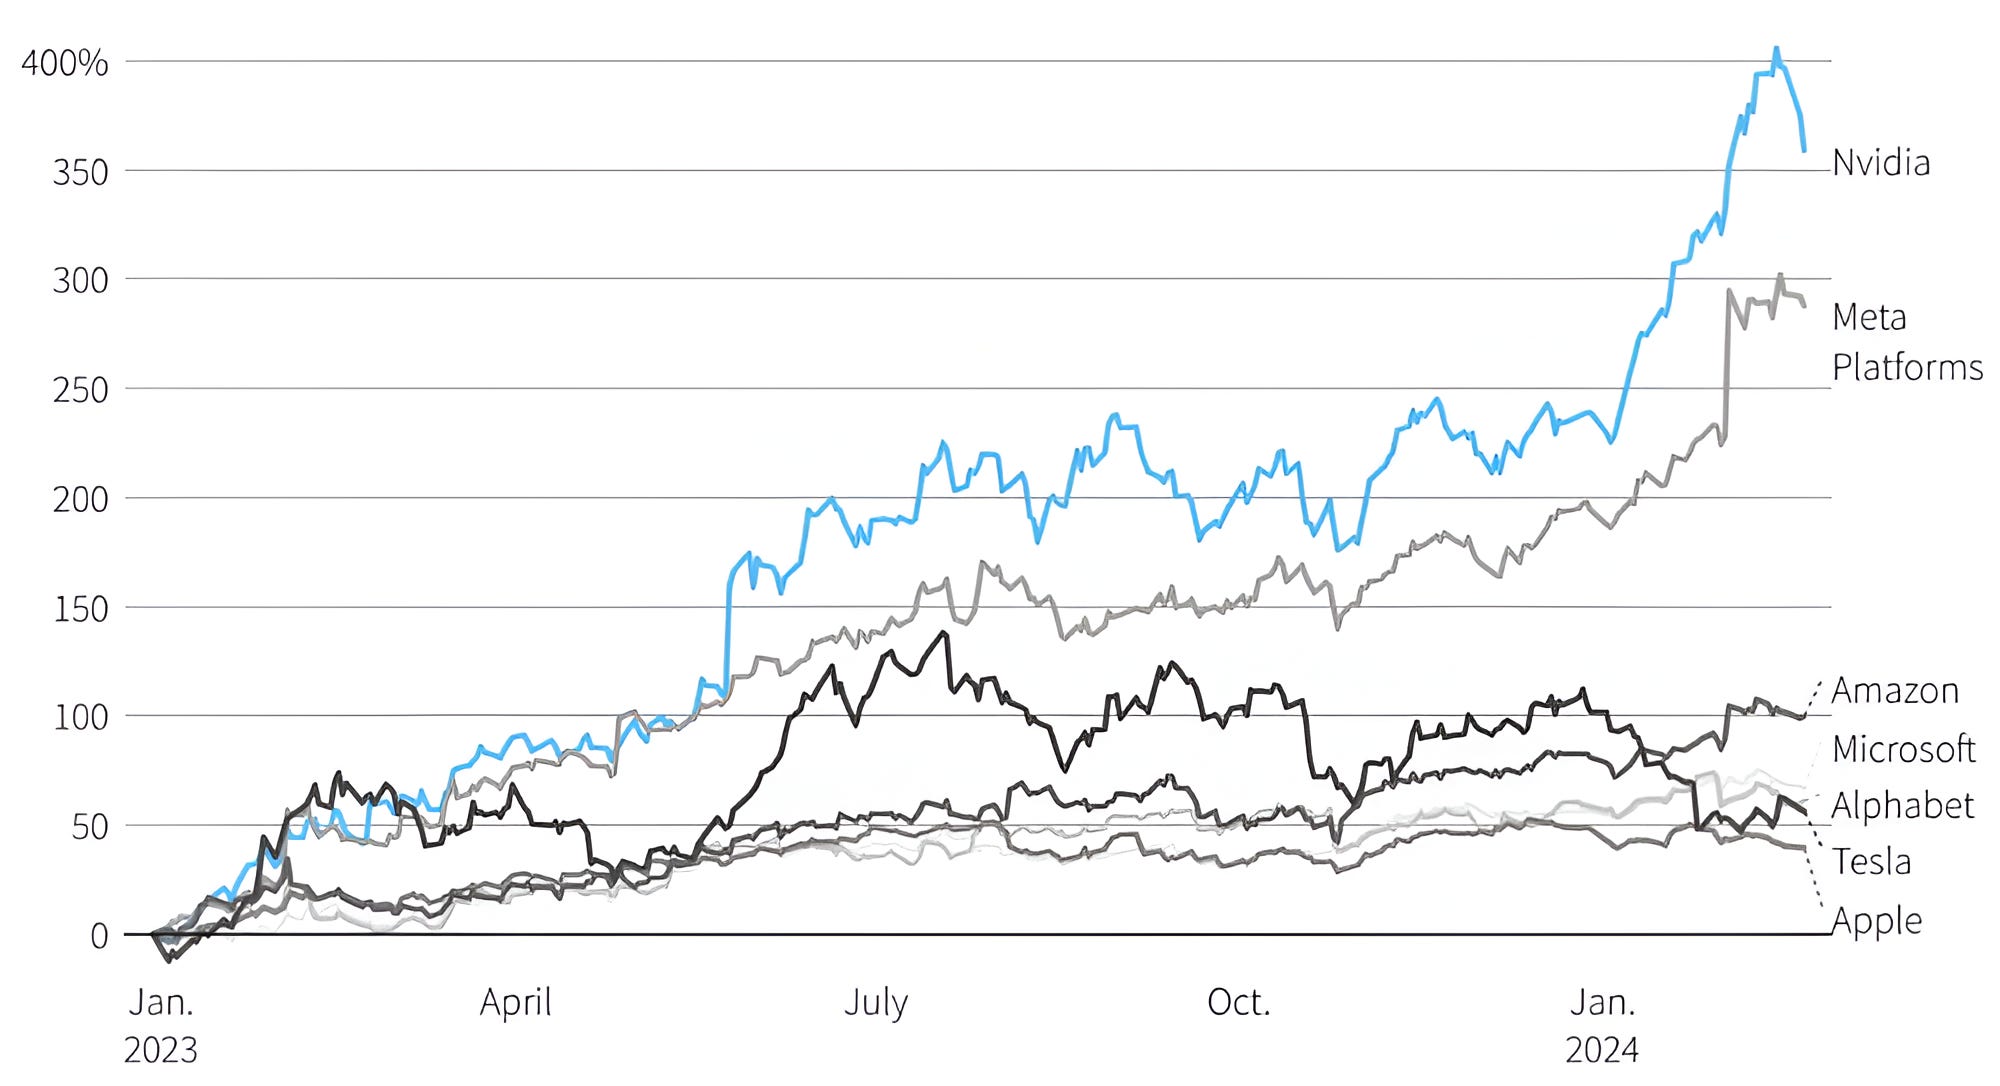
When looking at the chart below of the indexed performance of the Magnificent 7 beginning in January 2023, we see a few messages:
Nvidia and Meta (Facebook) have done the heavy lifting for the group;
During 2024 (if you look closely), all of the returns have come from Nvidia, Meta, Amazon and Microsoft (the Fab 4); and
This year, Alphabet (we wrote about it in chart 2 here), Apple (we will try to look at this tomorrow) and Tesla have all underperformed the market.
(This is not a recommendation to buy or sell any security and is not investment advice).
Source: LSEG. Through Feb. 20, 2024.
3. Is this an Inflection Point in Industrial Real Estate?
While we often only look at price charts, fundamentals (earnings, earnings growth and valuation) underpin our views.
I found this chart presented by Ryan Grabinski at Strategas (the best independent macro research team - by far) thought provoking.
This chart may be the fundamental representation of what is happening behind the price movements in several of the sectors, themes, regions and industries we are, and have been, showing.
It shows the Top 10 S&P 500 industries with the greatest upward revisions to 2025 earnings estimates.
5 of the 10 industries with the greatest upwards earnings revisions to 2025 earnings estimates are in industrial real estate.
Admittedly, Industrial Real Estate - outside of data centers - has not been on our radar.
To be clear, earnings in these groups have likely been so beaten down that even a small move higher can lead to a meaningful percentage change.
However, for a long-term investor that is looking for an area of the market that is likely cheap on a long-term basis and with earnings inflecting (going from bad to less bad and have probably bottomed), industrial real estate might be worthy of consideration. (We will look at price charts for some of these industries another day).
(This is not investment advice).

Source: Strategas FactSet. Through year-to-date 2024.
4. Green Shoots?
We show charts of ETFs not to recommend buying or selling the specific ETF, but because they often capture themes and allow us to interpret the attitudes of equity investors towards segments of the market.
While many will look at economic data and corporate fundamentals and draw conclusions, I am a believer that the interpretation of that data by market participants can often be as important as the data itself.
Why?
Markets discount the future while the economic and fundamental data is in the past. As a result, the market movements reflect how past information impacts, changes and / or confirms future expectations.
Within this context, the chart below of On-line Retail ETF (ticker: IBUY) is interesting for a couple of reasons:
It is important to note that the top 10 holdings of this ETF do not include Amazon or Tesla (this is not Mag 7 in disguise). It’s holdings include Affirm (on-line payments), Carvana, Expedia, and Hims (on-line perscriptions) among others. The point is that this is a different corner of the market.
This looks very similar to the ARK Next Generation ETF (chart 2 here) and the Biotech ETF (chart 5 here) - these have little to do with each other and very little over lap in holdings, but they’re all acting the same way.
While we could have made the same statement about very little overlap in holdings, but look like each other in 2021 and 2022, the defining characteristic of each at that point was high valuation with a disproportionate share of earnings way out into the future.
Because of the way that stocks are valued, discounting future cash flows by the “risk free weight” made these groups very sensitive to the move higher in 10-Year US Treasury Yields which is considered the risk free rate (in many models).
In our view, there is a little obvious commonality in these groups today other than that investors are considering that the shares are attractive based on future prospects.
To me, this is reminiscent of when Ben Bernanke used the expression Green Shoots in March 2009 (here) to say things were improving.
At the time, he meant that 2010 and 2011 earnings would reflect recovery and equity markets began to rally from their depths.
While the S&P 500 and Nasdaq 100 are at all time highs, many of these smaller groups - On-line Retail, Biotech, Next Generation Internet - have been moving sideways near their lows for 2 years.
The move above their respective past ceiling levels (the higher horizontal blue line in the chart below), in our view, may be investors sensing “green shoots” (future earnings recoveries) for these sectors.
Maybe investors are sensing an inflection in earnings in these groups similar to what we have shown in chart 3 with Industrial Real Estate. Green Shoots.
(This is not a recommendation to buy or sell any security and is not investment advice).

Source: TradingView. Through year-to-date 2024.
5. The Granolas
Wall Street loves acronyms and apparently the Europeans do too (maybe they’re jealous?).
The Granola stocks are GSK, Roche, ASML, Nestlé, Novartis, Novo Nordisk, L’Oréal, LVMH, AstraZeneca, SAP and Sanofi. (This is not a recommendation to buy or sell any security)
6 drug / pharma companies (GSK, Roche, Novartis, Novo, AstraZeneca and Sanofi); two tech ASML and SAP; two beauty fashion (L’Oréal and LVMH) and one food (Nestlé).
While these companies are not in the same sector or based in the same country, one common thread is that they are not levered to the European economy.
It is also notable that these shares complement the more industrial shares that make up the German Dax which we highlighted in chart 5 here.
The breakdown of the different sectors and the reference to the German Dax is another indication to us of the broad based nature of the current equity market rally.
It is not based on geography (we have highlighted Japan) and it is not based on sector.
As we look at the chart of the Vanguard European Equity (ticker: VGK), there are a couple of points we want to make:
It’s at a new 52-week high which, in our view, is constructive;
I have drawn in an inverted head and shoulders pattern (the three light blue curves) - theres a good explanation here - that also currently seems constructive.
The European equity ETF is traded in US $ which means it incorporates both share prices and currency (Euro, Swiss Franc, GB Pound, Krona) into price. Despite this, somehow the floors and ceilings (horizontal blue lines) in the price history are incredibly well defined. This fascinates me and is why I view, show and respect the charts.
Looking to Europe for diversification (replace your Apple with Granola? apologies) may be worthy of consideration.
(This is not a investment advice and is not recommendation to buy or sell any security).
