Don't Stop Me Now, 'Cause I'm Having a Good Time!
Despite being up over 4% in a month that many expected would exhibit weakness, the S&P 500 continues to grind higher. Let's dig in...
1. When November, December, January and February Are All Positive = Bullish*
For the 15th time since 1950 (20% of the time), the S&P 500 has been positive in November, December, January and (presumably) February.
(Hopefully, with the S&P 500 up 4% this month and 2 trading days left, this post will not jinx February’s performance.)
In the past 14 instances when these 4 consecutive months have all been positive, over the final 10 months of the year, the S&P 500 has been positive 100% of the time with an average return of 14.9% (median return 13.4%).
(Past performance is not indicative of future results.)
Two things I want to mention (that may seem to contradict one another, but I need to mention both anyway):
There are many characteristics of this cycle that fall into the “this time is different” category.
Whether its the inverted yield curve or leading economic indicators flashing economic warning lights with no apparent recession or valuations that have remained elevated despite little earnings growth.
Could this be the first time the S&P 500 is negative with these 4 consecutive months positive? It may require a significant catalyst (recession or unknown unknown).
There were a number of bullish charts such as this one last year at this time and every fundamental bone in my body rejected them as too simplistic or simply wrong.
While I wouldn’t solely rely on these historical precedents as market guides (past performance is not indicative of future results), I have also learned to respect them.
It is important to remember, momentum is the most persistent factor in equity markets (more than valuation, cap size (small vs. large), style (growth vs. value), etc.).
*Past performance is not indicative of future results.
(This is not a recommendation to buy or sell any security, it is not investment advice, please do your own analysis).
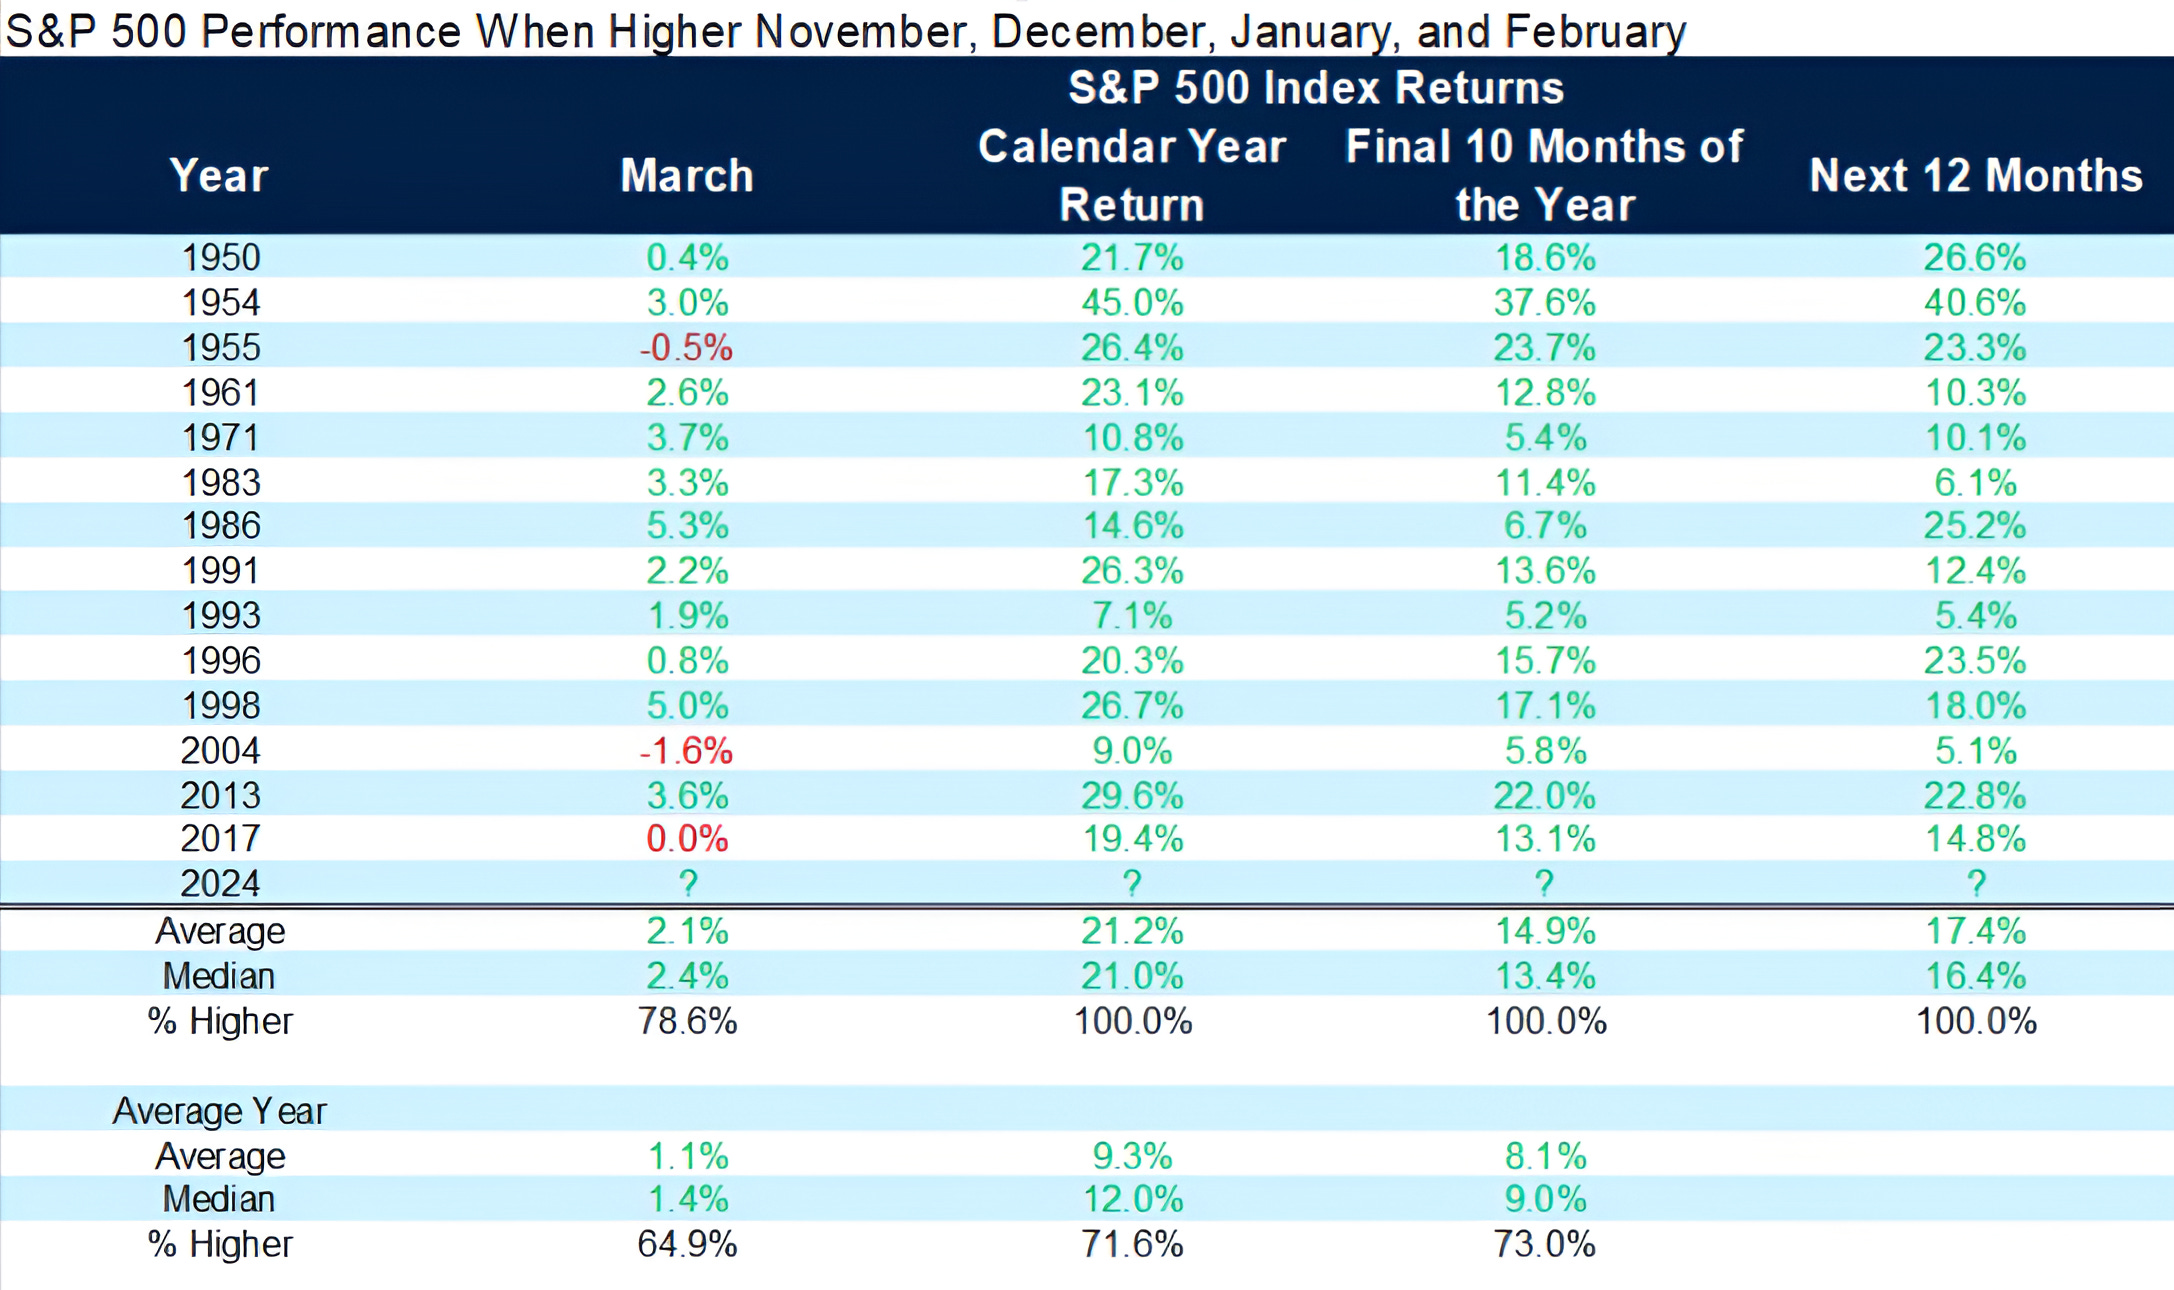
Source: FactSet, Carson Investment Research. Through year-to-date 2024.
2. What’s Eating Gilbert Google?
The title of this one may be a bit of a reach - apologies - but something strange is a foot at the worlds largest search engine company (officially Alphabet).
For full disclosure, I have been a long time Google bull.
About 10 years ago, I wrote a piece about Google and I called it a “desert island stock.” If I were going to a desert island for 5 years, what one stock would I want in my portfolio? (My answer was Google).
(This is not a recommendation to buy or sell Alphabet shares or any other security).
When the company changed its name to Alphabet, it was to bring transparency and focus to its different divisions: Search; Android; YouTube (I will write about this below); Waymo (autonomous vehicles); Cloud; Maps (including Waze); Bard and Gemini (AI); Gmail; and Other bets (venture / moonshot / investment division).
In general, Google is #1 or #2 in the divisions in which it competes. (The exception is cloud, where Google is behind Amazon and Microsoft).
The recent 10% sell-off in Alphabet shares while the market has moved higher is, in our view, due to AI:
Competition from Microsoft / ChatGPT (Microsoft owns 49% of ChatGPT) CoPilot will impact revenues from search / advertising;
The challenging launches of Google’s own AI products - Bard famously failed at a press conference (here) followed by controversial results from Gemini (here).
These, issues in our view, may be correctable.
All of that said, I wanted to focus on YouTube.
According to Nielsen, YouTube was the top streaming platform for the last twelve months at 8.6% of all minutes and is gaining share (based on this metric).
In 2023, YouTube had approximately $42b in revenues (a combination of advertising and estimated subscriptions), while Netflix, the 2nd largest video platform had 2023 revenues of $34b.
YouTube’s video app generally pays out around 55% of revenues to content creators; whereas Netflix pays to acquire and produce movies and TV shows.
However, the point here is not relative margins, it is that the $23 billion that YouTube paid to creators in 2023 is an incentive for those creators to make higher quality, higher resolution (8k on YouTube), long-form content and this is helping YouTube gain share.
(As an aside, I have been working with 2 very different creator businesses - the fragmentation of media and the creator economy are fascinating - please reach out if you’re interested.)
All of this is a way to say that YouTube is a diamond (in our view) within the Alphabet stable.
Alphabet is expected to earn about $6.00 in 2024 and $7.00 in 2025, shares currently are trading for about $140 (see below).
Alphabet is now at its 2023 ceiling level which is also the 0.786 Fibonacci retracement of the October 2022 to October 2023 sell-off.
If shares were to fall through this level, shares could settle in the $126 (the 0.618 Fibonacci level) - $138 zone where there has clearly been a lot of past buying, selling and consternation.
We will be watching.
(This is not a recommendation to buy or sell any security and is not investment advice).

Source: TradingView. Through year-to-date 2024.
3. Follow-Up on Berkshire and Its Investments (Part 1)
After yesterday’s post on Berkshire Hathaway, I was asked if I had read Warren Buffett’s tribute to Charlie Munger. Although I had, I should have linked it for those that haven’t (here).
I also wanted to take the opportunity to highlight some of Warren Buffet’s commentary on two of its investments": Occidental Petroleum (chart below) and Japanese equities (chart 4).
We have shown oil most recently in chart 3 here.
On Occidental Petroleum specifically, Warren Buffett wrote:
“At year end, Berkshire owned 27.8% of Occidental Petroleum’s common shares and also owned warrants…Though we very much like our ownership, as well as the option, Berkshire has no interest in purchasing or managing Occidental.
We particularly like its vast oil and gas holdings in the United States, as well as its leadership in carbon-capture initiatives, though the economic feasibility of this technique has yet to be proven.”
On US oil production:
“Not so long ago, the U.S. was woefully dependent on foreign oil. In 1975, U.S. production was 8 million barrels of oil-equivalent per day (“BOEPD”), a level far short of the country’s needs.
Further declines in oil production were predicted along with future increases in usage. For a long time, the pessimism appeared to be correct.
And then – Hallelujah! – shale economics became feasible in 2011, and our energy dependency ended. Now, U.S. production is more than 13 million BOEPD.”
He concludes by writing:
“Under Vicki Hollub’s leadership, Occidental is doing the right things for both its country and its owners. No one knows what oil prices will do over the next month, year, or decade.”
(These are Berkshire Hathaway views and do not necessarily reflect ours. This is not a recommendation to buy or sell any Occidental Petroleum shares or any security. This is not investment advice).
Looking quickly at the chart of Occidental (below), $56 looks like an important floor area to hold while $67.50 looks like a near-term ceiling.

Source: TradingView. Through year-to-date 2024.
4. Follow-Up on Berkshire and Its Investments (Part 2)
Another investment that Berkshire Hathaway recently made was in Japan.
Berkshire Hathaway first announced a 5% stake in the 5 largest Japanese general trading companies in August 2020, and followed-up last June by saying that it had increased its investment to an average of more than 8.5% across the group of firms.
Buffett described the investment as:
“Berkshire continues to hold its passive and long-term interest in 5 very large Japanese companies, each of which operates in a highly-diversified manner somewhat similar to the way Berkshire itself is run.”
“In certain important ways, all five companies – Itochu, Marubeni, Mitsubishi, Mitsui and Sumitomo – follow shareholder-friendly policies that are much superior to those customarily practiced in the U.S.”
This last part is key as the shareholder friendly nature of Japanese companies and increased transparency result from the structural policies implemented under (the 3rd arrow of) Abenomics around 10 years ago.
These structural policies (along with Monetary and Fiscal policy - the other two arrows) are beginning to make a significant difference for Japanese shareholders.
The Berkshire Hathaway investment has done very well:
“Our cost for the five totals ¥1.6 trillion, and the year-end market value of the five was ¥2.9 trillion.
However, the yen has weakened in recent years and our yearend unrealized gain in dollars was 61% or $8 billion.”
That said, this may be the most important part of the investment:
“Berkshire has financed most of its Japanese position with the proceeds from ¥1.3 trillion of bonds. This debt has been very well-received in Japan.”
Berkshire was able to borrow ¥1.3 trillion of the ¥1.6 trillion investment at costs ranging from 1% for 3 years and up to 2.5% for 35 years (it was a multi-tranche bond offering).
The dividend yields for each of the stocks that Berkshire purchased was greater than the borrowing costs.
Essentially, Berkshire has made $8 billion while borrowing 80% of the investment amount and essentially being paid to do so (dividends > interest).
This was a master class in investments that unfortunately few could execute.
And…as we know, the Japanese Nikkei (below) eclipsed its 1990 high last week (if you squint, you can see it).
(This is not investment advice).
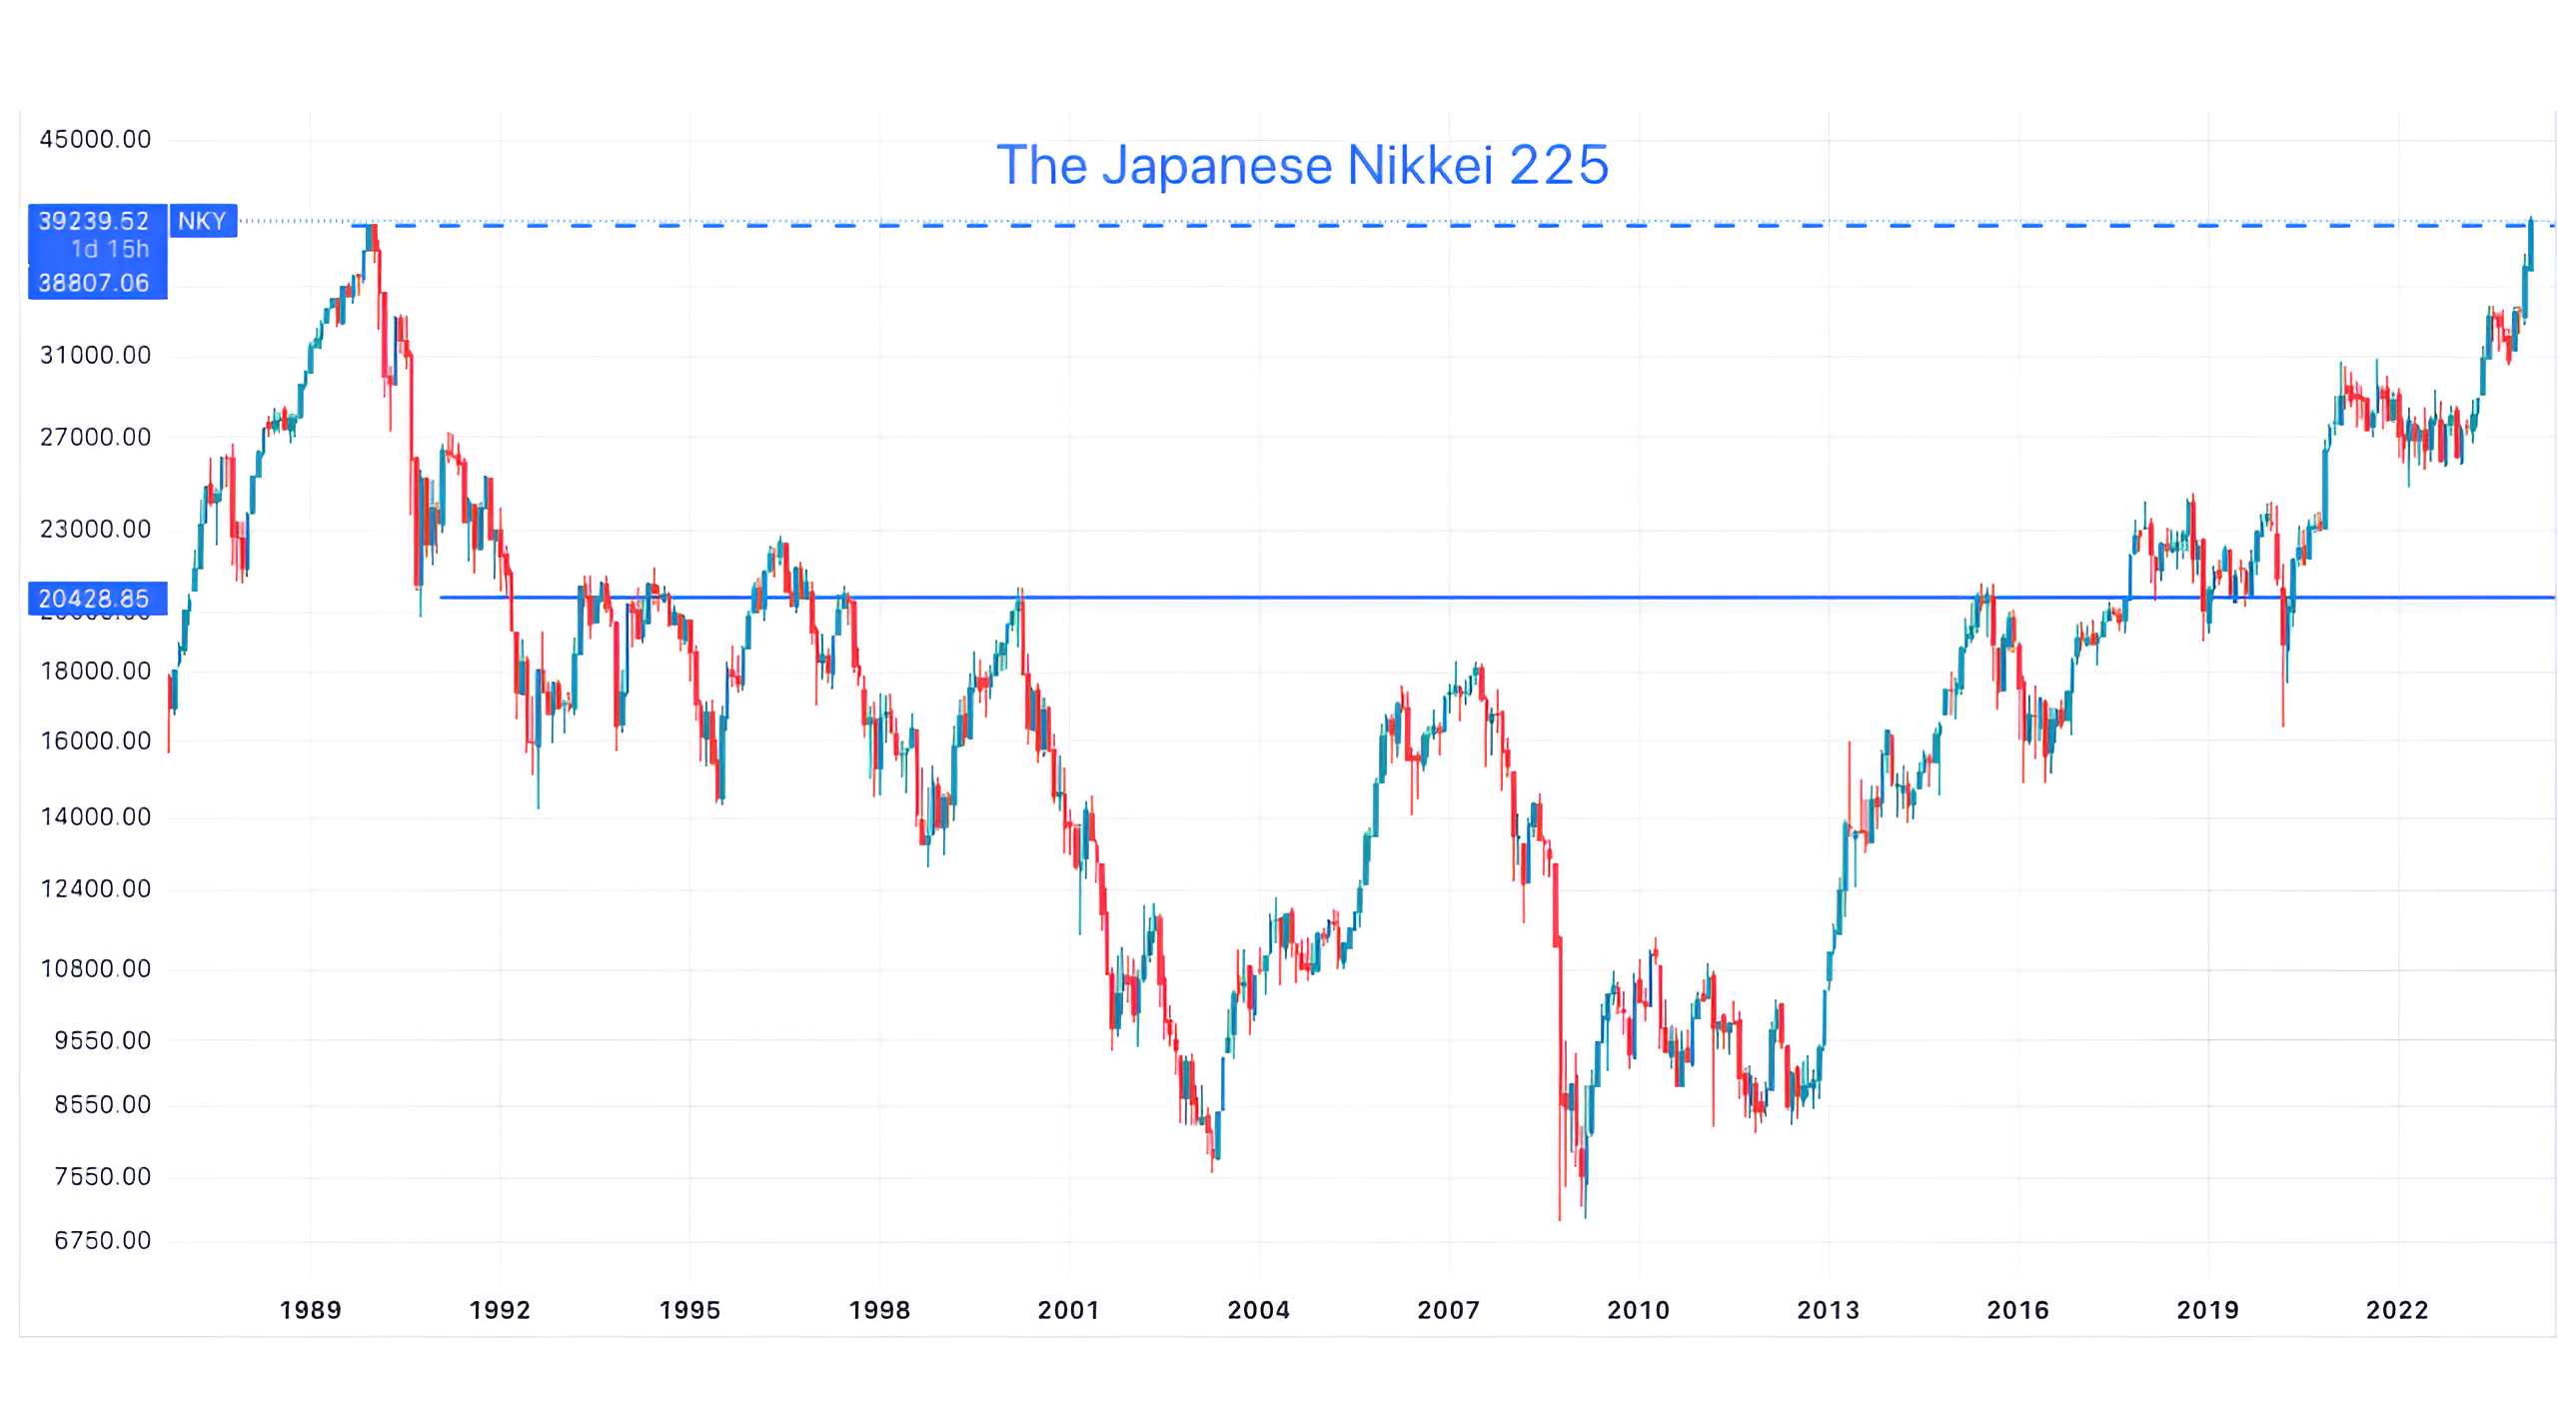
Source: TradingView. Through year-to-date 2024.
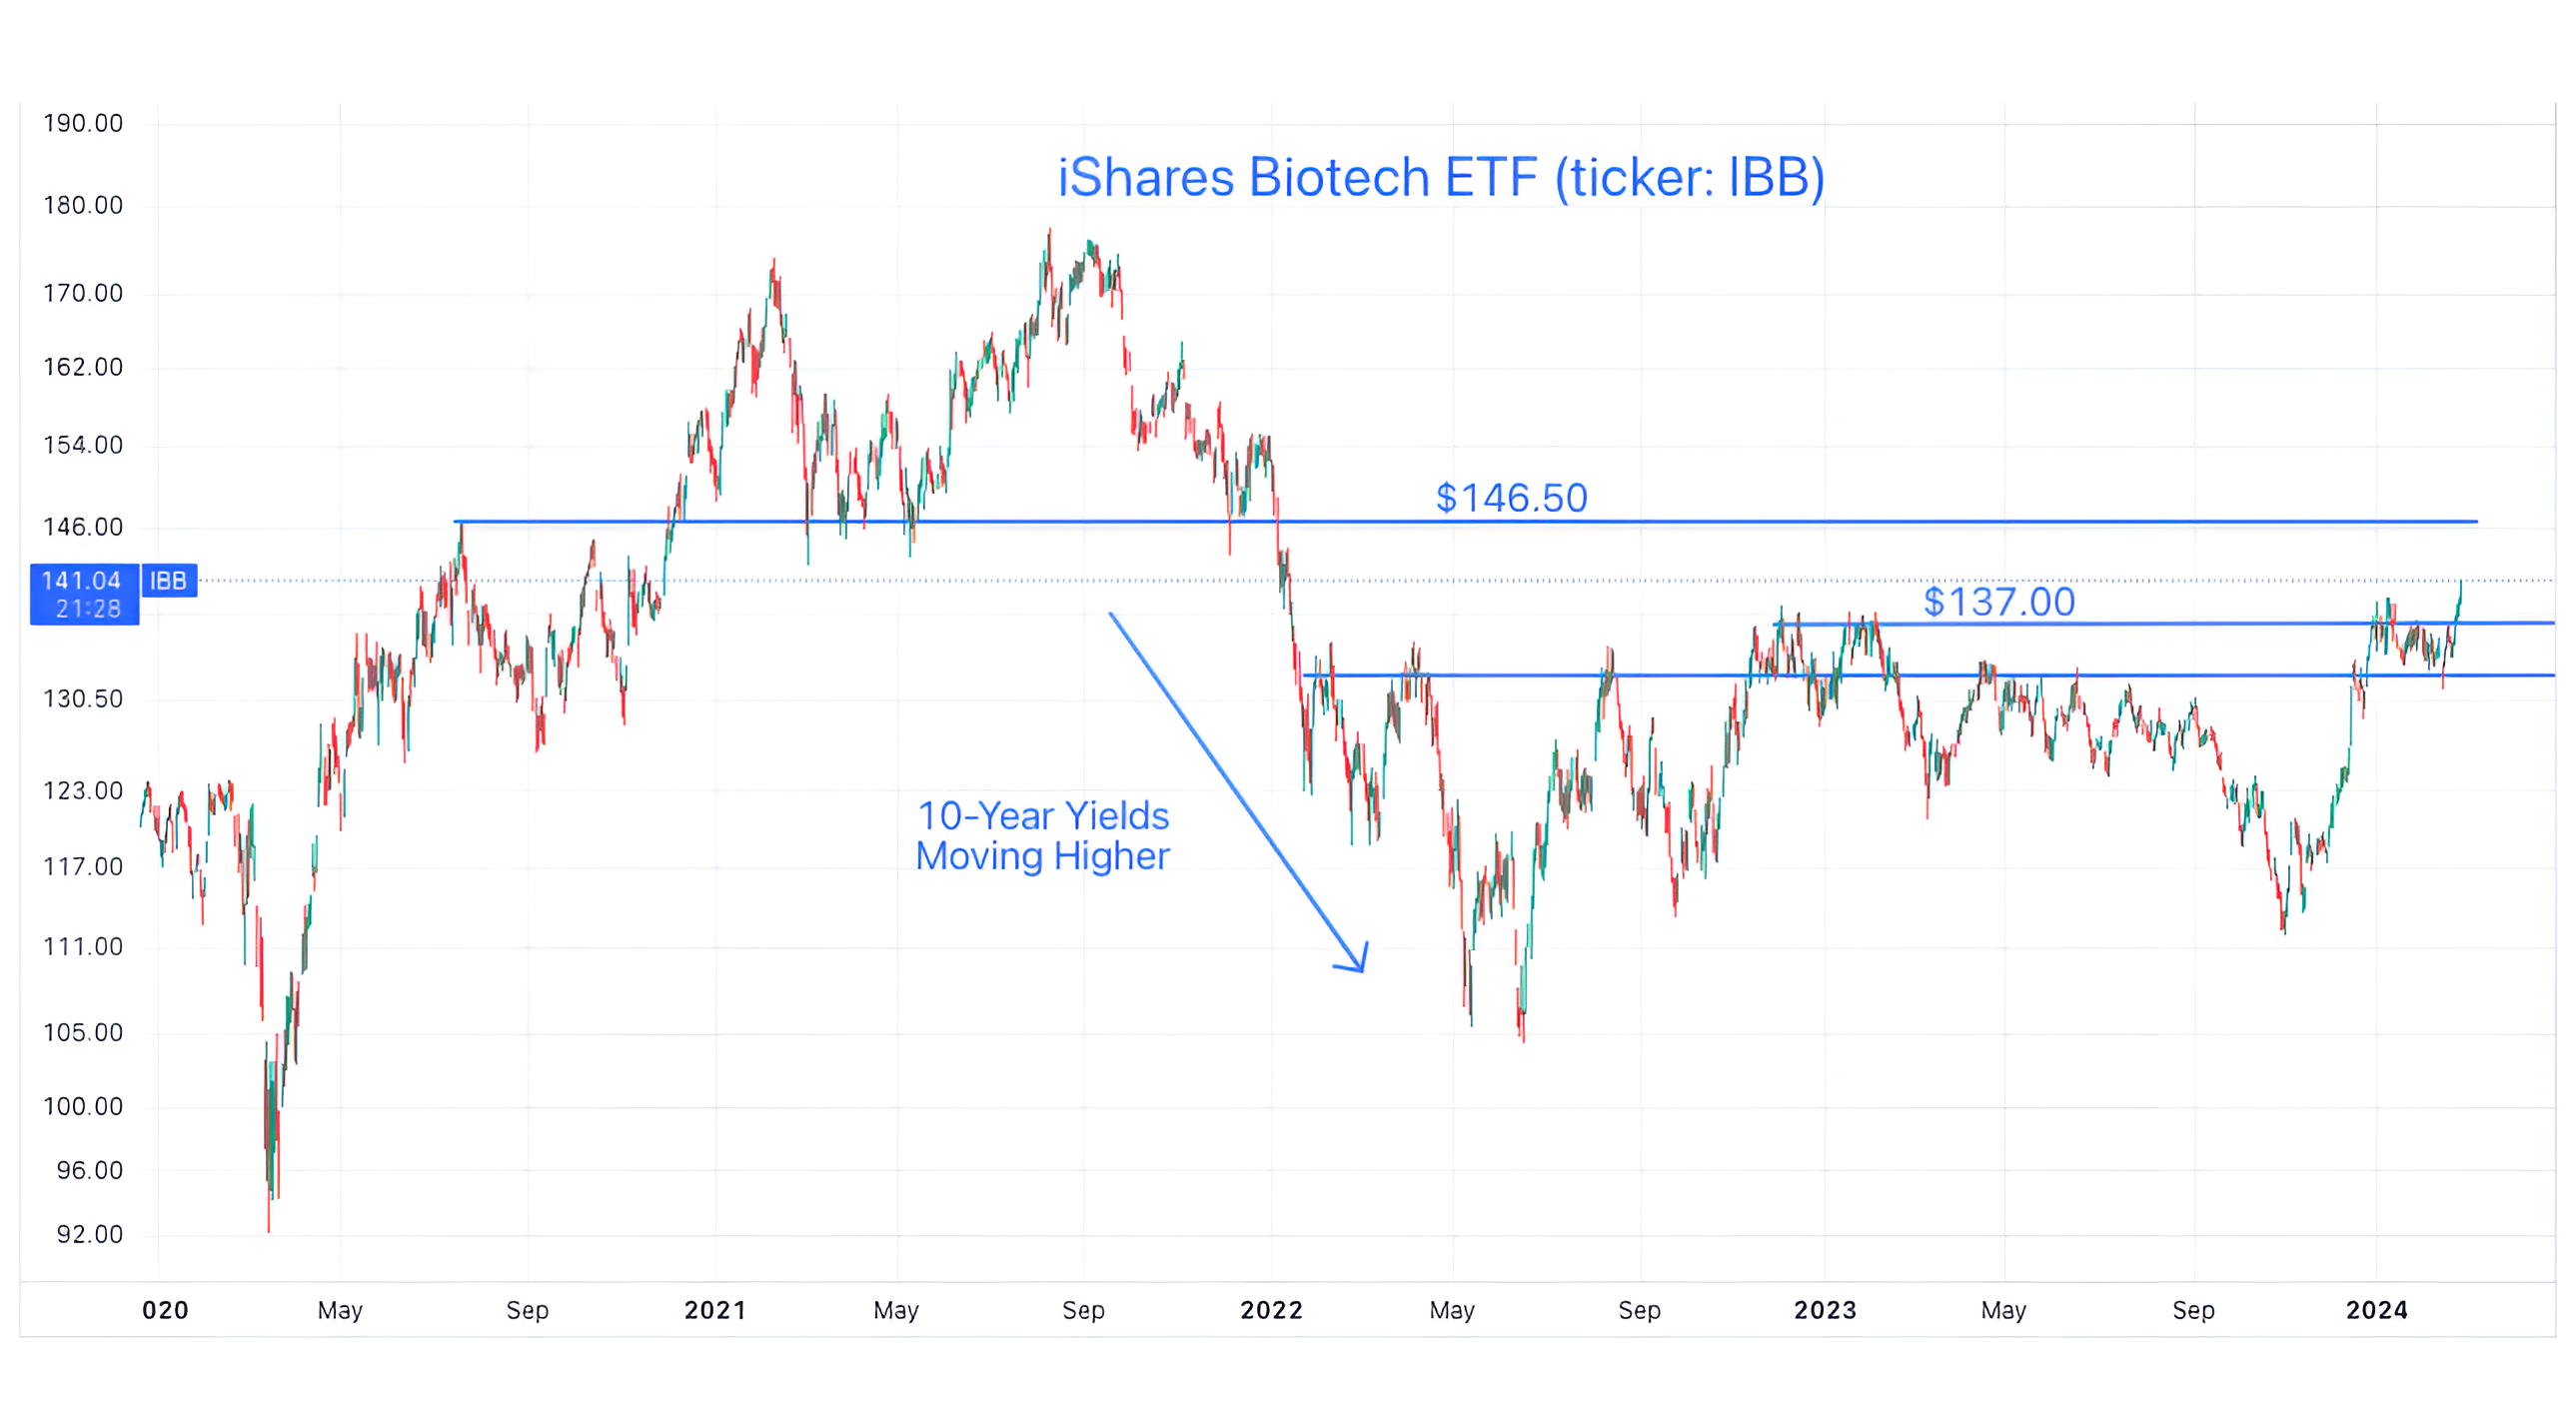
5. Biotech Shares Seem to Be Receiving the AI Memo
Last Friday, we wrote about how biotech shares may be a beneficiary of AI.
Below is a chart of the iShares Biotech ETF (ticker: IBB) - we could have looked at the SPDR Biotech ETF (ticker: XBI) - despite different compositions (described below), both have the similar characteristics:
New 52-week highs, but well below the respective 2021 highs.
Sold off in the first half of 2022 as 10-Year Treasury Yields moved higher.
Traded sideways through the second half of 2022 and 2023.
Recently moved above the 18-month sideways move.
The IBB (below) holds larger cap biotech companies with Gilead (7.7%) and Biogen (3.6%) as some of the largest holdings; while the XBI holds smaller-cap companies with Cytokinetics (2.7%) and Karuna Therapeutics (1.8%) as the biggest positions.
We believe it’s notable that Biotech shares are moving higher despite elevated 10-Year Treasury Yields (which are used to discount future cash flows when valuing equities and therefore can negatively impact those companies, such as Biotechs that have a disproportionate portion of earnings further in the future).
It may be that investors are beginning to consider the next wave of AI investments.
(This is not a recommendation to buy or sell any security).