It's Friday, I'm in Love
Finishing off a week of 1980s and 1990s song titles as headlines and its my wife's birthday so why not? Some fun charts and thoughts to roll into the weekend. Let's dig in...
1. A Strong Year - What’s Next
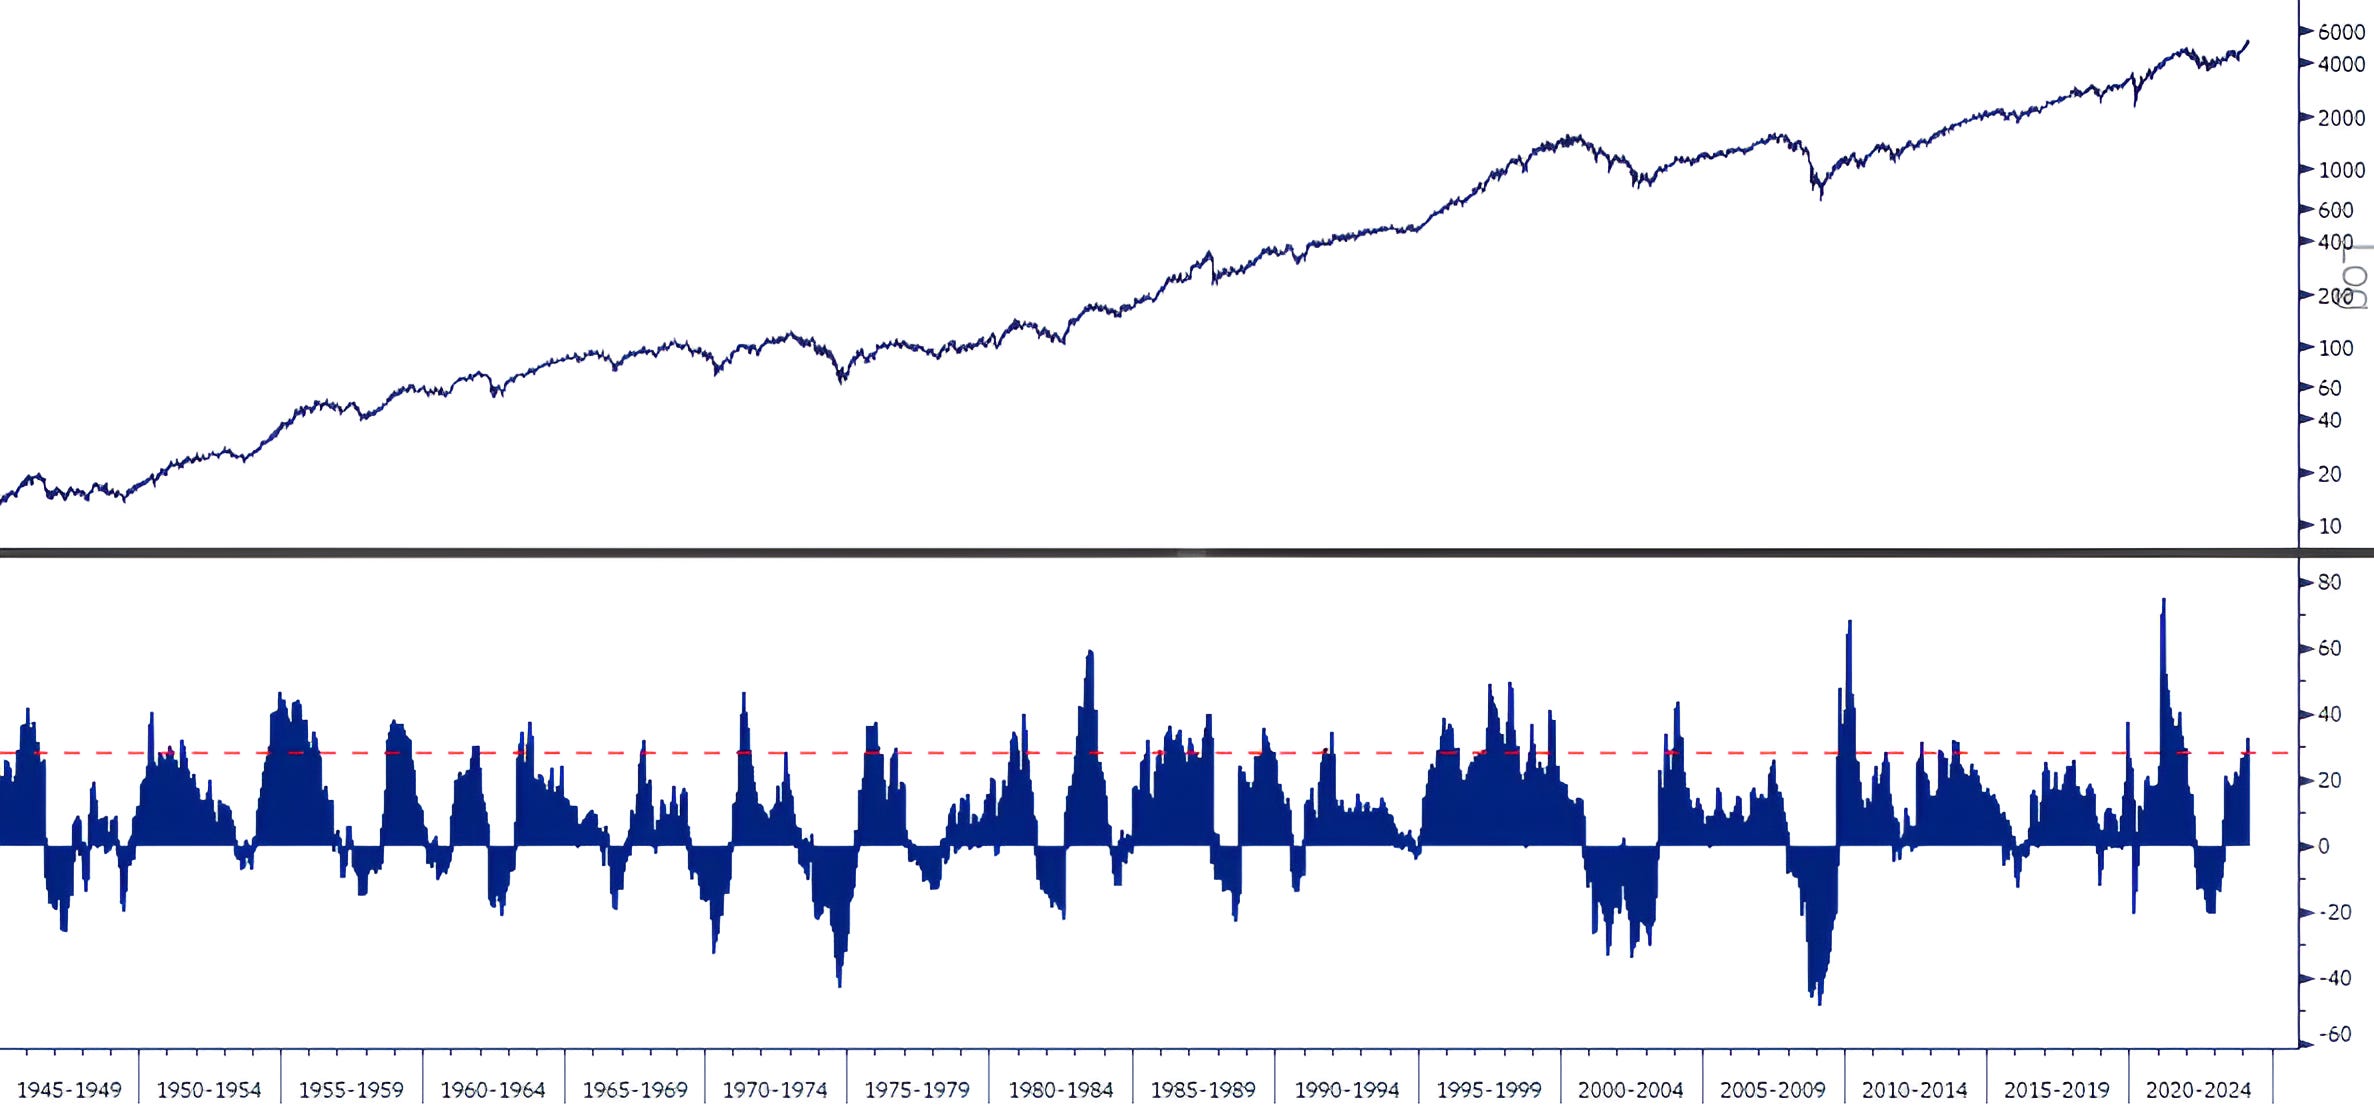
The top panel of the chart below shows the S&P 500, the lower panel shows the one year change in the index.
The red dashed line in the lower panel indicates the top 90th percentile of 1-year returns.
While the current 1-year period is not the most extreme on record, looking closely, one might recognize that, with the exception of the 1990s, it has been rare for the strongest 1-year returns to occur in periods that are not directly associated with significant sell-offs.
In other words it is more typical to see extreme moves in 1-year returns after the dot-com bubble or financial crisis bottoms than in a “more normal” market period like the current one.
All of that said, the rate of change will likely move lower as March 16, 2023 was the low of the last 12 months and the denominator in the equation will be growing from here on out.
Given valuations (21x forward earnings expectations), our view is that near-term S&P 500 returns will primarily be driven by changes to earnings expectations (see Chart 3).
With multiple expansion largely in the past, we see a more constrained return environment going forward.
Our bullish scenario of 5500 on the S&P 500 (20x 2025 S&P 500 earnings estimate of $275 - see chart 3) is consistent with the thesis above as it would provide ~7% returns over the next 9.5 months which are well below the ~30% returns of the past year.
In other words, even if the market continues to move higher, the rate of change can move lower.
We continue to believe that sector and stock selection can help with outperformance in this scenario (see charts 4 and 5).
(This is not a recommendation to buy or sell any security, it is not investment advice).
Source: Strategas, Bloomberg. Through year-to-date 2024.
2. An Outlier Year (so far)
The chart below compares the S&P 500 annual performance (y-axis) to the maximum drawdown during those years (“intra-year” drawdown) (x-axis).
We know that drawdowns can cross calendar years and, as a result, the chart below doesn’t necessarily capture peak to trough drawdowns in the index over the last 79 years, but it is informative.
What catches my attention is:
In years when the S&P 500 is up 20-30%, there is often a drawdown (peak to trough decline) of 5-10% and sometimes more.
The most significant drawdown year-to-date (“ytd”) has been 1.7%. Currently, 2024 is an outlier in a positive way. Even the smallest drawdown years have had peak-trough declines greater than 2%.
Two further thoughts:
While there does not need to be a larger drawdown, it would be historically unique (at least over the past 79 years) for there not to be one.
A larger drawdown does not need to come from current levels. The market could appreciate another 10% before dropping 2%+.
That said, as we wrote yesterday, there seem to be a number of imbalances “percolating.”
In our view, significant near-term equity market upside is likely constrained, while some (at least minimal) downside risk may be heightened.
(This is not a recommendation to buy or sell any security and is not investment advice. Past performance is not indicative of future results).

Source: Strategas. Through March 5, 2024.
3. The Evolution of S&P 500 Earnings Expectations
While our view has been that “stealth liquidity” has helped drive the PE multiple of the S&P 500 higher (most recently articulated in chart 4 here), 2024 and 2025 earnings expectations have been notably consistent and supportive as well.
First of all, a brief explanation of “bottom-up” S&P 500 earnings per share “EPS.”
Essentially, FactSet takes the consensus earnings per share estimate for each company in the S&P 500, weights those estimates be each company’s weight in the index, aggregates the numbers; and tracks the aggregate over time.
The result is the graph below.
In many years, what we have seen is that the initial estimates for a given year (which can begin 2-years prior to the start of the year) are continually revised down as that year comes more sharply into focus.
Looking closely at the chart, both 2024 and 2025 earnings expectations have been remarkably steady over the past year.
2024 expectations are down slightly from around $249 (for the entire S&P 500) to $244; while 2025 earnings expectations are up to $276.70 from their initial estimate of $275.
In the same report in which we most recently wrote about “stealth liquidity” we also wrote:
“During the current earnings season, we have noticed that as analysts have cut Q1 earnings, they have raised Q4 expectations. This has helped keep the full year 2024 earnings level steady in the $242-243 zone.
In our view, S&P 500 2024 earnings will likely be closer to $230-235.
However, if near-term earnings expectations come down slowly while future future earnings are padded (in the same way that we have seen with Q1 expectations moving down and Q4 expectations moving higher), it may not matter.”
In fact, if you look closely at the chart below, 2024 earnings estimates have increased from their low on January 19.
Simultaneously, since January 19, Q1 estimates have dropped from $56.04 to $55.10 (as of March 11).
The difference - and then some - has been applied to the final 3 quarters of the year.
Remember, the period from January 19 to March 11 is the majority of Q1.
Companies have the most visibility on the quarter in which they are currently operating and the quarter in which they are currently operating does not look quite as good as it did 6 weeks ago.
That said, in our view, it might not matter too much because at the end of Q1, investors will begin to price in next 12 month earnings that include Q1 2025.
As long as the calendar can flip without a dramatic earnings miss or significant disruption this game can go on.
In our view, if 2025 estimates can remain steady (a big if given the fact that we believe second half 2024 earnings are too high) at around $275, the S&P 500 can trade to 5500 (20x) in a bullish year-end scenario.
(This is not a recommendation to buy or sell any security).

Source: TradingView. Through year-to-date 2024.
4. The Materials Sector is Flying
Yesterday, we showed the Energy sector relative to the S&P 500. Today, we are showing the Materials sector (absolute, not relative).
Since early February, the Materials sector is up 12% and is more than doubling the 5.5% return of the S&P 500 over the same period.
We believe that the Materials sector may be supported by a combination of demand - US fiscal stimulus (building factories, distribution centers and and data centers); US home building demand; EVs and EV infrastructure; Chinese recovery; and companies moving production from China - and a lack of supply due to underinvestment over the past 10 years.
However, the more important point is that if materials companies continue to do well, the producer price index (PPI) which came out above expectations yesterday, may remain elevated and could continue call into question the timing and likelihood of a Fed rate cut.
Finally, and we make this point in chart 5 below, in our view, the recent performance of Materials and Energy may reflect a larger change in the “under the surface” character of the S&P 500.
We want to pay attention to this and potentially invest in it.
(This is not a investment advice and is not recommendation to buy or sell any security).

Source: TradingView. Through year-to-date 2024.
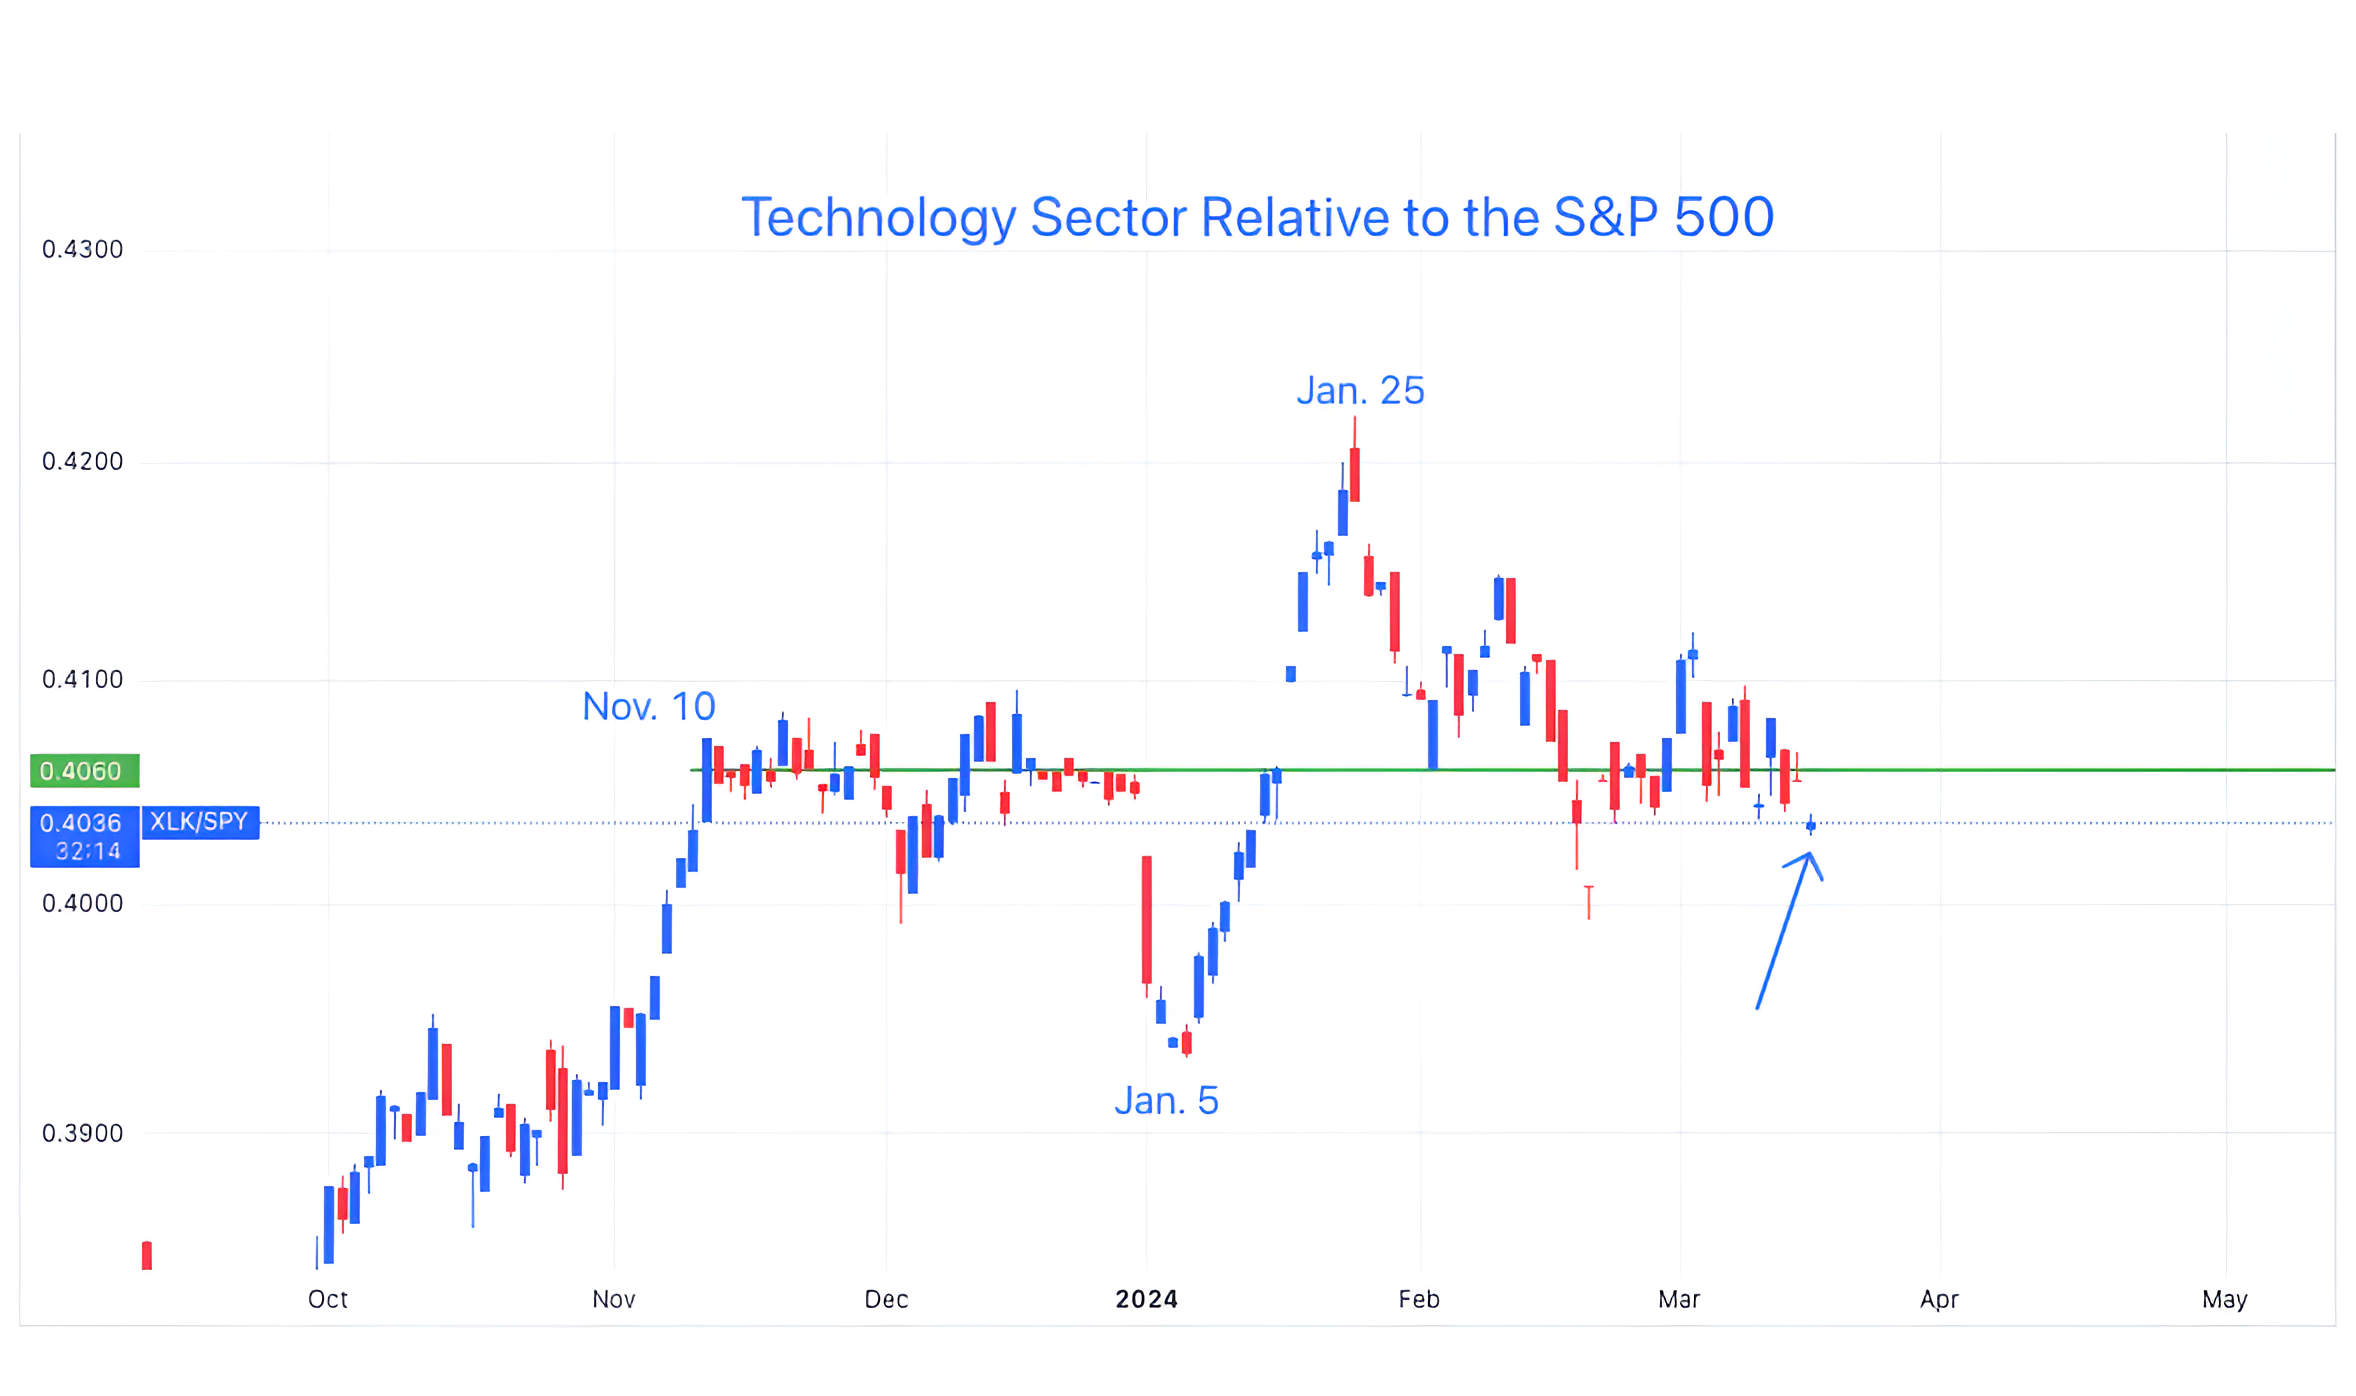
5. Tell Me Something I Did Not Know
Since spiking higher off of the October low, the Technology sector is underperforming the S&P 500 overall.
Remember this is the sector with Nvidia and other Semiconductor companies that should be the earliest beneficiaries of AI.
Three points to make:
As we wrote in “Where the Puck is Going” here, we need to begin to consider the next leg of AI.
We highlighted the outperformance of the Energy sector yesterday and Materials above, while both may pause, they are likely worthy of consideration in portfolios. We have been making the case for energy for some time.
This is not the 2023 market that was being dominated by the Magnificent 7. The character of the market and the drivers of performance seem to be changing in 2024 and we need to be sure to recalibrate.
Have a great weekend!
(This is not a investment advice and is not recommendation to buy or sell any security).