

Let's Get This Party Started!
While the fundamental characteristics of US equities continue to look stretched, the technical indicators - which have been "right" - are suggesting the party is just getting started. Let's dig in...
Since the beginning of Charting Alpha, we have noted the conflict between the fundamental (earnings, earnings growth, operating environment) and technical indicators that we follow.
In general, we have viewed the fundamental factors with concern - earnings expectations seem aggressive in light of softening economic growth while valuation is at levels that is comparable to past bubbles (see chart 4 here).
On the other hand, the technical indicators - money flows, momentum, historical precedents and chart patterns - have been consistently bullish.
We have tried to reconcile this - both in our portfolios and our writing - by remaining invested and not over-reacting, but at times implementing hedges through puts and put spreads.
Although our bias is towards the fundamentals - the technicals have been “right.”
At times, when following technicals, we have been accused of not being “rigorous.”
However, we often remind ourselves that there are no style points for making money in equity markets. A dollar gained in a bubble is just as good as dollar gained in a value driven market.
That said, we recognize that the dollar gained in the bubble can often be taken back quickly if the bubble is popped and the euphoria dissipates. This is why we often characterize the market as fragile and view it with caution.
With the combination of the possibility of Trump 2.0 and the market now pricing in with 100% certainty a Fed rate cut in September, a number of technical indicators are once again pointing to impressive next 12 month gains.
Will these continue to be “right”?
While we don’t know, we can’t ignore them and believe they should be a part of the investment process.
Today’s note highlights some of these bullish technical factors. In our view, while they are not the sole basis for our views or positioning, they should be respected.
1. A Whaley Breadth Thrust = Bullish Equities (Part 1)
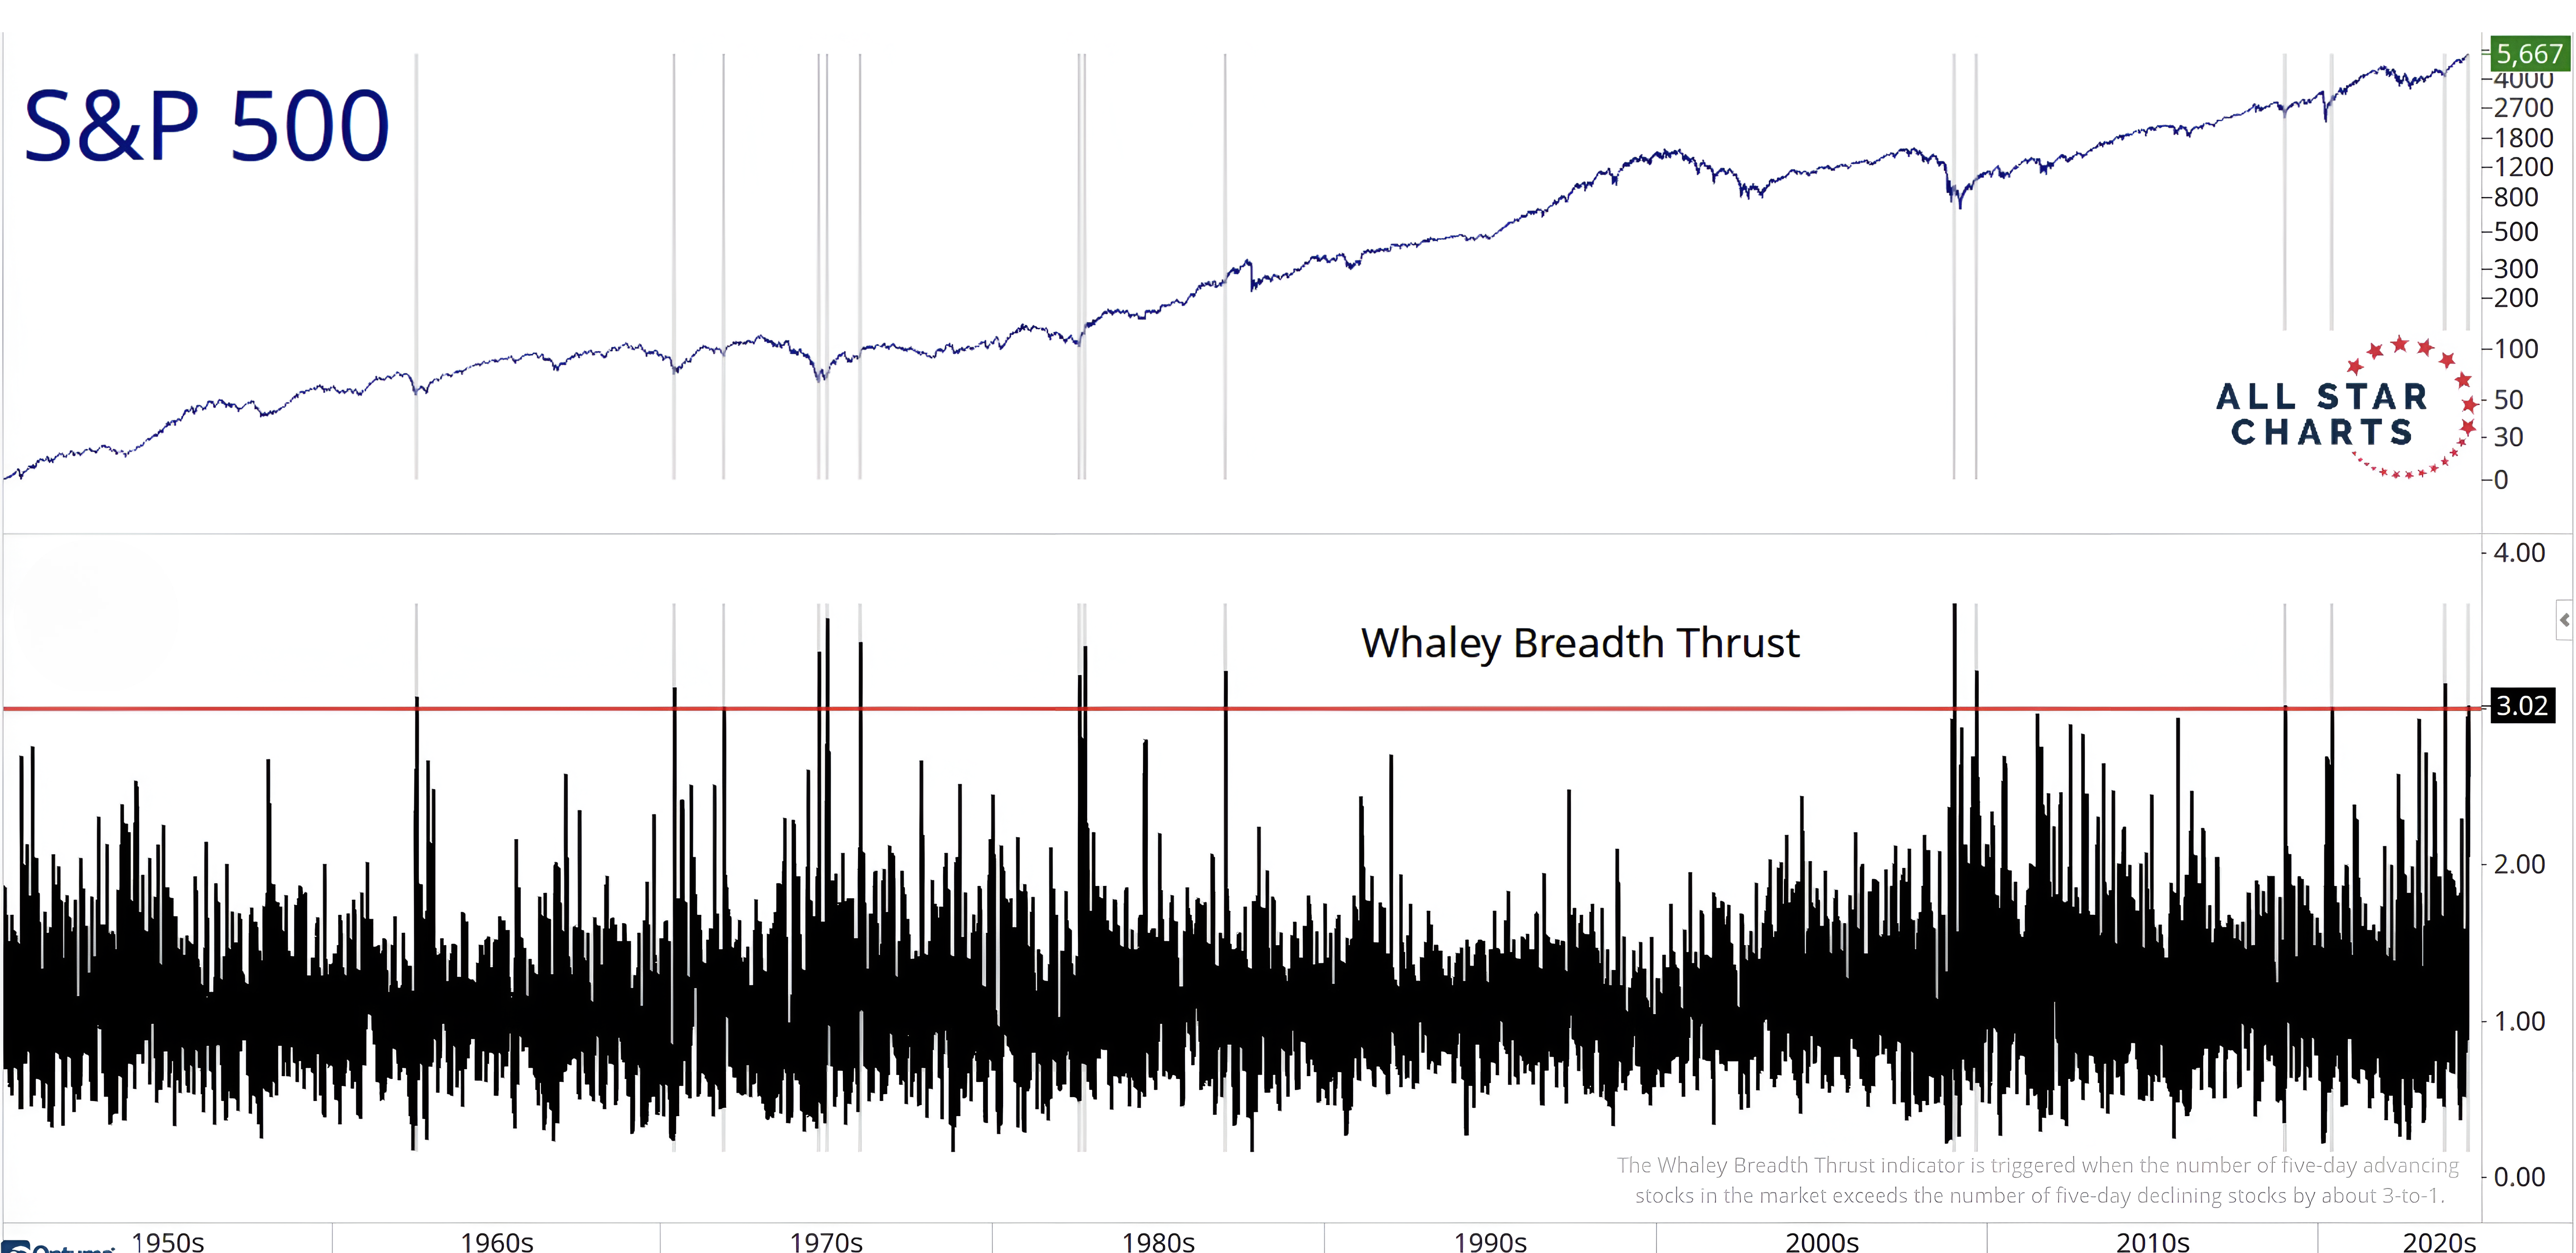
Source: All Star Charts. Through year-to-date 2024.
The top panel of the chart above shows the S&P 500.
The bottom panel shows the conditions for a Whaley Breadth Thrust with the conditions being met above the red line.
What is the Whaley Breadth Thrust?
The Whaley Breadth Thrust is a technical signal based on the ratio of advancing to declining NYSE stocks identified by Wayne Whaley in 2009.
It is triggered when the number of five-day advancing stocks in the market exceeds the number of five-day declining stocks by about 3-to-1. The current reading is 3.02.
A full description is here.
Over the past 63 years, this signal has only been triggered 14 times prior to this week (grey vertical lines on the chart).
While the one year returns have been consistently impressive (see chart 2), what makes the current period notable is that this signal is occurring after a 20-month advance in the S&P 500. In the past, it has generally been triggered after a sell-off and near market lows.
Given this difference, we will see if the Whaley Breadth Thrust once again precedes solid one year returns.
(This is not a recommendation to buy or sell any security and is not investment advice. Please do your own research and due diligence).
2. A Whaley Breadth Thrust = Bullish Equities (Part 2)
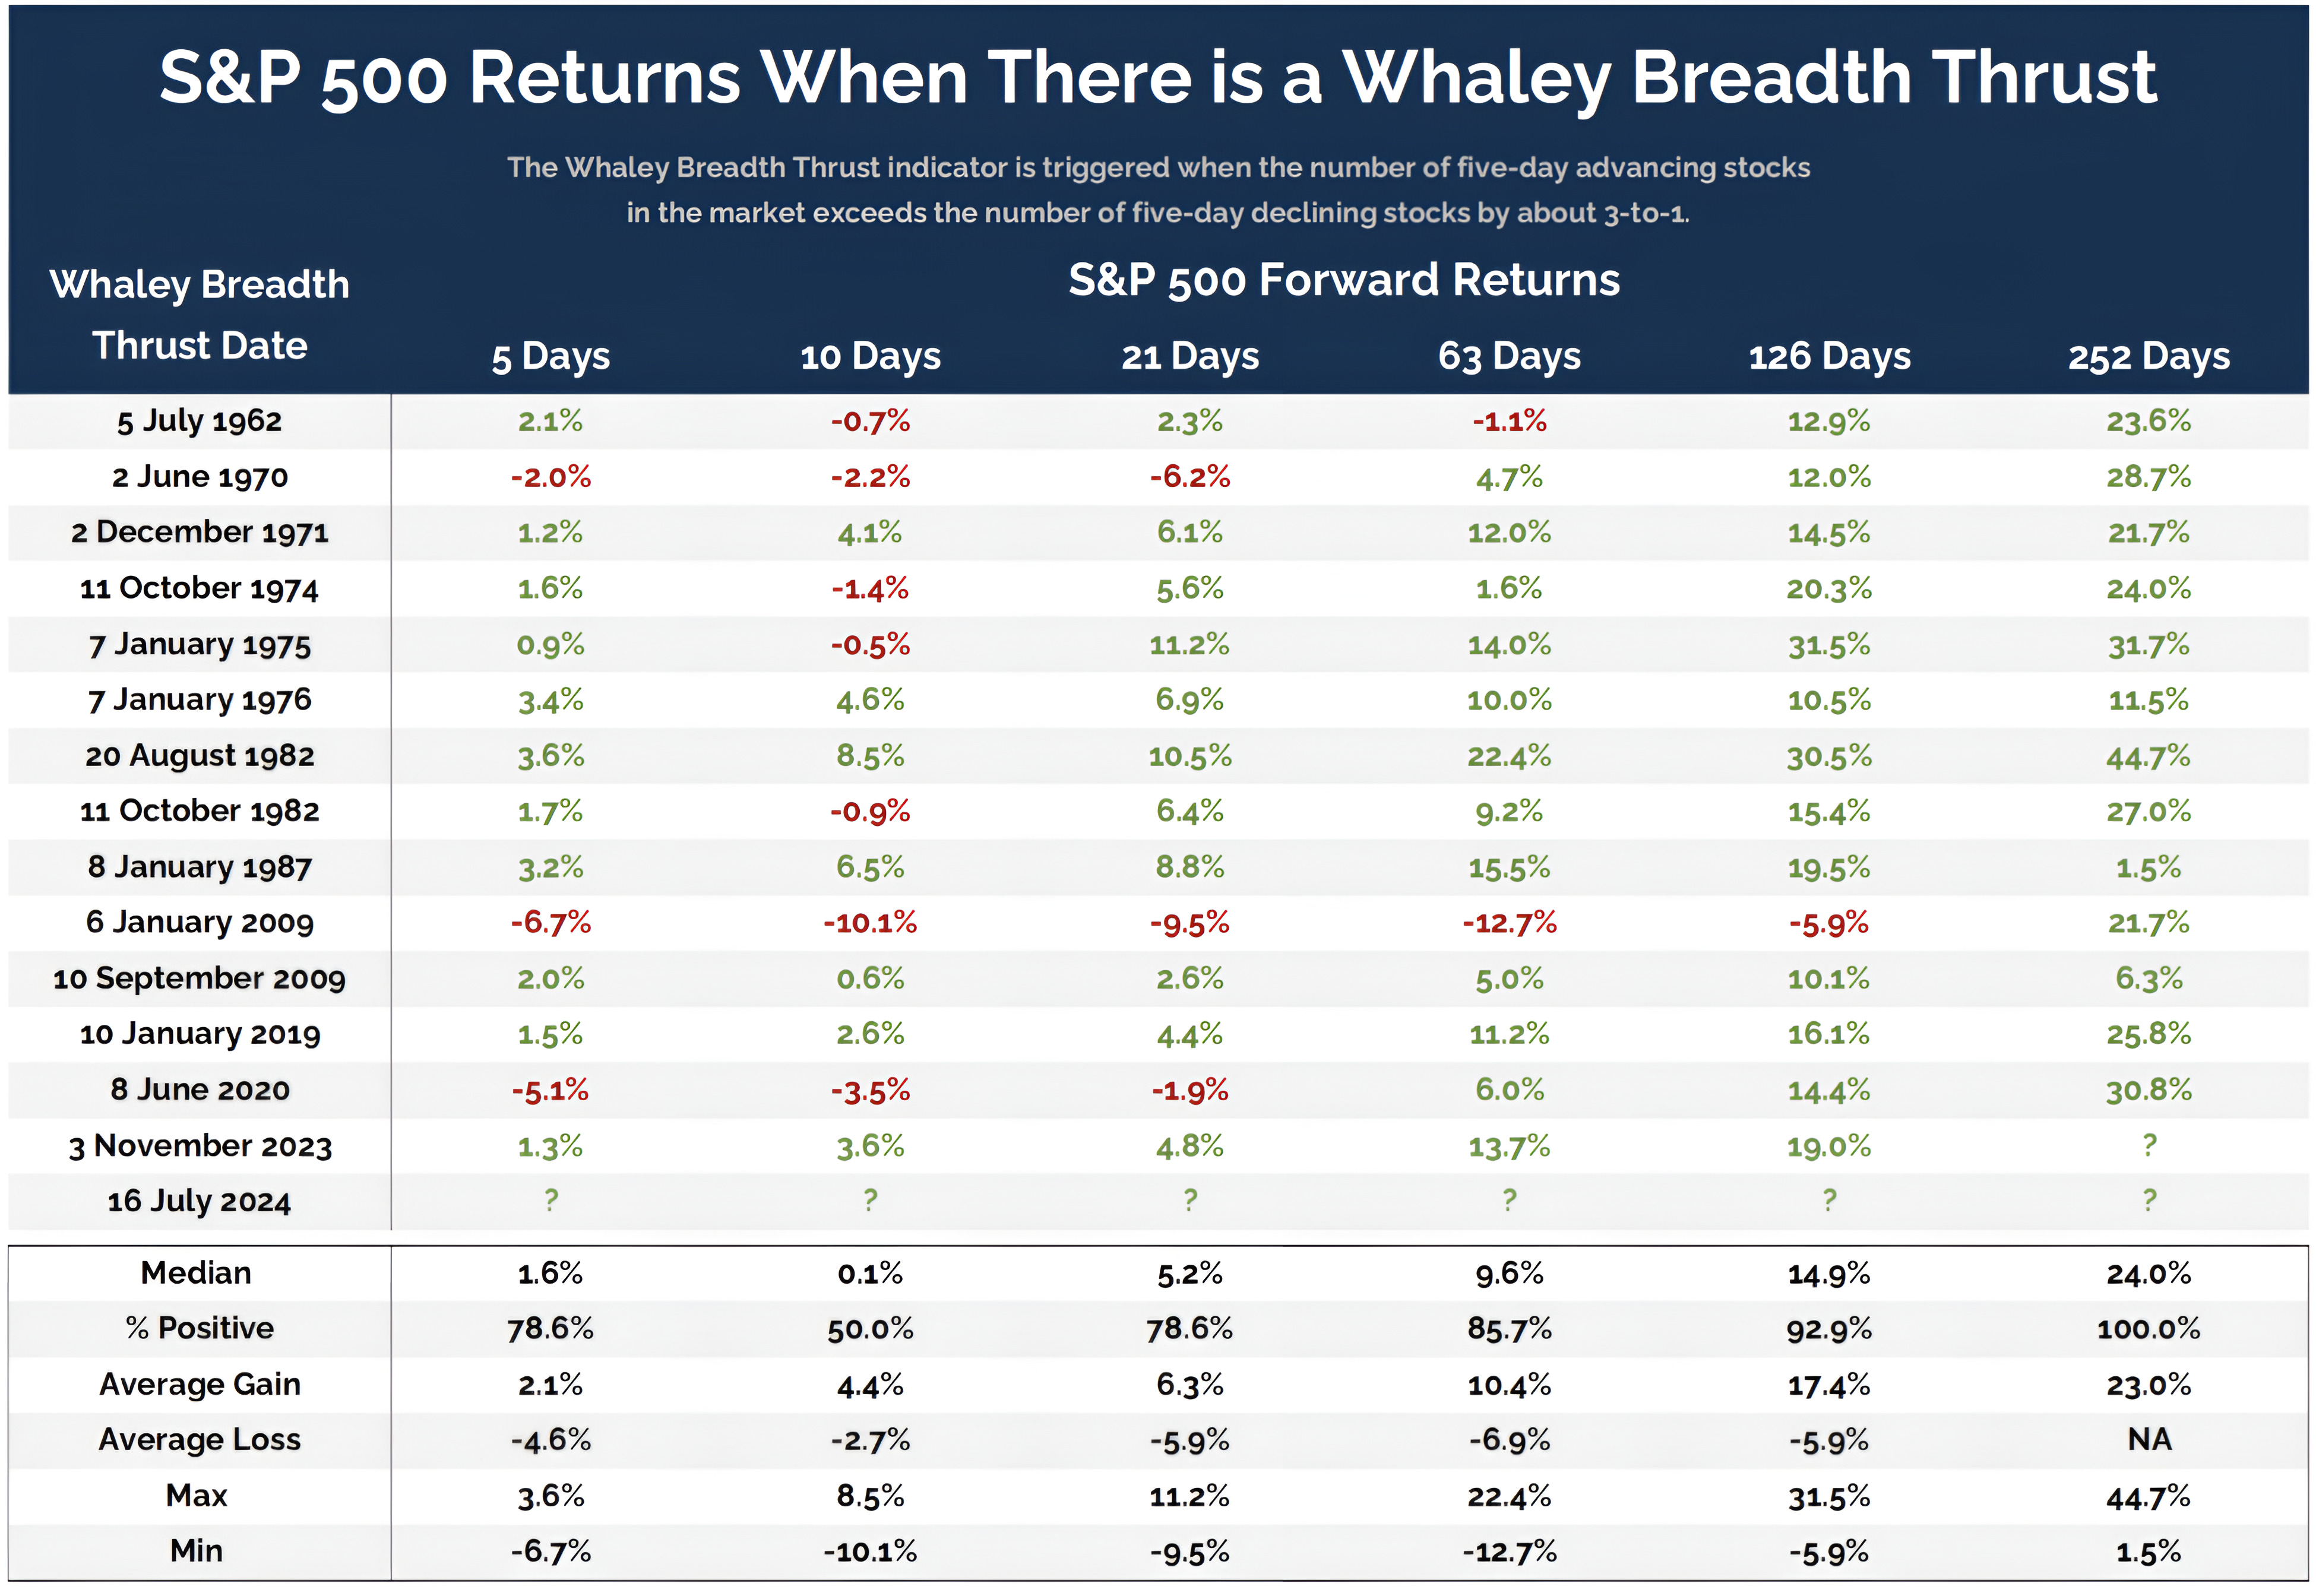
Source: All Star Charts. Through year-to-date 2024.
The chart above shows the S&P 500 performance for different periods after a Whaley Breadth Thrust has been triggered.
The median 1-month (21-day) S&P 500 return after a Whaley Breadth Thrust has been triggered has been 5.2% with a positive return 78.6% of the time.
The median 6-month and 1-year gains have been 15% and 24%, respectively and after 1 year, the S&P 500 has had a positive performance 100% of the time.
In general, the data is impressive.
(PAST PERFORMANCE IS NOT INDICATIVE OF FUTURE RESULTS. This is not a recommendation to buy or sell any security and is not investment advice. Please do your own due diligence).
3. Small Cap Party (Part 1)
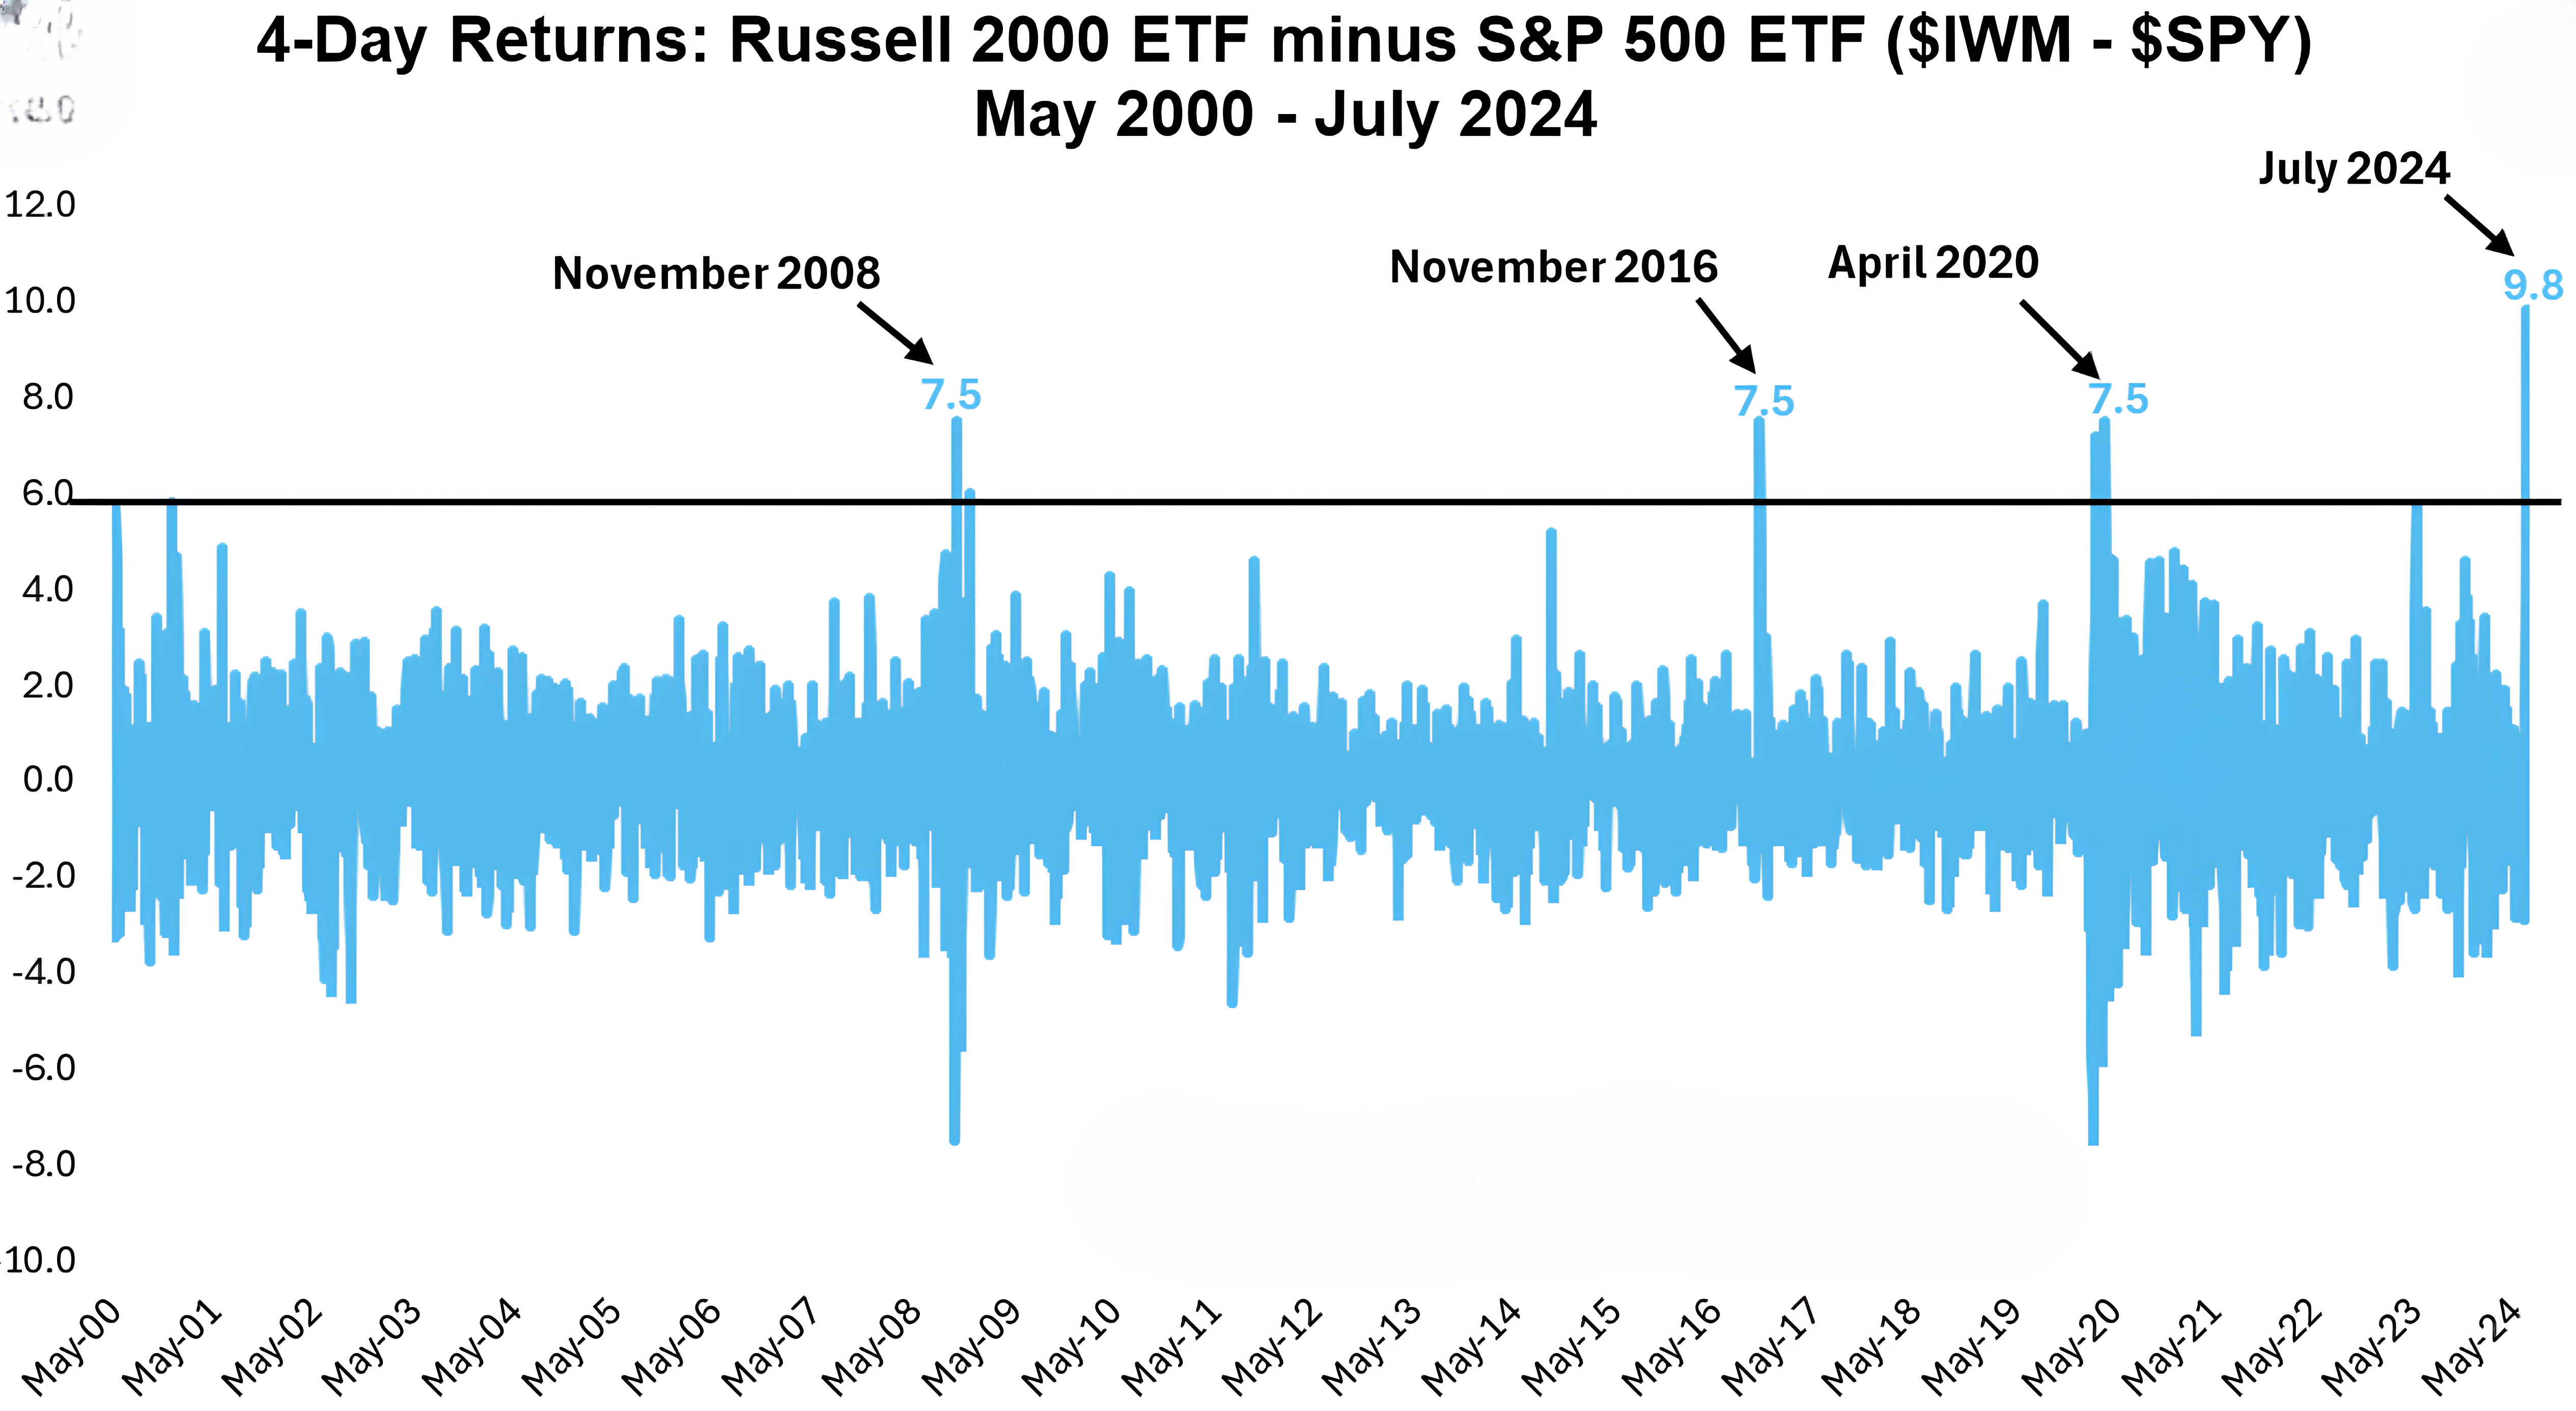
Source: Charlie Bilello / Fundamental Planning. Through year-to-date 2024.
The chart above shows the difference in the 4-day return of the Russell 2000 US Small Caps and the S&P 500.
While the chart is based on the differences between the respective ETFs, the index returns are similar.
Over the past four trading days, the US Small Cap ETF is up 10.4% and has outperformed the S&P 500 ETF by 9.8%. This is the largest 4-day outperformance on record.
(Past performance is not indicative of future results. This is not a recommendation to buy or sell any security and is not investment advice. Please do your own due diligence).
4. Small Cap Party (Part 2)
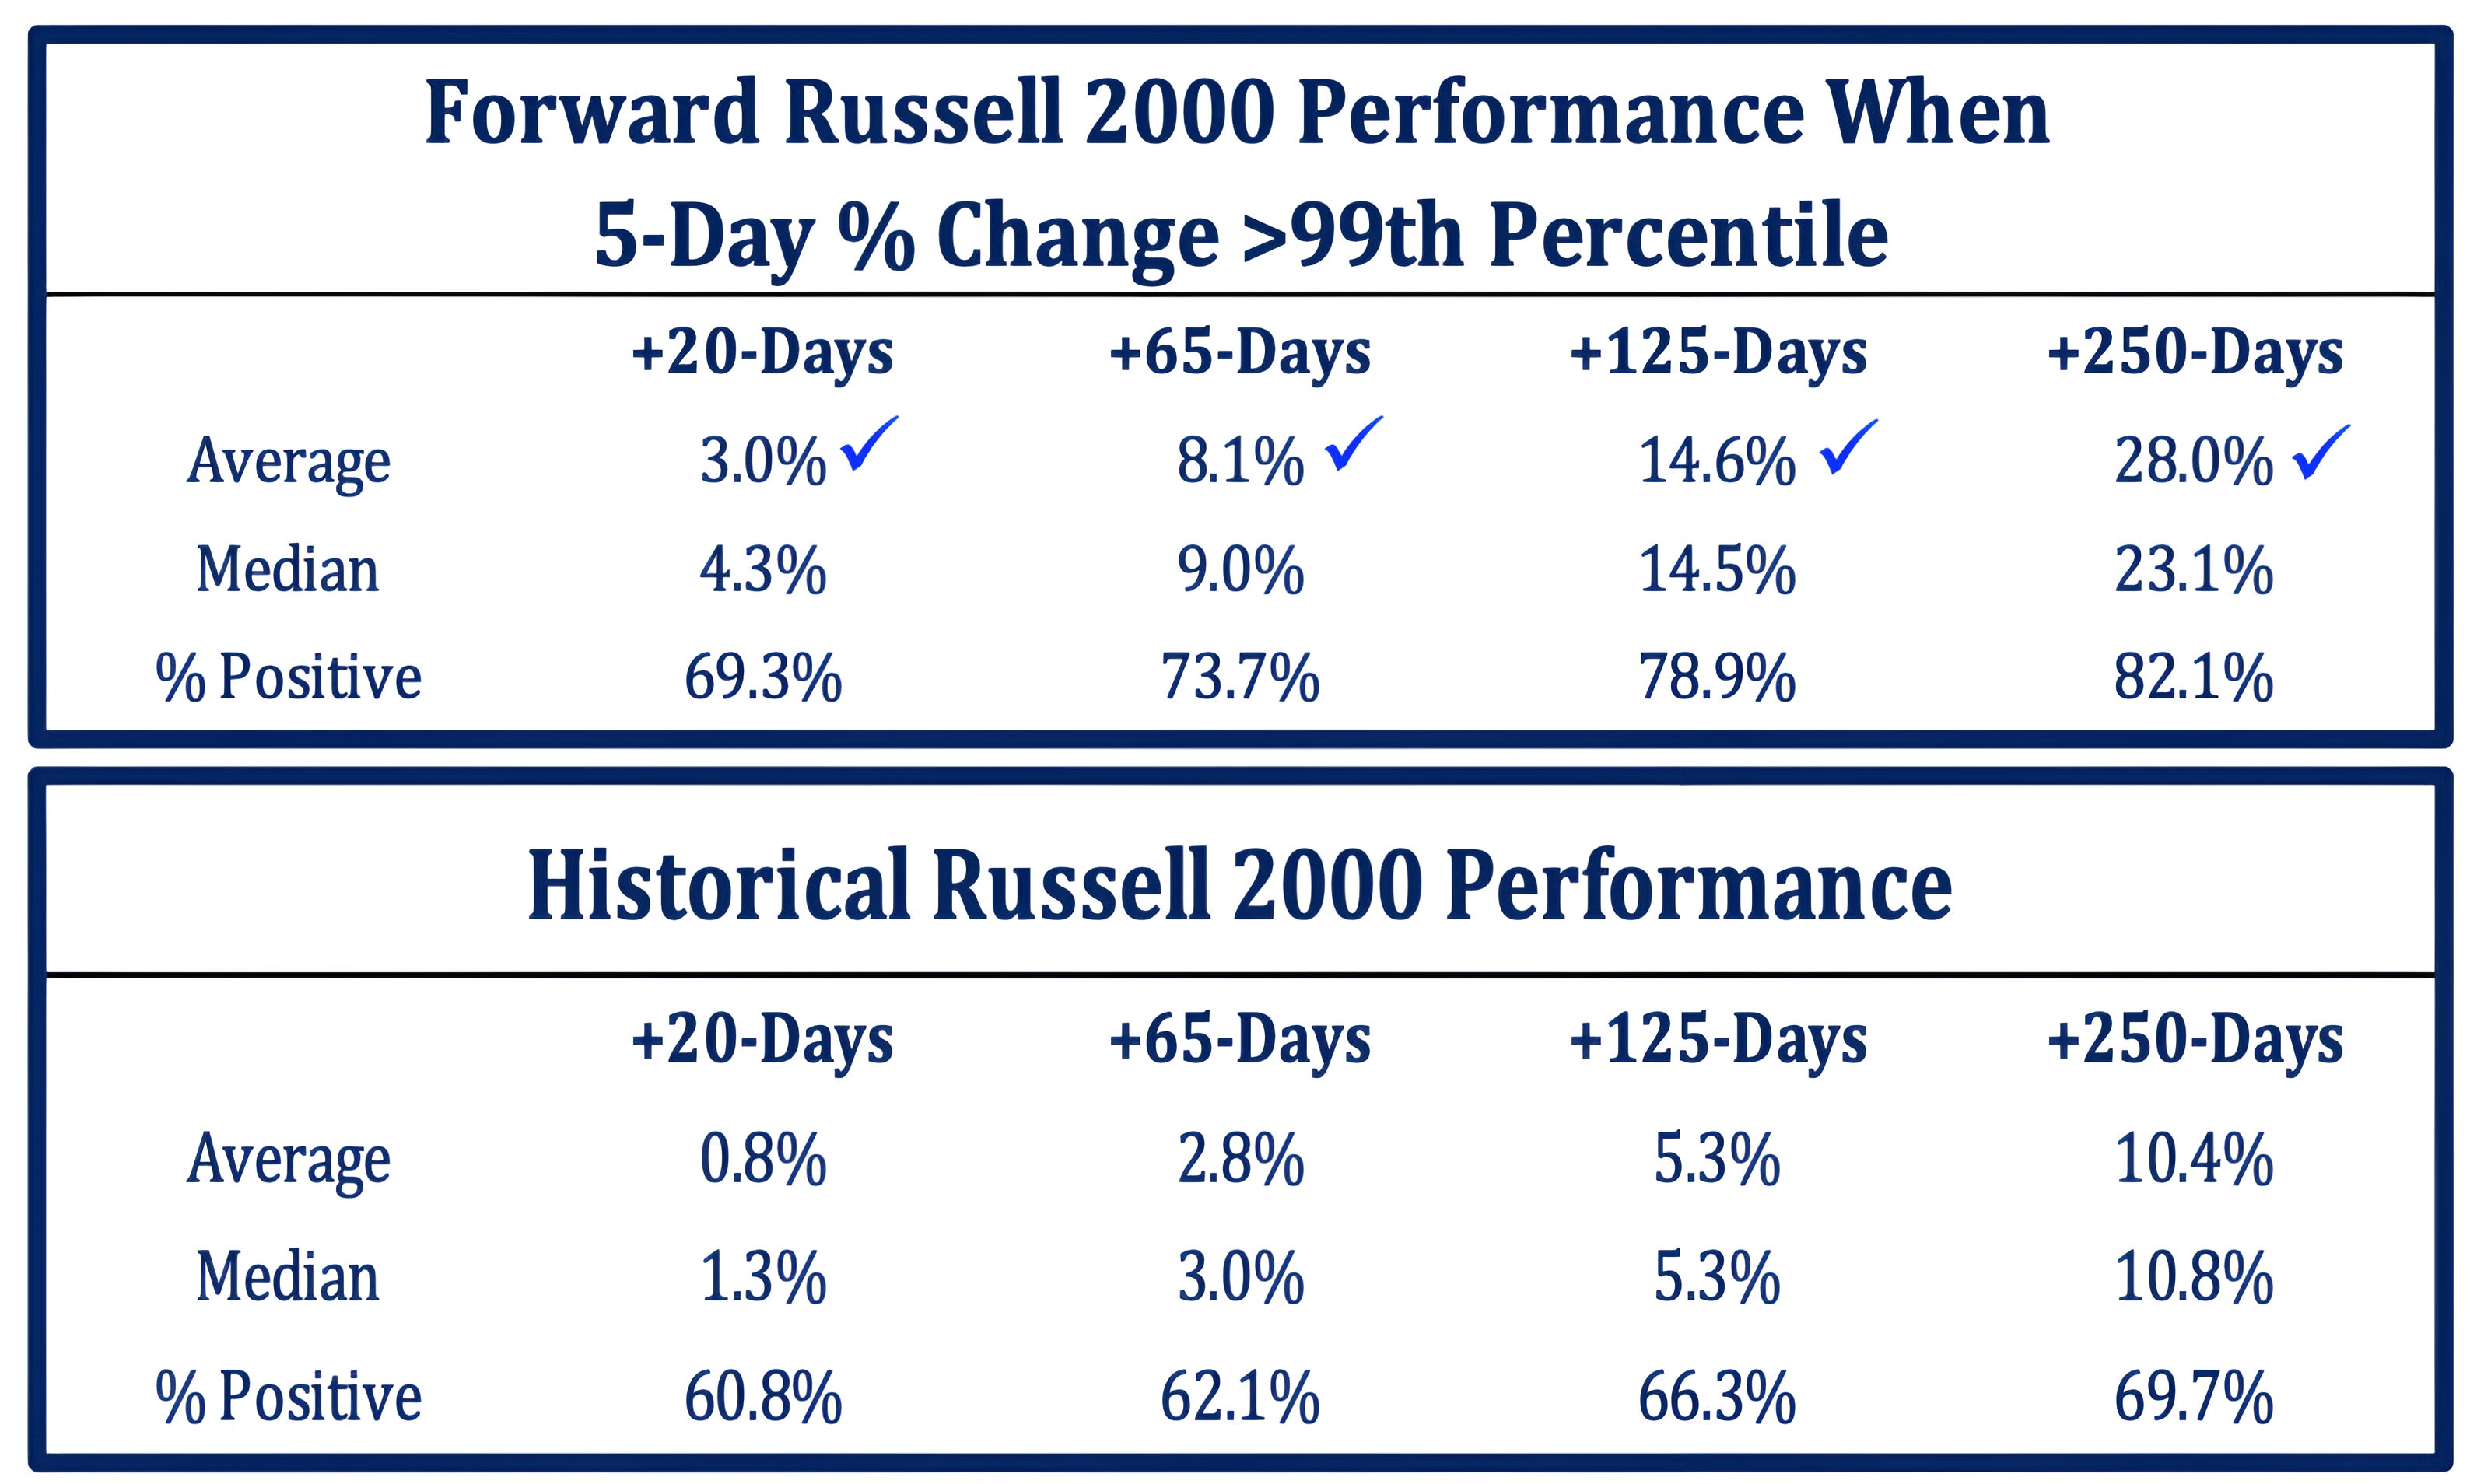
Source: Strategas. Through year-to-date 2024.
The chart above shows the Russell 2000 performance over different time periods when the 5-day % change in the index is in the 99th percentile as it has been over the past 5 days.
Historically, when the 5-day % change in the Russell 2000 is in the 99th percentile, the forward 6-month (125 day) and 1-year (250 day) median returns have been 14.5% and 23.1%, respectively.
These returns are significantly greater than typical 6-month and 1-year Russell 2000 returns.
What is interesting is that these returns are consistent with the forward returns of the Whaley Breadth indicator despite being based on a different signal.
(Past performance is not indicative of future results. This is not a recommendation to buy or sell any security and is not investment advice. Please do your own due diligence).
5. Weaker Dollar = Bullish for Equities
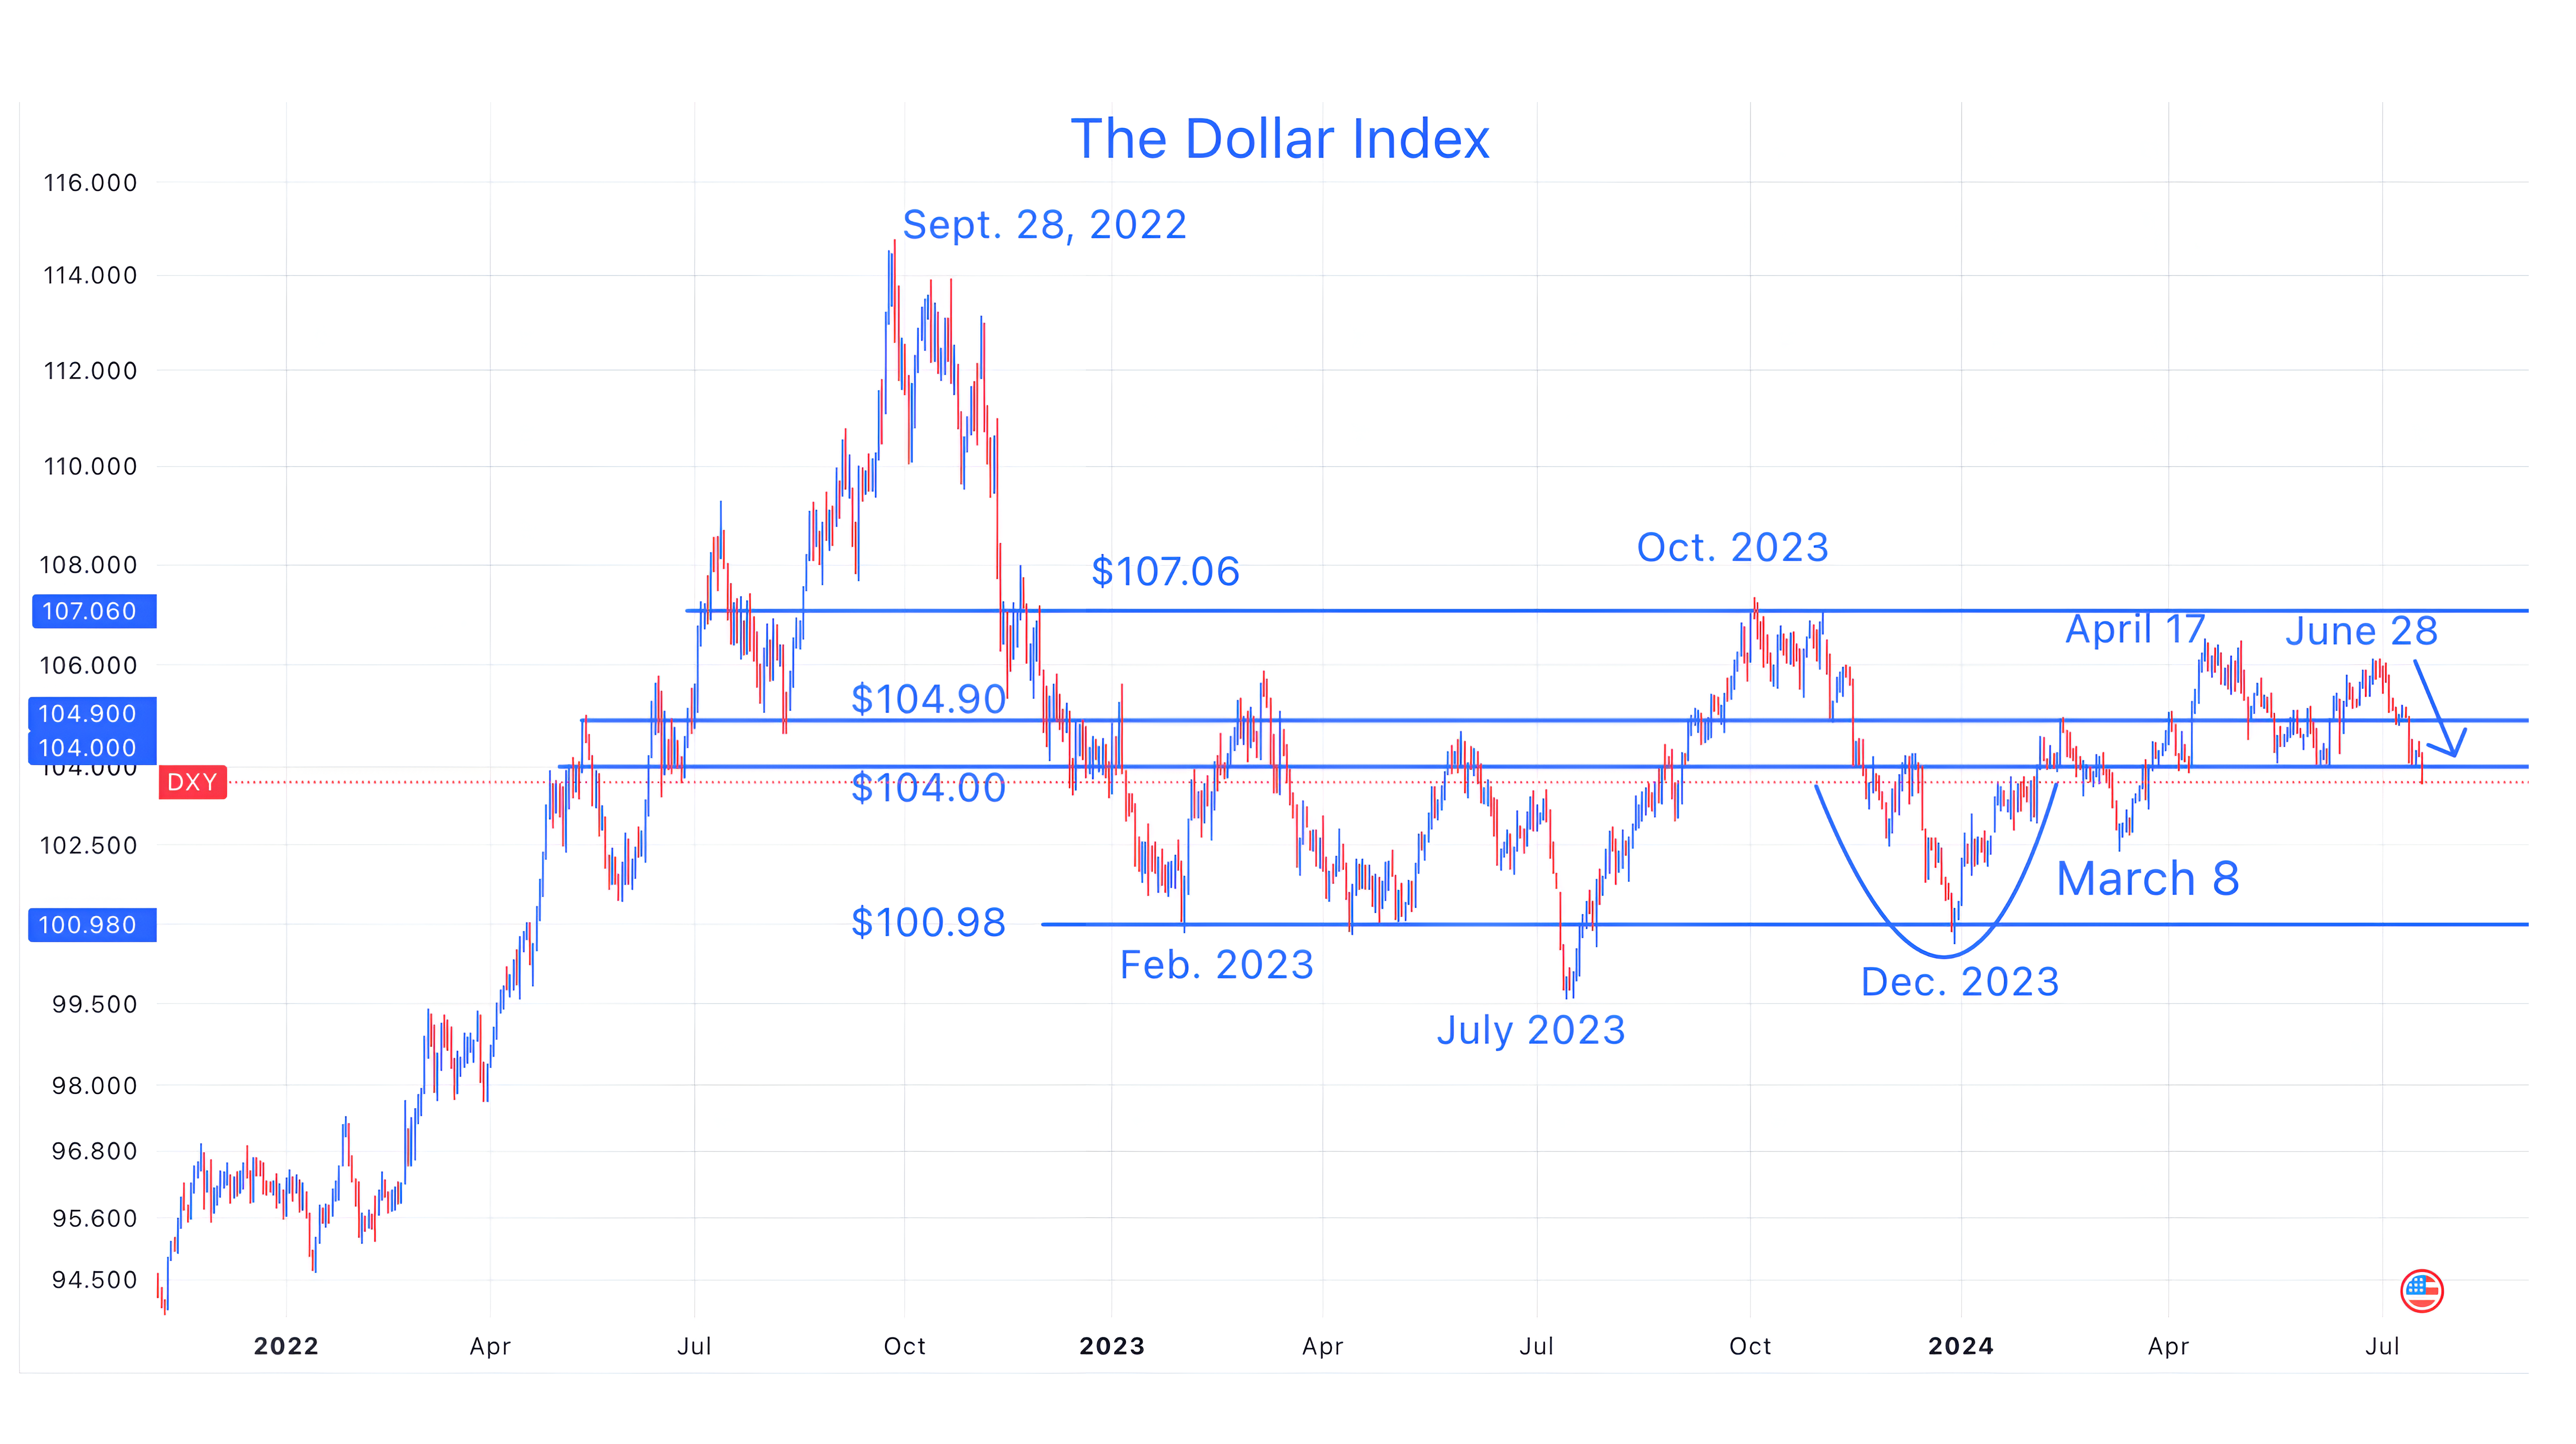
Source: Trading View. Through year-to-date 2024.
On Monday, we highlighted the growing possibility of President Trump 2.0 (chart 3 here).
While we highlighted tax and trade as two characteristics of Trump 1.0, it is becoming more clear that one of the policies of Trump 2.0 may be a weak dollar.
In a recent interview with Bloomberg Businessweek, Trump specifically cited the weakness of the Japanese Yen and the Chinese Yuan as hurdles to US corporate competitiveness and domestic manufacturing.
Looking closely at the chart of the dollar index (above), recent peaks in dollar strength have coincided with S&P 500 market bottoms. (Past performance is not indicative of future results).
This can be seen in September 2022, October 2023 and April 17, 2024.
In our view, it is notable that the dollar began to weaken on June 28 immediately following the Trump / Biden debate, after which Trump’s poll numbers improved.
The dollar index (chart above) is now once again fighting with the $104 level that has been a battle zone over the past 18 months.
If the US dollar continues to weaken, it could be a tailwind for both US and EM stocks.
In addition, perhaps a weaker dollar could provide fundamental support for the technical and momentum indicators cited above.
(Past performance is not indicative of future results. This is not a recommendation to buy or sell any security, please do your own research).