

Let's Take It Slow...
With equity markets near all-time highs and the Fed ready to ease, it's a more complicated period than it would seem. That said, it has paid to be patient in this market. Let's dig in...

One of the most thought provoking chart that I’ve seen over the past two weeks - or for a while, for that matter - is Goldman Sachs’ estimate of the benchmark employment revision that will be released on September 9th.
For context, every month, the Bureau of Labor Statistics releases its employment report. In the subsequent two months, the numbers are revised.
There are also two additional “benchmark” revisions.
In September every year, the Bureau of Labor Statistics publishes the initial Benchmark Revision which replaces estimates with hard data from unemployment insurance tax filings. The September revision captures the period from April of the previous year through March of the Benchmark Revision year.
In other words, in a week, we (including the Fed) will have a better idea of how employment actually was between April 2024 and March 2025.
Remember when the market - and Trump - became agitated after the recent employment numbers were revised lower (see the introduction and chart 3 here).
The final “benchmark” revision for the period between April 2024 and March 2025 will be in February 2026.
Goldman Sachs is estimating that the job gains initially reported for April 2024 to March 2025 will be revised lowed by 750,000 jobs. (Chart 2 below).
If Goldman Sachs’ estimate is in the neighborhood of correct, it would mean:
The economy was much worse in the period leading up to the US Presidential election than official numbers suggested (conspiracy theorists run wild);
Based on employment (we also show inflation below), perhaps Trump is correct in calling for the Fed to ease (as always we can debate the style in which he asked for the ease);
Despite Fiscal Spending at levels previously only associated with recessions (see chart 4 here), the US economy (or at least employment) isn’t exhibiting much strength;
The 400 PHDs at the Fed who are using these data gathering techniques in the age of AI and Trump should consider readying their resumes (chart 3 here).
With the S&P 500 around our year-end target of 6400, we are expecting a volatile September that leads to a typical year-end rally (see chart 5, below).
Similar to the expectations we presented last year, we expect Q1 equity market volatility. However, in 2026, we expect the duration of to be longer lasting than the 2025 v-shaped move.
What, in our view, will cause this?
We have continued to highlight three key market concerns:
Valuation - see charts 3 and 4 below. We’ve written about our concerns here several times, but simply any equity market trading at 22x forward earnings is risky and vulnerable.
Hyper-scaler spending slowdown. In addition to the Fiscal spending, we believe that hyper-scaler spending (see chart 4 here) has been the other leg of support for the economy and a source of strength for equity markets. Any slowdown in spending could have a multiplier effect.
10-Year Yields. We continue to see the path of least resistance as higher, even if the Fed cuts rates. Higher yields in a period of elevated valuations can lead to volatility.
More on these to come, but for now, like Janet Jackson said,
“Let’s take it slow…”

1. The Equal Weight S&P 500: The Real Battle
Source: TradingView. Through year-to-date 2025.
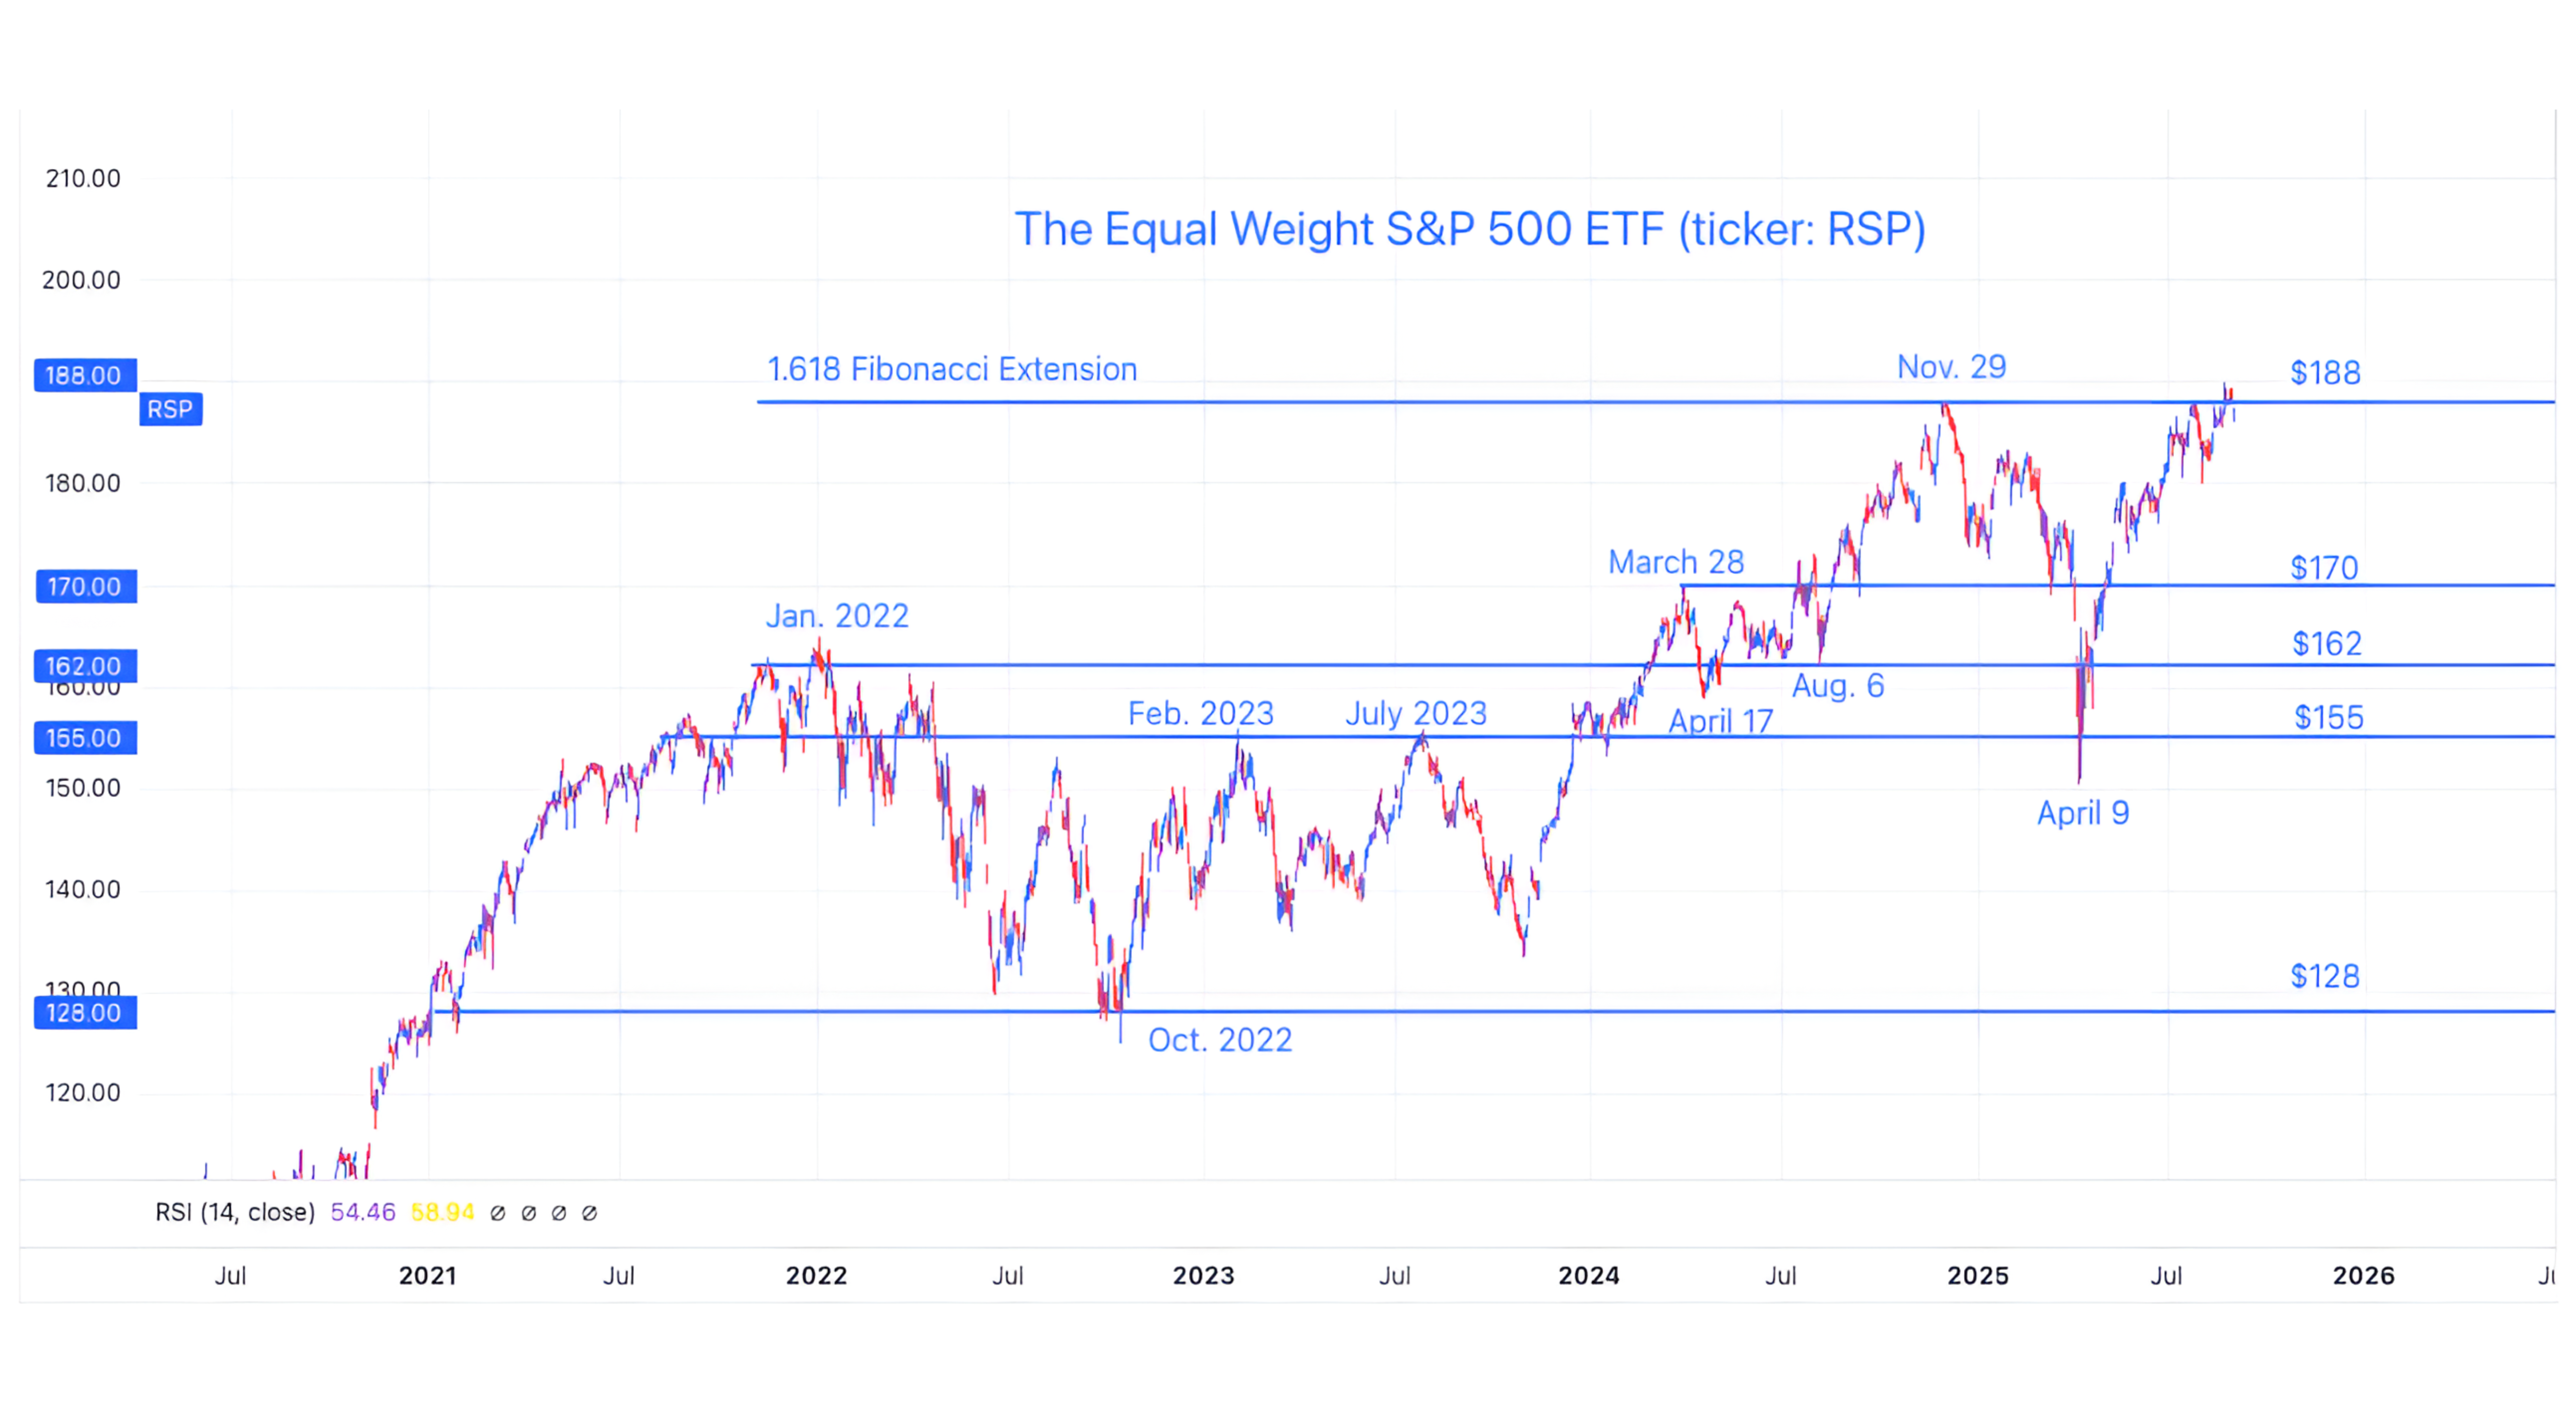
The chart above shows the Equal Weight S&P 500 ETF (ticker: RSP).
We would typically show the S&P 500, but, in our view there is very little tradeable information in an index that is between two levels that we perceive to be battlegrounds.
The Equal Weight S&P 500, as we’ve been pointing out, on the other hand has been fighting with the 1.618 Fibonacci extension of its January to October 2022 sell-off for since last November.
Last week, the Equal Weight S&P 500 hit a new all-time - slightly above its November 2024 high and since then, has quickly retreated.
In other words, the battle for the north continues.
As we recently wrote the Equal Weight S&P 500 has foreshadowed challenges in the broader S&P 500.
In late November, the Equal Weight S&P 500 began to exhibit weakness that was a precursor to the December 9 high in the S&P 500.
Similarly, the Equal Weight S&P 500 and the S&P 500 diverged during January as the Equal Weight S&P 500 continued to trade down while the (market cap weighted) S&P 500 was able to achieve a new high on February 19.
We are continuing to watch the Equal Weight S&P 500:
will it regroup, attack again and surpass its high or
will it drag and foreshadow a deeper sell-off as it did in January and February?
(This is not a recommendation to buy or sell any security and is not investment advice. Past performance is not indicative of future results. Please do your own research and due diligence).
2. The Annual Employment Revision Estimate
Source: Goldman Sachs. Through year-to-date 2025.
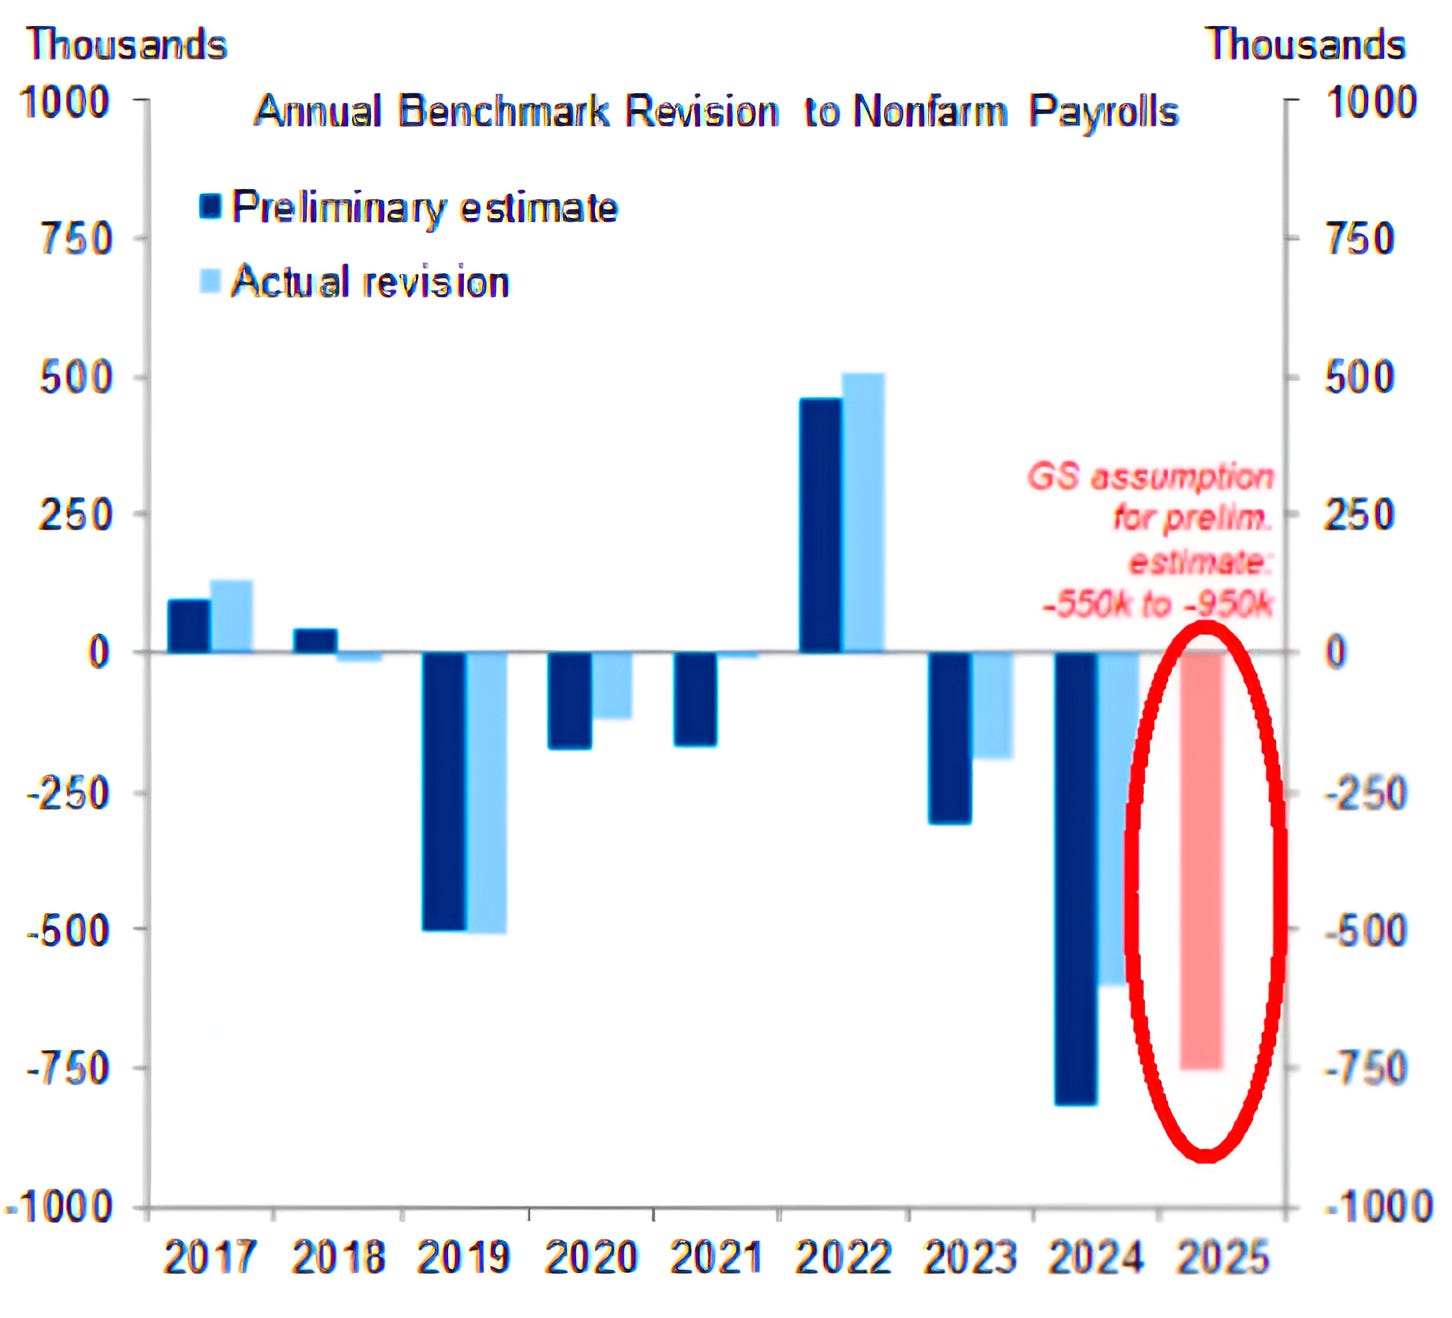
As referenced in the introduction, the chart above shows Goldman Sachs’ preliminary estimates for the Annual Nonfarm Payrolls Benchmark Revision (dark blue) and the Actual Revisions (light blue).
Goldman Sachs is estimating that there were 750,000 fewer jobs created from April 2024 to March 2025 than initially reported.
Goldman has been somewhat accurate with its estimates in the past and if the current estimate is in the neighborhood of the actual revision, it would mean that over the past two years (from April 2023 to March 2025) the monthly US employment report overstated nonfarm payrolls by over 1.2 million jobs.
This would mean that on average during the final two years of the Biden administration the monthly employment report overstated job gains by 50,000 a month on average.
When we are considering monthly job gains have typically been in the 100,000 to 300,000 range - this is a meaningful difference.
As an equity investor, the biggest drawdown risk in terms of magnitude and duration is a recession. The best recession indicator / warning signal is employment.
Given these revisions - not only are equity investors flying blind, but the Fed has been as well.
(Past performance is not indicative of future results. This is not a recommendation to buy or sell any security and is not investment advice. Please do your own due diligence).
3. S&P 500 Valuation
Source: FactSet. Through year-to-date 2025.
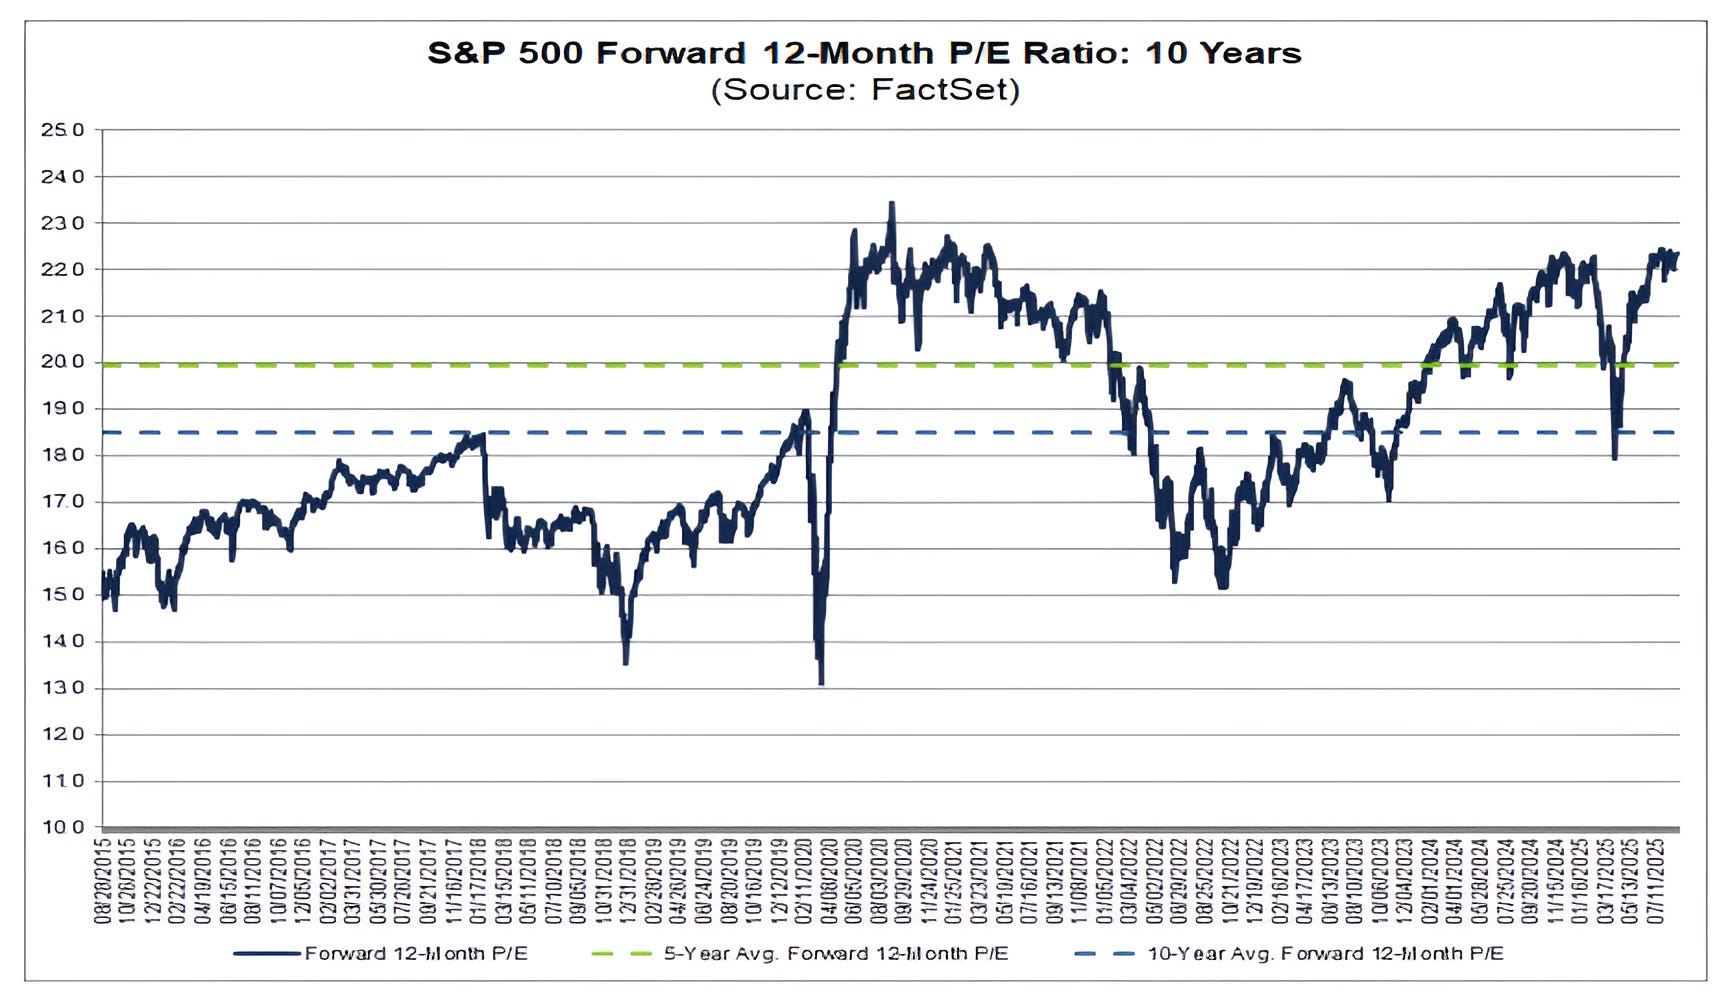
The chart above shows the Price to Forward Earnings of the S&P 500 over the past 10 years.
The S&P 500 is currently trading near its highest valuation outside of the post-covid period (when the markets rallied before analysts recognized earnings growth) of the past 10-years.
While we do not believe that valuation is a catalyst (an expensive market does not need to go down simply because it’s expensive), it is often a measure of risk.
The multiple can contract quickly.
Typically, there have been three catalyst for valuation contraction:
Significant earnings miss. In the 2000 period, a number of companies missed earnings estimates by a wide margin.
Higher interest rates. either long or short. Typically, we have seen markets react to tighter monetary which directly impacts short-term interest rates. However, in periods of fiscal dominance, (a theme of ours in 2024), longer-term yields do not come down in lockstep with Central Bank easing measures. Rather longer-term yields move higher as investors become concerned with policy.
Exogenous events. Long-term capital management and others come to mind.
We continue to think about the possibility for a slowdown in hyperscaler spending growth (chart 4 here) and higher long-term interest rates.
(Past performance is not indicative of future results. This is not a recommendation to buy or sell any security and is not investment advice. Please do your own research and due diligence).
4. Hyper Scaler Capex vs. Cash Flow
Source: BCA Research. Through year-to-date 2025.
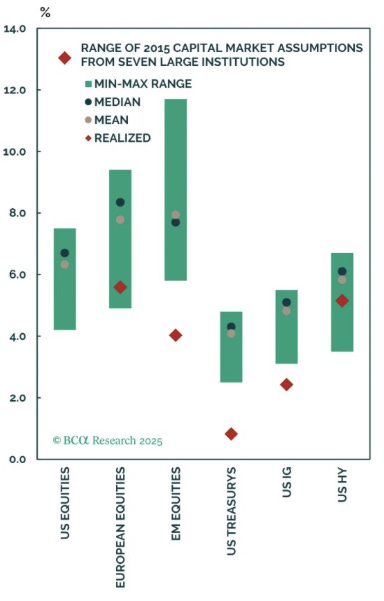
The chart above shows the min / max range (green shaded area) of the 2015 long-term return assumptions of the main asset classes from seven large institutions along with the mean (blue dot); median (grey dot); and actual results (red diamond).
When I first saw this chart, with the 10-year actual annualized returns for US equities (red diamond) of 13% basically double the mean and median expectation, I began to go through a list of factors in my head:
Easy monetary policy: most of the last 10-years was characterized by 0% interest rates and QE. When these factors haven’t been present, expectations have been managed that easing is coming.
Fiscal stimulus: We have continued to write about the nearly unprecedented fiscal spending in the US.
Policy challenges outside of the US: From the Chinese anti Alibaba policies to Europe with over-regulation / under-innovation policy and a shift to the left in Latin America made the US the worst place to invest except for all of the others.
After considering the factors above (and others), I simply looked at the valuation chart in Chart 3 above and recognized that valuations in the US were the lowest of the last 10 years (and lower than the longer-term average) and expectations (based on the chart above) were muted in that the seven major banks believed US equities would underperform European and EM equities.
Today, the opposite conditions essentially exist.
Valuations are high (top 5%) and expectations for a continuation of the last 10-years of outperformance (particularly in the Nasdaq) seems consensus.
(Past performance is not indicative of further results. This is not a recommendation to buy or sell any security and is not investment advice. Please do your own due diligence).
5. Another Bullish Statistic
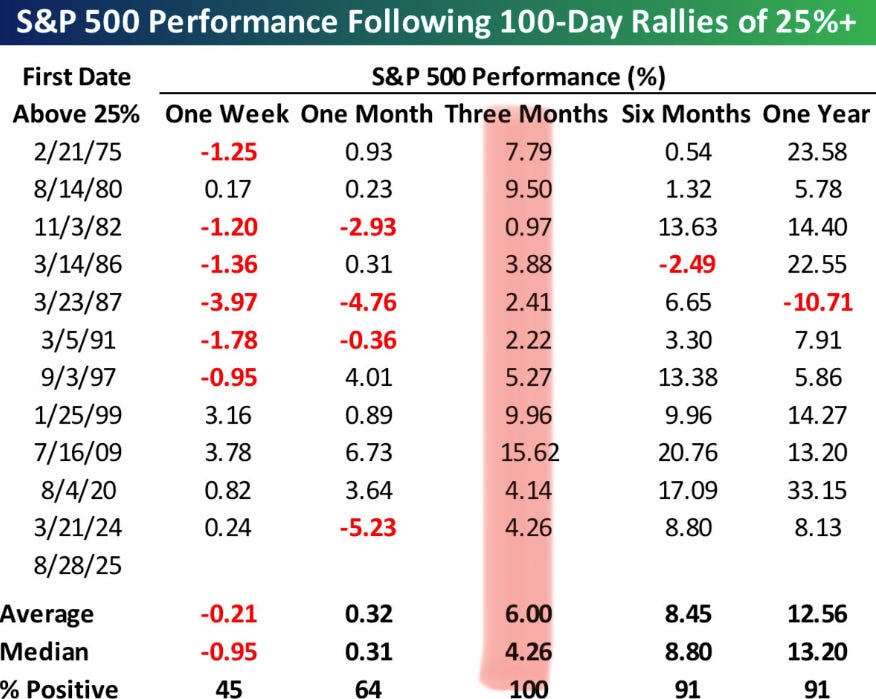
Source: Bespoke. Through year-to-date 2025.
The chart above shows the S&P 500 performance subsequent to the 11 other times that it has rallied 25%+ over 100 trading days (data since 1955).
Three months later (red highlighted zone), it has been higher every time.
While there are some technical analyses (similar to the one above) that suggest September could experience some volatility, we continue to expect a year-end rally.
(Past performance is not indicative of future results. This is not a recommendation to buy or sell any security and is not investment advice. Please do your own research and due diligence).