


Murder on the Dancefloor!
Policy uncertainty as we shift from the Biden administration to the Trump presidency has clearly led to volatility. We expect a bounce, but what will follow? Let's dig in...

“There’ll be a little disturbance, but we’re okay with that. It won’t be much.”
— President Trump, Joint Address to Congress, March 4, 2025.
I’ve spent some time trying to become, what my wife calls, a better “active listener.”
A week ago (the same day as President Trump’s Joint Address to Congress), in our introduction (here), we highlighted Treasury Secretary Bessent’s recent statement:
“We're seeing the hangover from the excess spending in the Biden years. In 6 to 12 months, it becomes Trump's economy."
In our view, he was saying that in the near-term, Biden and his team are still responsible for the economy and the market.
Throughout the last year, we highlighted the fiscal imbalances several times.
We acknowledged that the combination of $36 trillion of debt outstanding, half of which needed to be refinanced (at higher rates) between 2025 and 2027 (see chart 4 here) combined with extreme fiscal spending (see chart 5 here and chart 4 below) would be a challenge for whomever was elected.
Exacerbating this challenge (or as a result of it) - in our view - is the fact that the US is in a fiscal dominance regime.
What does this mean?
As we’ve described it (see chart 4 here; here; in chart 5 here; in the introduction here; chart 2 here; and chart 2 here), it means that the US has so much debt outstanding that the Fed no longer has control of long-term interest rates - the market does.
We expected this to set the stage for quantitative easing (QE) after some equity market volatility this year. (QE is when the Fed purchases long-term bonds to drive rates down).
While this is still possible, earlier this year, Fed Chair Powell said that he would not implement QE until the Fed Funds rate was at 0% (it’s currently 4.25-4.50%).
As a reminder, there is a Fed meeting next week (with a rate decision announced next Wednesday).
However, last Friday Chair Powell said, “We do not need to be in a hurry and are well positioned to wait for greater clarity.” (Active listening).
In the meantime, the uncertainty around the economic outlook (we highlighted concerns over the past two weeks chart 4 here, chart 2 here and chart 4 here) is continuing to lead to equity volatility.
In our view, equity markets are likely set for a bounce (see chart 2), but we see limited scope for equity indexes to revisit their recent highs in the near-term.
From an equity market perspective, we think it will be difficult for many companies to achieve their current earnings projections given the slowing and uncertain growth environment.
Stated more simply, if growth is slowing (and uncertain), we have a difficult time believing that the S&P 500 will grow earnings 11% in 2025 and 14% (off of an inflated 2025 number) in 2026. (To be fair, this has been a complaint of ours for some time and has not mattered).
The current S&P 500 earnings estimate for 2026 is $309. Our view is that the S&P 500 will earn $300 in 2026 (Goldman says $288 in chart 3 here).
If we believe that the S&P 500 will mean-revert to its long-term average of 16x forward earnings (we’ve highlighted this level several times but a clean example is chart 4 here), this would imply an S&P 500 level of 4800. This is not a prediction but a possibility.
Last June (here), we wrote that the S&P 500 could bottom at 4000-4200 in 2025. In early November (here), we revised that view and wrote:
“We would now call this a 30% chance of a 20-30% sell-off from a level of around 6000 in the S&P 500 leading the index back down to a range 4200-4800.
We see this occurring in the first half of 2025 and, in our view, it will most likely be met with a new round of quantitative easing (they may give it another name - but it will be Fed balance sheet expansion).”
While we don’t know if this will happen, we have added cash to our portfolios and have selectively been trading puts and put spreads.
As Treasury Secretary Bessent recently said,
“The market and the economy have just become hooked, and we’ve become addicted to this government spending, so it's a much-needed course adjustment.”
(Active listening - if you see my wife, tell her I’m working on it).
Given the speed and magnitude of the sell-off, we expect to see a bounce (~5%), but we do not believe the volatility or “course adjustment” is over. Active traders can play the bounce if they wish.
As a key theme of ours (see the introduction here) has been the transition from Treasury Secretary Yellen to Treasury Secretary Bessent, as the economy and markets detox from their fiscal spending addiction, it could lead to…
Murder on the Dancefloor.

1. The S&P 500 ETF: Falling Below the 200-Day Moving Average
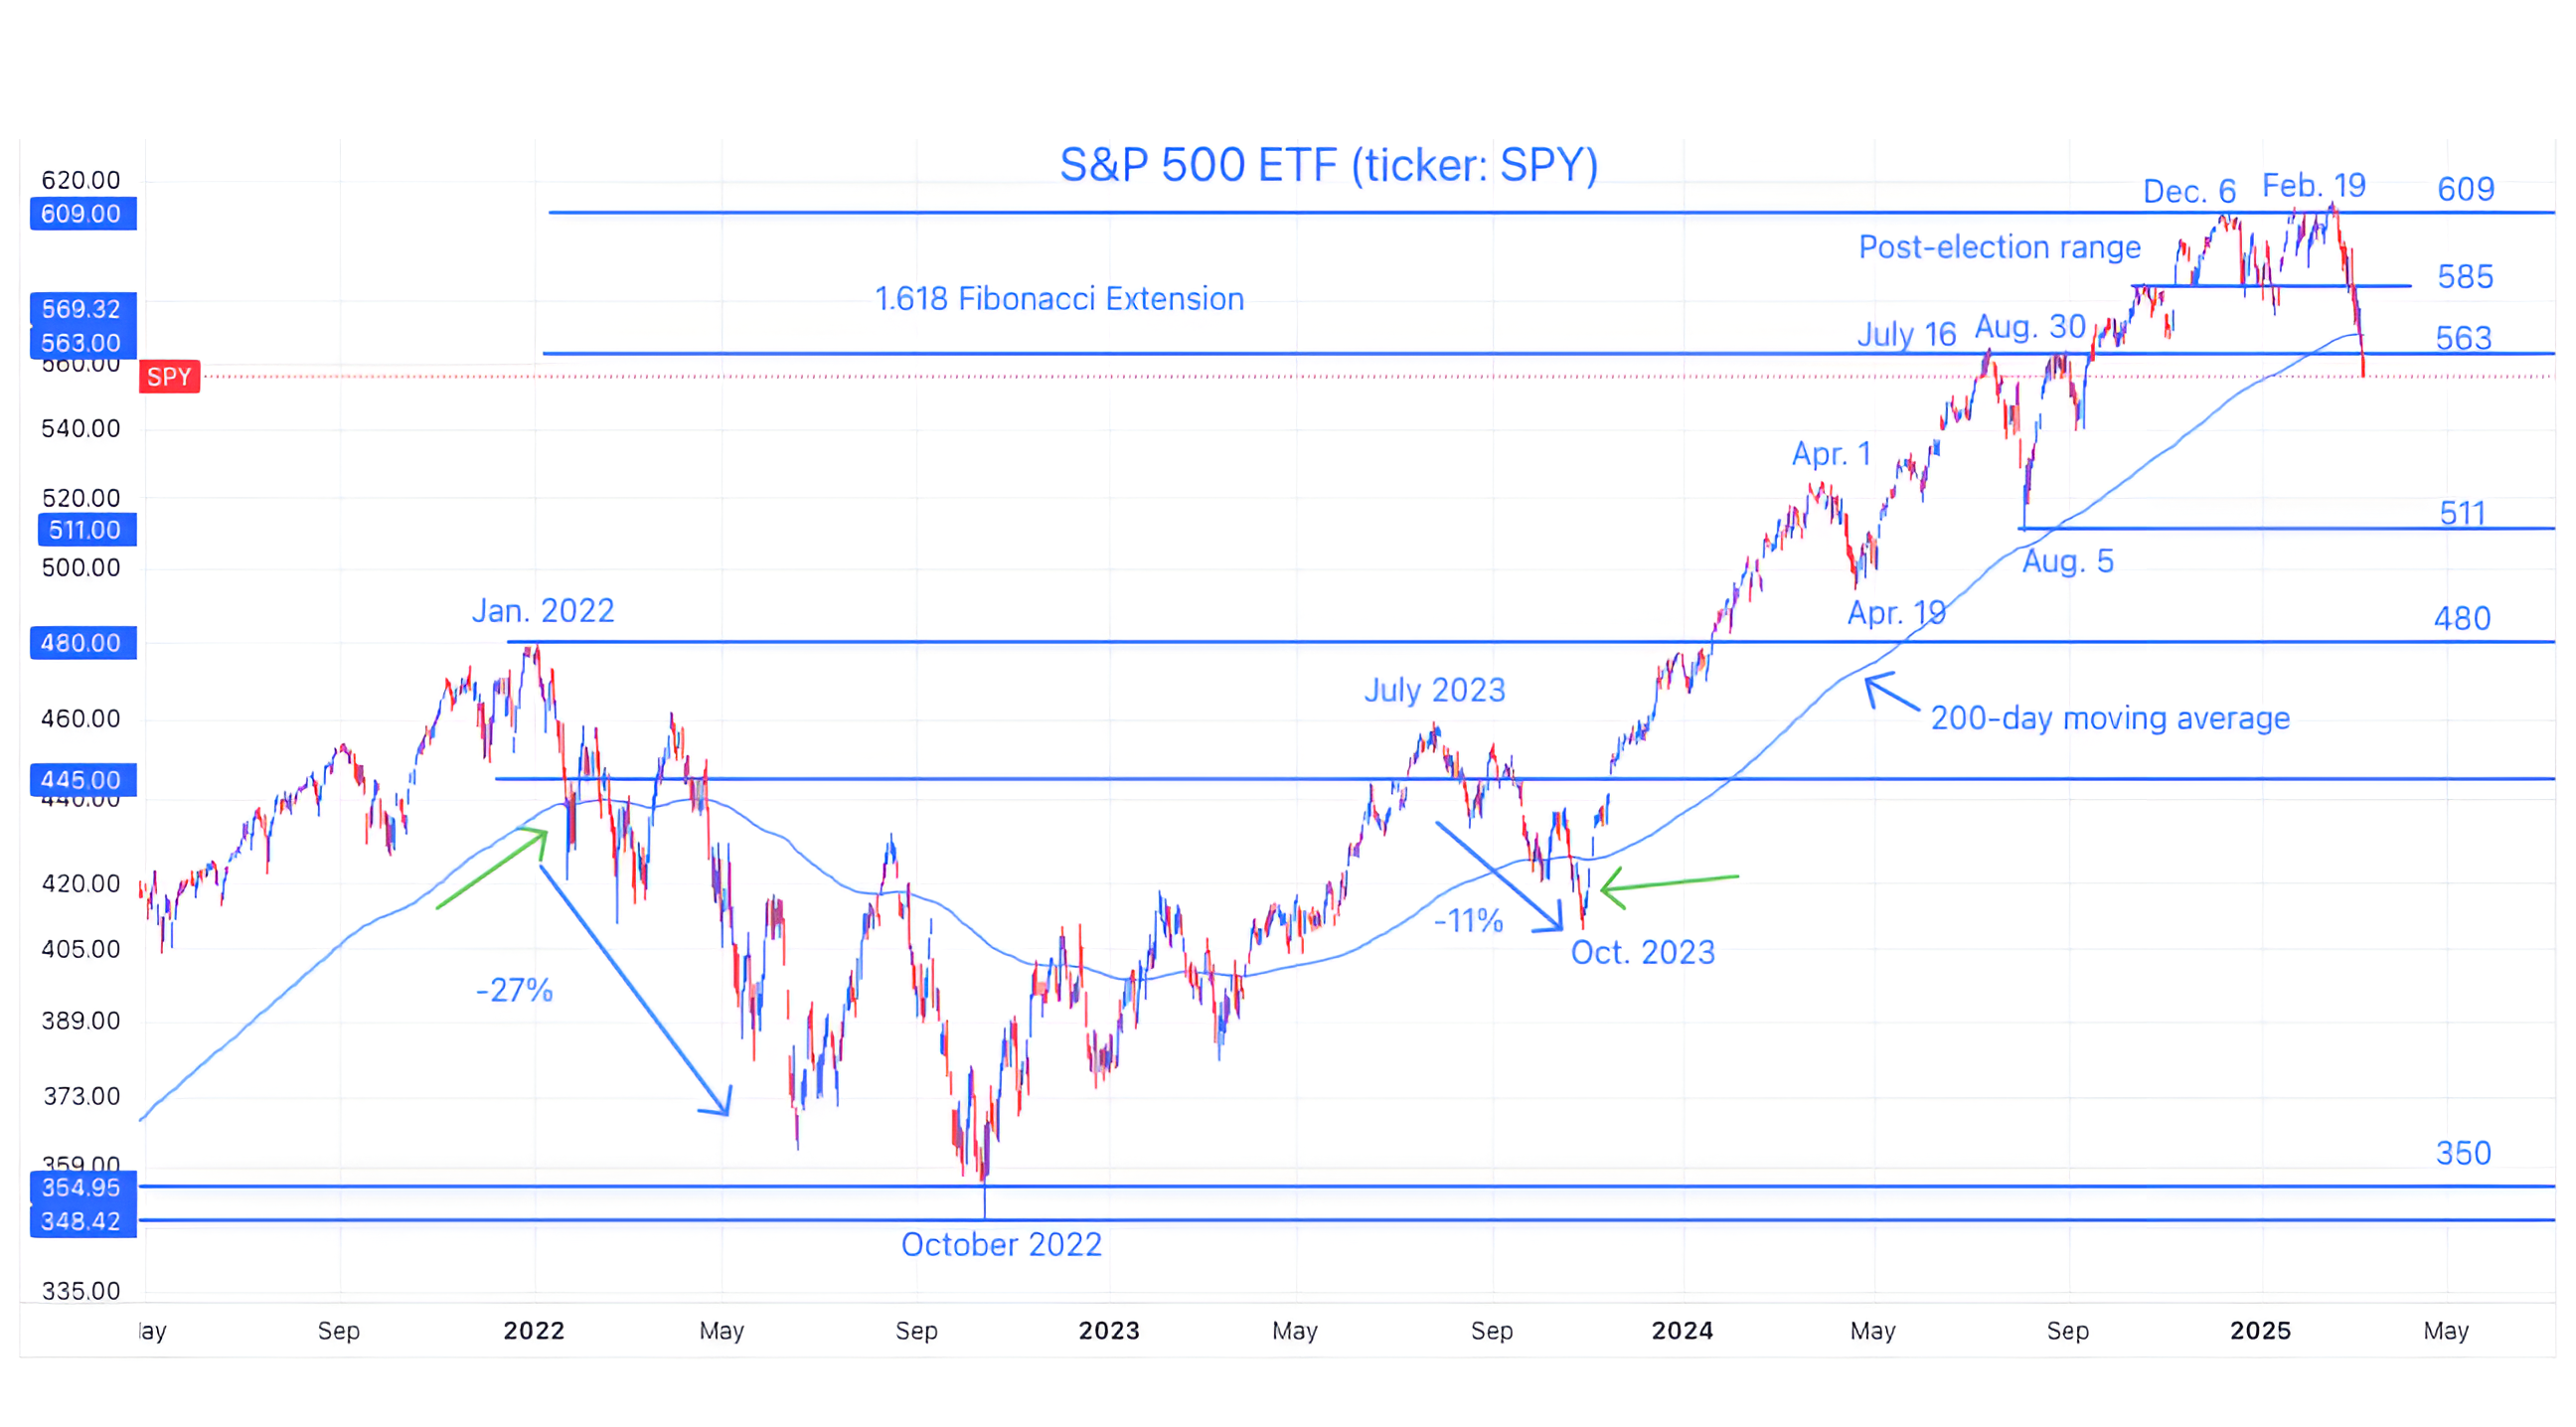
Source: TradingView. Through year-to-date 2025.
The chart above shows the S&P 500 ETF (ticker: SPY) with its 200-day moving average (curved light blue line).
Like the Nasdaq 100 ETF, which we showed last Thursday, the S&P 500 ETF has now fallen below its 200-day moving average and the 1.618 Fibonacci extension of its 2022 sell-off.
With the break below the 200-day moving average, we now want to see if the current period is more like:
early 2022 (left green arrow), when the S&P 500 moved above its 200-day moving average twice before falling further, or
October 2023 (right green arrow) when the S&P 500 ricocheted above its 200-day moving average and never looked back.
We expect a bounce but based on policy, US growth, and valuation, we favor the early 2022 scenario (65-70% likelihood) to the October 2023 scenario (30-35% likelihood).
(See chart 5 for recent S&P 500 behavior after it has dropped below the 200-day moving average).
(This is not a recommendation to buy or sell any security and is not investment advice. Past performance is not indicative of future results. Please do your own research and due diligence).
2. The Total US Equity Market
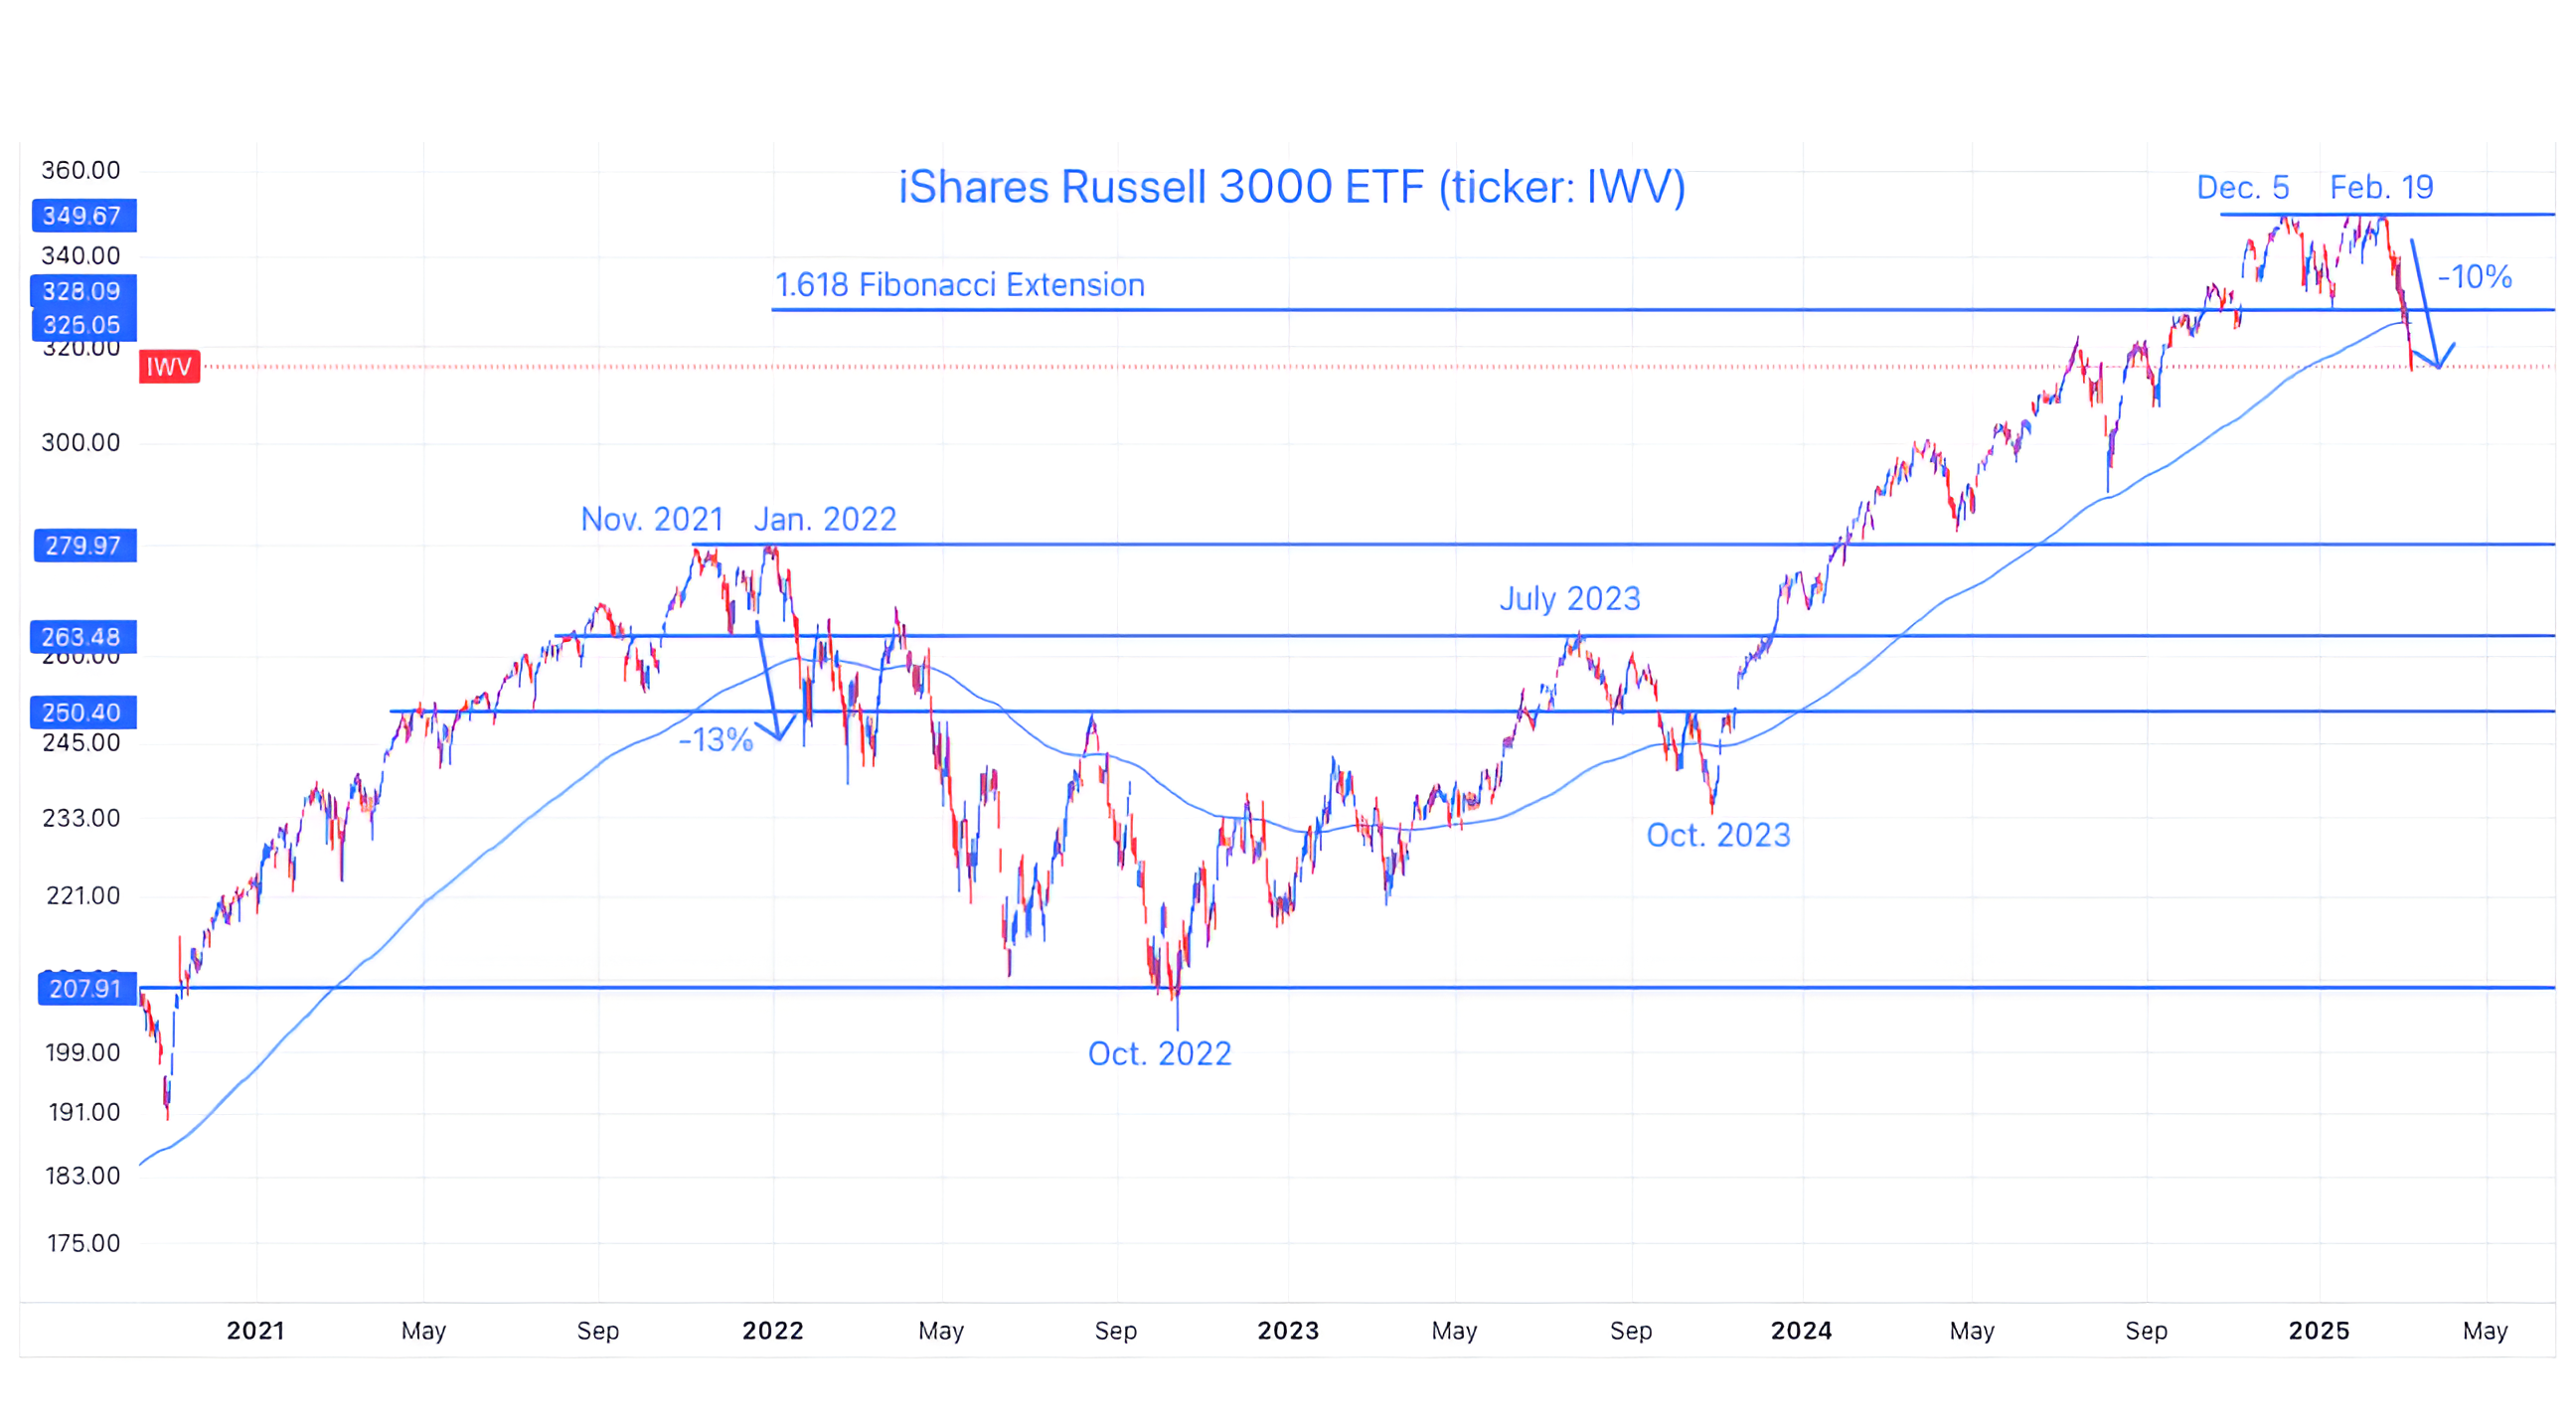
Source: TradingView. Through year-to-date 2025.
The chart above shows the Russell 3000 ETF (ticker: IWV) with its 200-day moving average (curved light blue line).
The Russell 3000 includes all of the largest US stocks - the Russell 1000 - plus the Russell 2000 Small Caps.
When we look at the chart we see some potential parallels with the early 2022 period.
First, it is notable that there was a double top two months apart in 2021 / 2022 and in 2024 / 2025.
After the double top, in both instances, there was (has been) a relentless sell-off.
In 2022, the Russell 3000 dropped 13% (peak to intra-day low) over 13 trading days.
In the current period, the Russell 3000 has dropped 10% over 14 trading days (including today).
In both instances, the Russell 3000 ETF fell below its 200-day moving average.
After its 13% drop in 2022, the the Russell 3000 gained 8.5% over the next 13 trading sessions.
We would expect a similar bounce soon.
It is important to note that these characteristics do not mean that we are expecting a repeat of the 2022 drawdown. However, in our view, it means its a possibility.
(Past performance is not indicative of further results. This is not a recommendation to buy or sell any security and is not investment advice. Please do your own due diligence).
3. More Pain Under the Surface
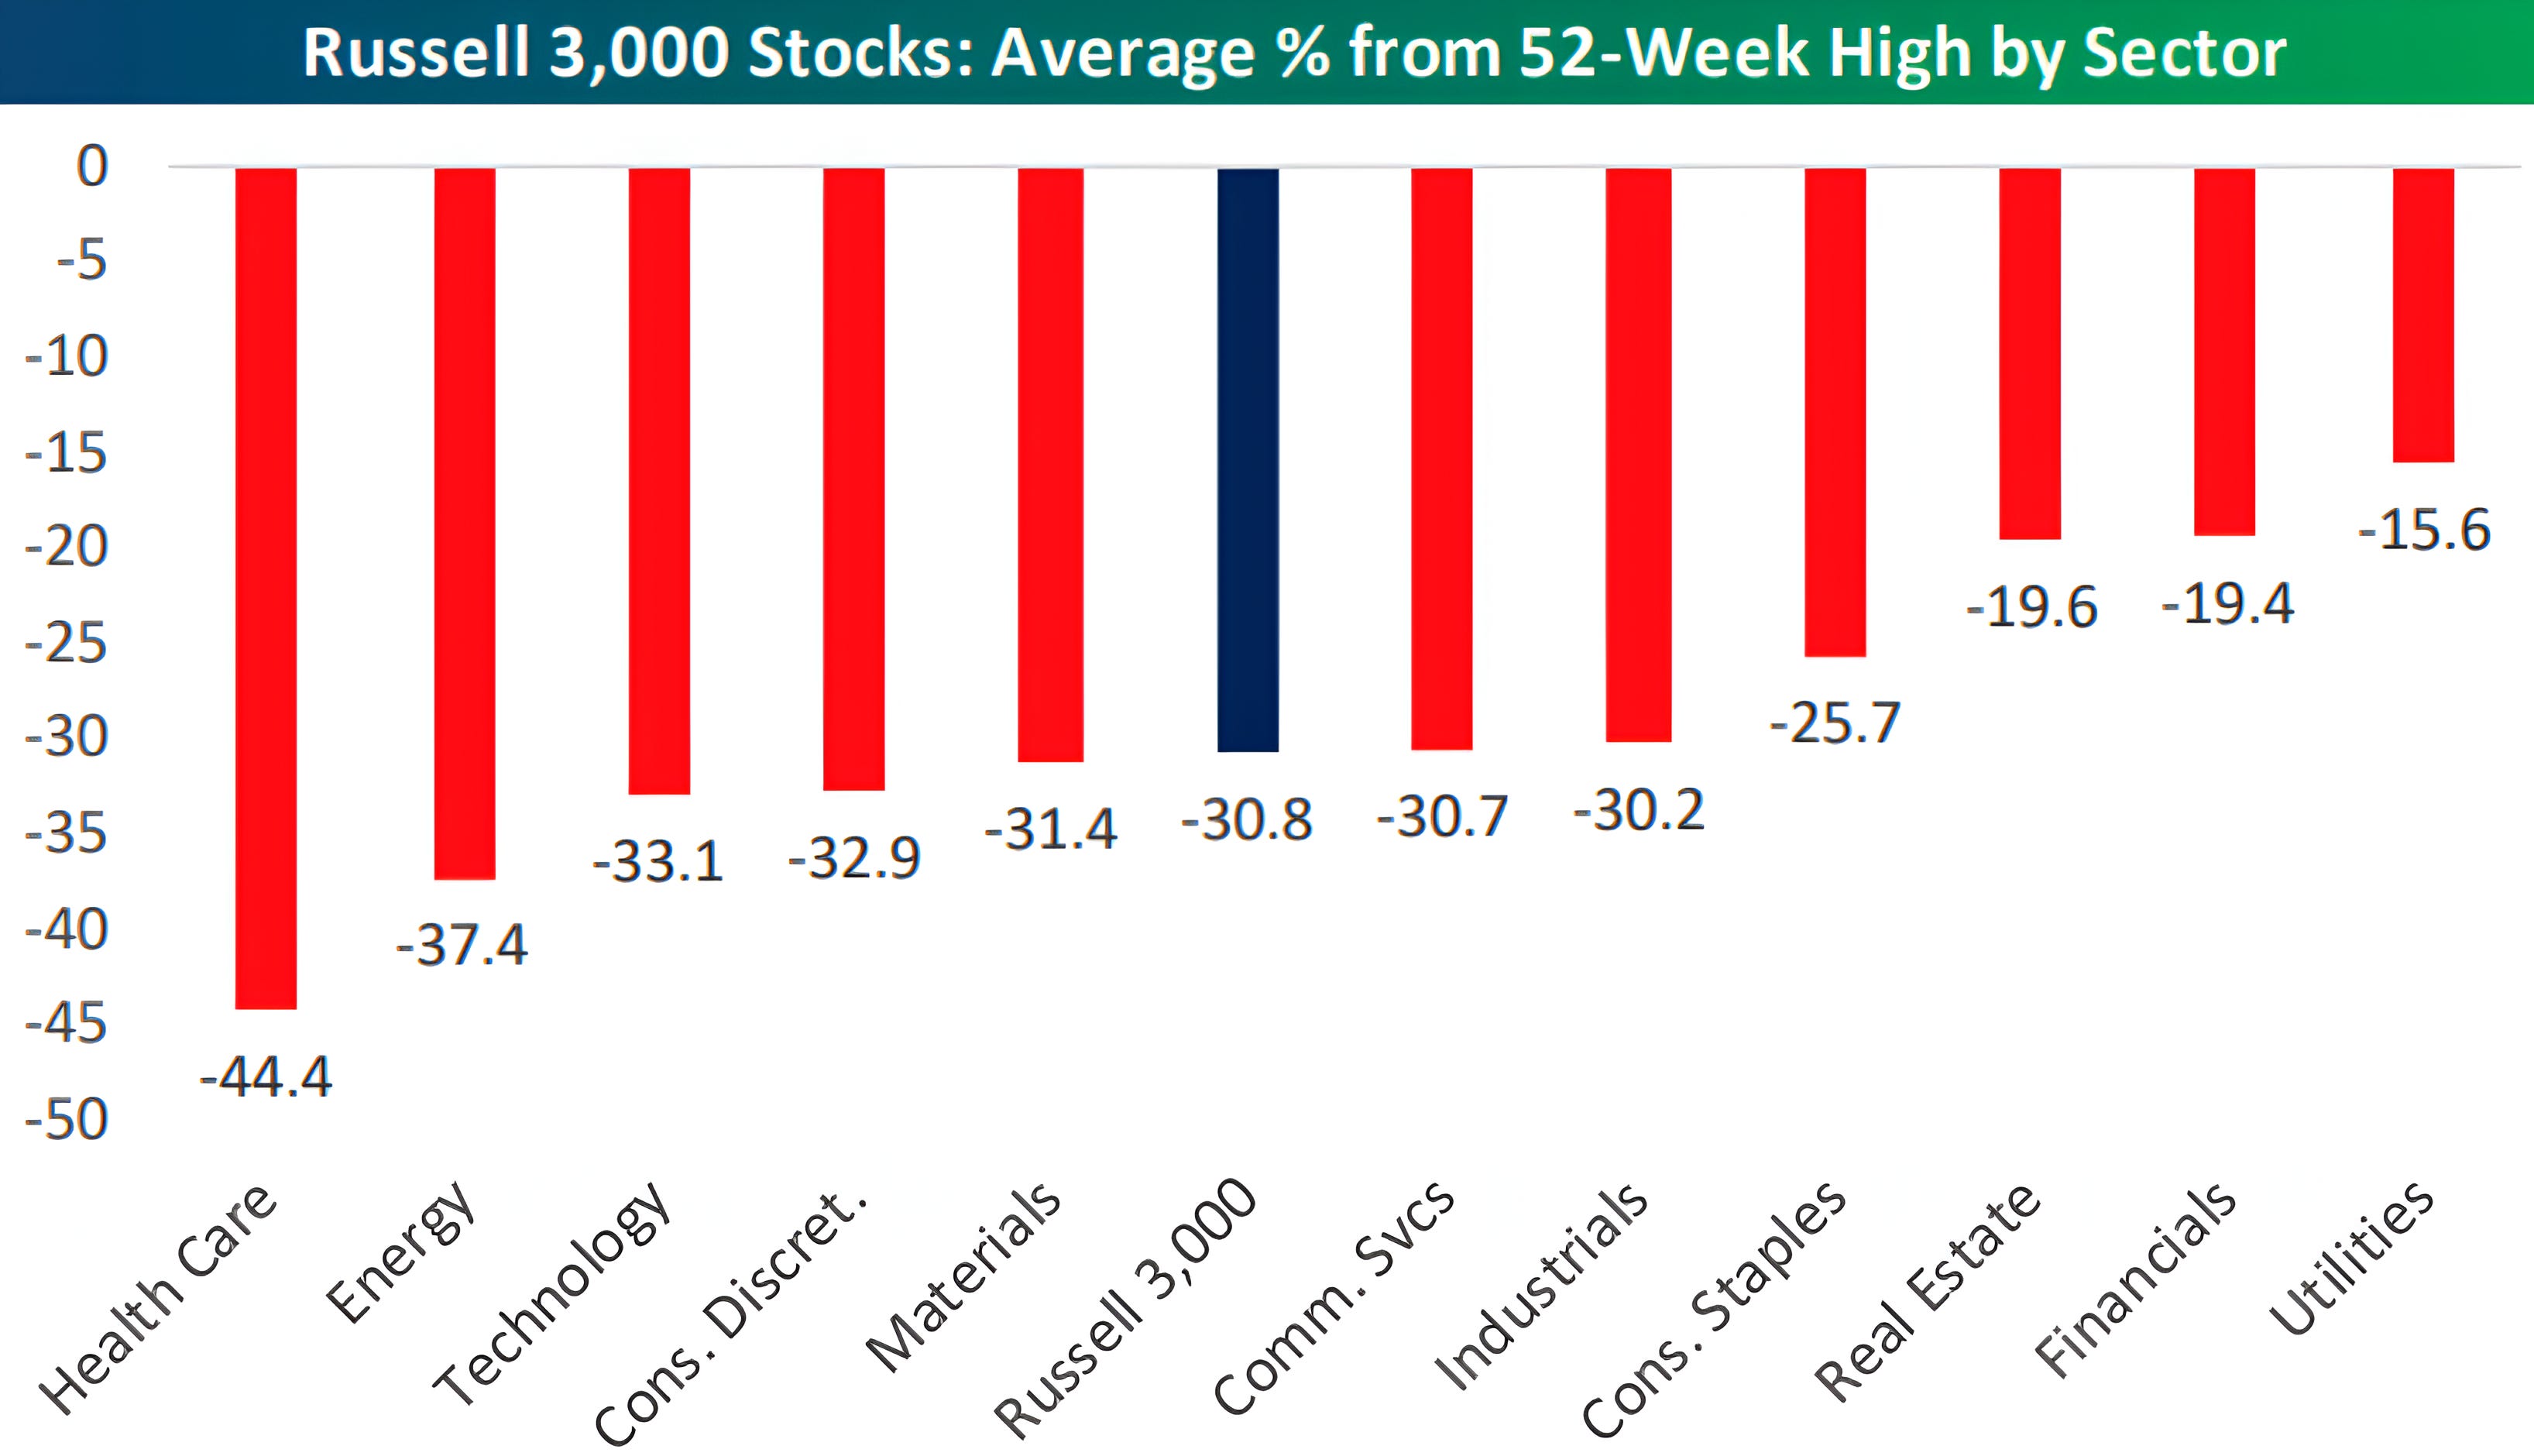
Source: Bespoke. Through year-to-date 2025.
The chart above shows the Russell 3000 Stocks Average Drawdown from their Respective 52-Week High.
On an individual share basis, the average drawdown from for the 3000 stocks in the Russell 3000 is 31%.
In other words, if you have a portfolio of individual shares, rather than a fund or ETF that tracks an index, the chances are that your portfolio is down more than the 10% drop in the index.
This may also mean that several individual stocks may be ready to stabilize and recover, at least temporarily.
(Past performance is not indicative of future results. This is not a recommendation to buy or sell any security and is not investment advice. Please do your own due diligence).
4. The US Deficit as a Percent of GDP
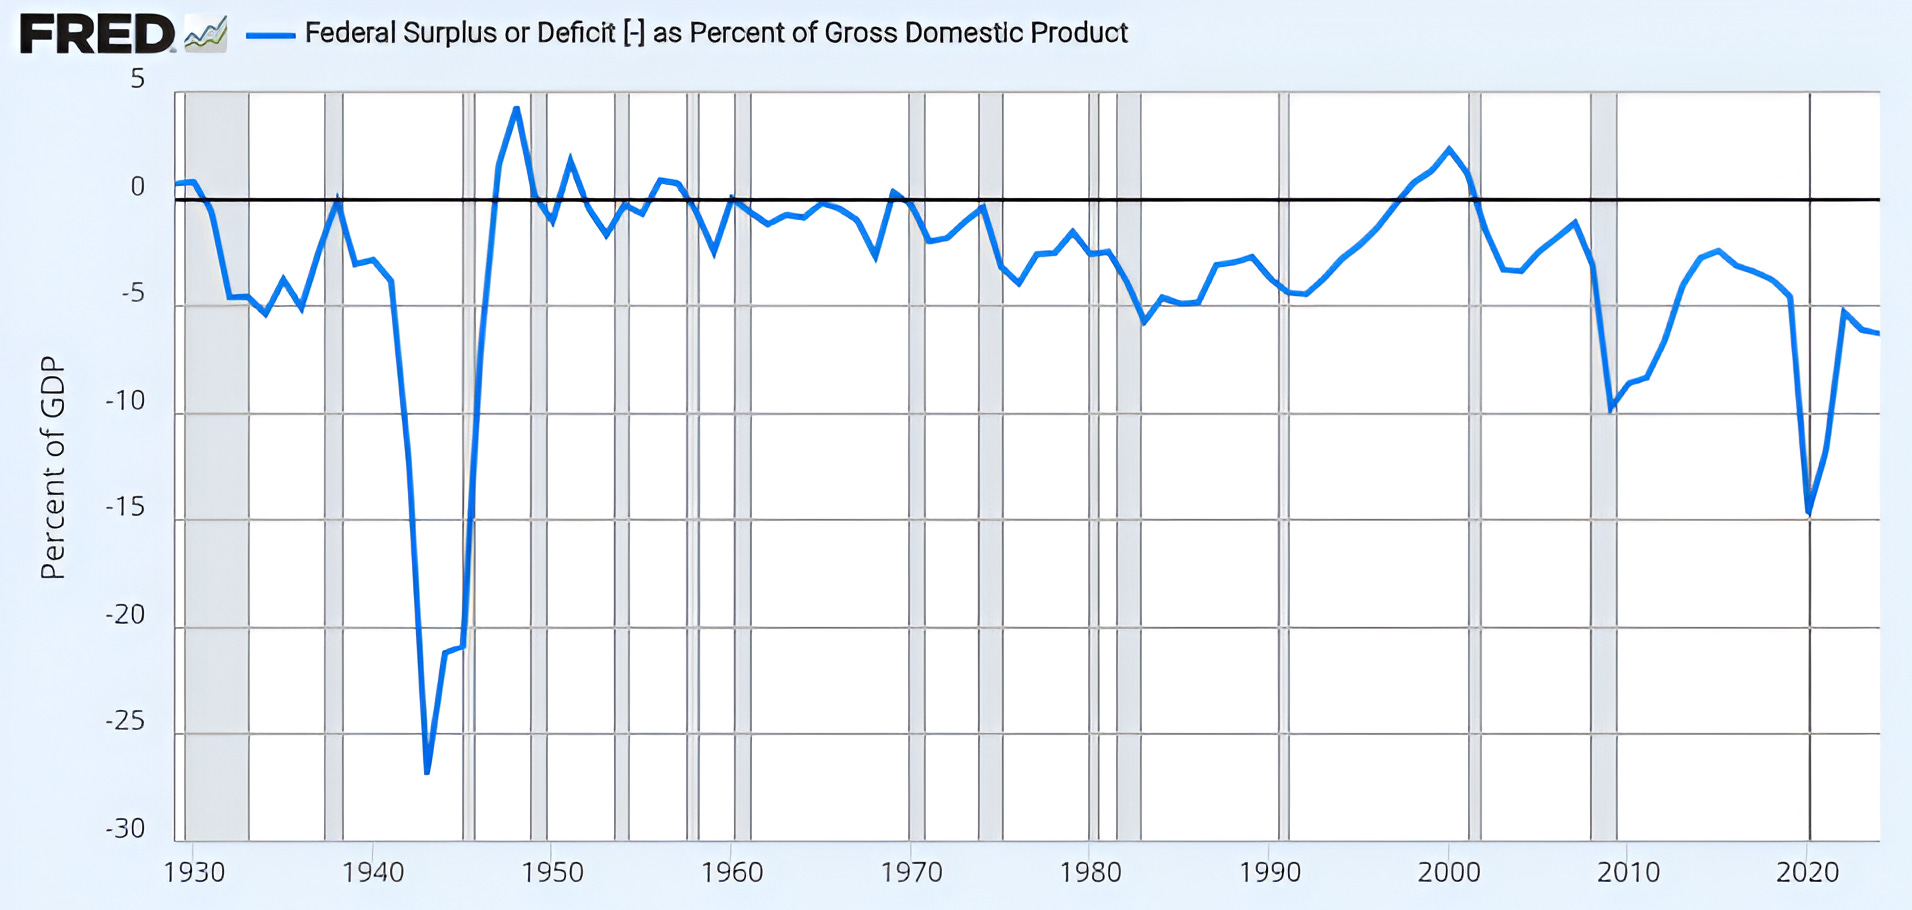
Source: Federal Reserve Bank of St. Louis (“FRED”). Through year-to-date 2025.
The chart above shows the US Fiscal Surplus / Deficit as a % of US GDP since 1930.
While we have alluded to the US Fiscal Deficit (and the debt outstanding) several times (see chart 5 here), we wanted to show it directly.
Currently, the US Fiscal Deficit as a % of GDP is 6.3%.
To put this in perspective (which is why we’re showing the chart), over the past 70 years, there have only been two other times, when the deficit was greater than 5.5%.
The first time was in the aftermath of the Financial Crisis, when the US implemented TARP to recapitalize the banks and stimulate the economy. The other time was in the middle of covid.
Prior to 1950, the deficit was greater than 5.5% one time and it was to fund World War 2.
(Past performance is not indicative of future results. This is not a recommendation to buy or sell any security and is not investment advice. Please do your own research and due diligence).
5. What Has Happened After the S&P 500 Has Dropped Below its 200-Day Moving Average…

Source: NewEdge Wealth. Through year-to-date 2025.
The chart above shows the instances since 2009 when the S&P 500 has fallen below its 200-day moving average.
On average, once it has dropped below its 200-day moving average, the S&P 500 has moved another 8% lower.
However, there have been two times (out of 15 instances) when the S&P 500 has had no further downside and nine (including the two with no further downside) times when it has dropped less than 5% after breaching its 200-day moving average.
In other words, 60% of the time after falling below its 200-day moving average, since 2009, the S&P 500 has dropped less than 5% more.
One third of the time however (5 of 15 instances), the S&P 500 has dropped another 10% or more.
The good news is that if an investor had bought the S&P 500 on the day that it dropped through its 200-day moving average, the one year return has averaged 17% with only one negative return.
This is consistent with chart 5 from last Tuesday and last Thursday which both showed the possibility for near-term volatility and longer-term upside.
(Past performance is not indicative of future results. This is not a recommendation to buy or sell any security and is not investment advice. Please do your own research and due diligence).