


Highway to the Danger Zone...
If all I had to base my US equity investment decisions on were charts, I would "back up the truck" and be leveraged long. Unfortunately, I'm old fashioned and care about fundamentals. Let's dig in...
Over the past month, since around the time the Fed announced their 50 basis point cut, four things have happened in markets that typically don’t coincide:
The S&P 500 has rallied 8% (see chart 1).
S&P 500 earnings expectations over the next 6 quarters (from Q3 2024 (inclusive) through Q4 2025) have been reduced 1% (we have highlighted this here).
The 10-Year US Treasury yield has increased from 3.6% to 4.1% (see chart 4).
The US dollar has strengthened.
While this fundamental and macro backdrop seems almost contradictory, the the charts of the S&P 500 and the Equal Weight S&P 500 (charts 1 and 2 below) could be straight out of the “bullish patterns” chapter in a technical analysis textbook.
There’s an adage within technical analysis - “the chart comes first, and the explanation come later.”
As an “explanation” of the charts, we have continued to highlight our view that the combination stealth (see here, here, here, here, here, here, here, chart 4 here and here), traditional liquidity and extreme fiscal spending (budget deficits ~7% of GDP) have led to top decile S&P 500 valuations (chart 3).
With US Q3 earnings season here, we will have more insight into the fundamental part of the story. We expect Q3 earnings to exceed lowered expectations, however, our focus is on Q4 and 2025.
Given our view that Q4 and 2025 earnings will continue to be lowered, the combination of elevated valuation (chart 3); higher 10-Year yields (chart 4); increased inflation expectations (Michigan survey); extreme bullish sentiment (CNNs fear greed index); and US indexes which have not taken a pause, we see heightened near term risk of a small correction (~2-5%).
Within our portfolios, we have consistently reconciled the combination of the bullish technical set-up and questionable macro and fundamental backdrop by remaining invested, but, when appropriate adding puts and put spreads.
We are currently adding puts and put spreads to our portfolios as we believe this an appropriate time.

1. The S&P 500: Picture Perfect

Source: Trading View. Through year-to-date 2024.
The chart above shows the S&P 500 ETF (ticker: QQQ).
As we showed last Tuesday (here), the S&P 500 has surpassed its July high and is trading at all-time highs.
From a bullish technical perspective - this chart has everything you would want to see.
Since the October 2022 low, the S&P 500 has stair-stepped higher making a series of higher-highs and higher lows.
Furthermore, over that time, it has fought with, surpassed and checked back (revisited or retested) key levels.
An example of this is from March of this year:
The S&P 500 achieved a new high and then retraced 23.6% (an Fibonacci retracement level) of its October 2023 to March 2024 rally;
After the retracement, the Index bounced and fought with the March 2024 high (healthy) before moving to a new high in early July;
It then retraced 78.6% (another Fibonacci retracement level) of its April to July rally and simultaneously re-tested the March high; and
Moved back to the July high, fought a little and eventually moved higher again.
In early June, when the S&P 500 was at 5250, we highlighted our second half view here:
“While our S&P 500 target is 5500, it is possible in a blow-off top type scenario that the S&P 500 could move to 5600 or even 5800.
That said, we are beginning to see possible cracks in the foundation of the market’s ascent that, in our view, could become more apparent either late this year or in early 2025.”
Based purely on the technicals and ignoring the fundamentals (downward earnings revisions ~7% earnings growth) and valuation (top decile - see chart 3), we could see a move higher above our early June 5600-5800 range to 6000.
The 6000 view is based on symmetry.
This is the “symmetric” move higher from the January 2022 high (4800) and the October 2022 low (3600).
The symmetric target higher is calculated by adding the point difference (1200) between the high and the low of the sideways move to the high (4800).
As John Tudor Jones (a noted macro hedge fund manager) says, “Sometimes, you just need to close your eyes and trust the price action.” (Paraphrased)
The longer-term price objective is 6900.
6900 is the 2.618 Fibonacci extension of the January 2022 to October 2022 sell-off.
As a reminder, we believed a key level for the S&P 500 for this year was 5620, which is the 1.618 Fibonacci extension of the January 2022 to October 2022 sell-off. (We identified this level across indexes and the Nasdaq 100 is still battling there).
While these Fibonacci levels may appear arbitrary, in an environment that has been driven by liquidity, when valuation seems unanchored (see chart 3), we believe that this framework is as valuable as typical fundamental analysis.
Although our near-term upside objective for the S&P 500 is 6000 (+2.8%), we would not be surprised to see a move back towards 5620 (-3.5%) between now and then.
This view doesn’t require selling equity exposure, but if appropriate, it does likely warrant adding puts and put spreads at current levels.
(This is not a recommendation to buy or sell any security and is not investment advice. Past performance is not indicative of future results. Please do your own research and due diligence).
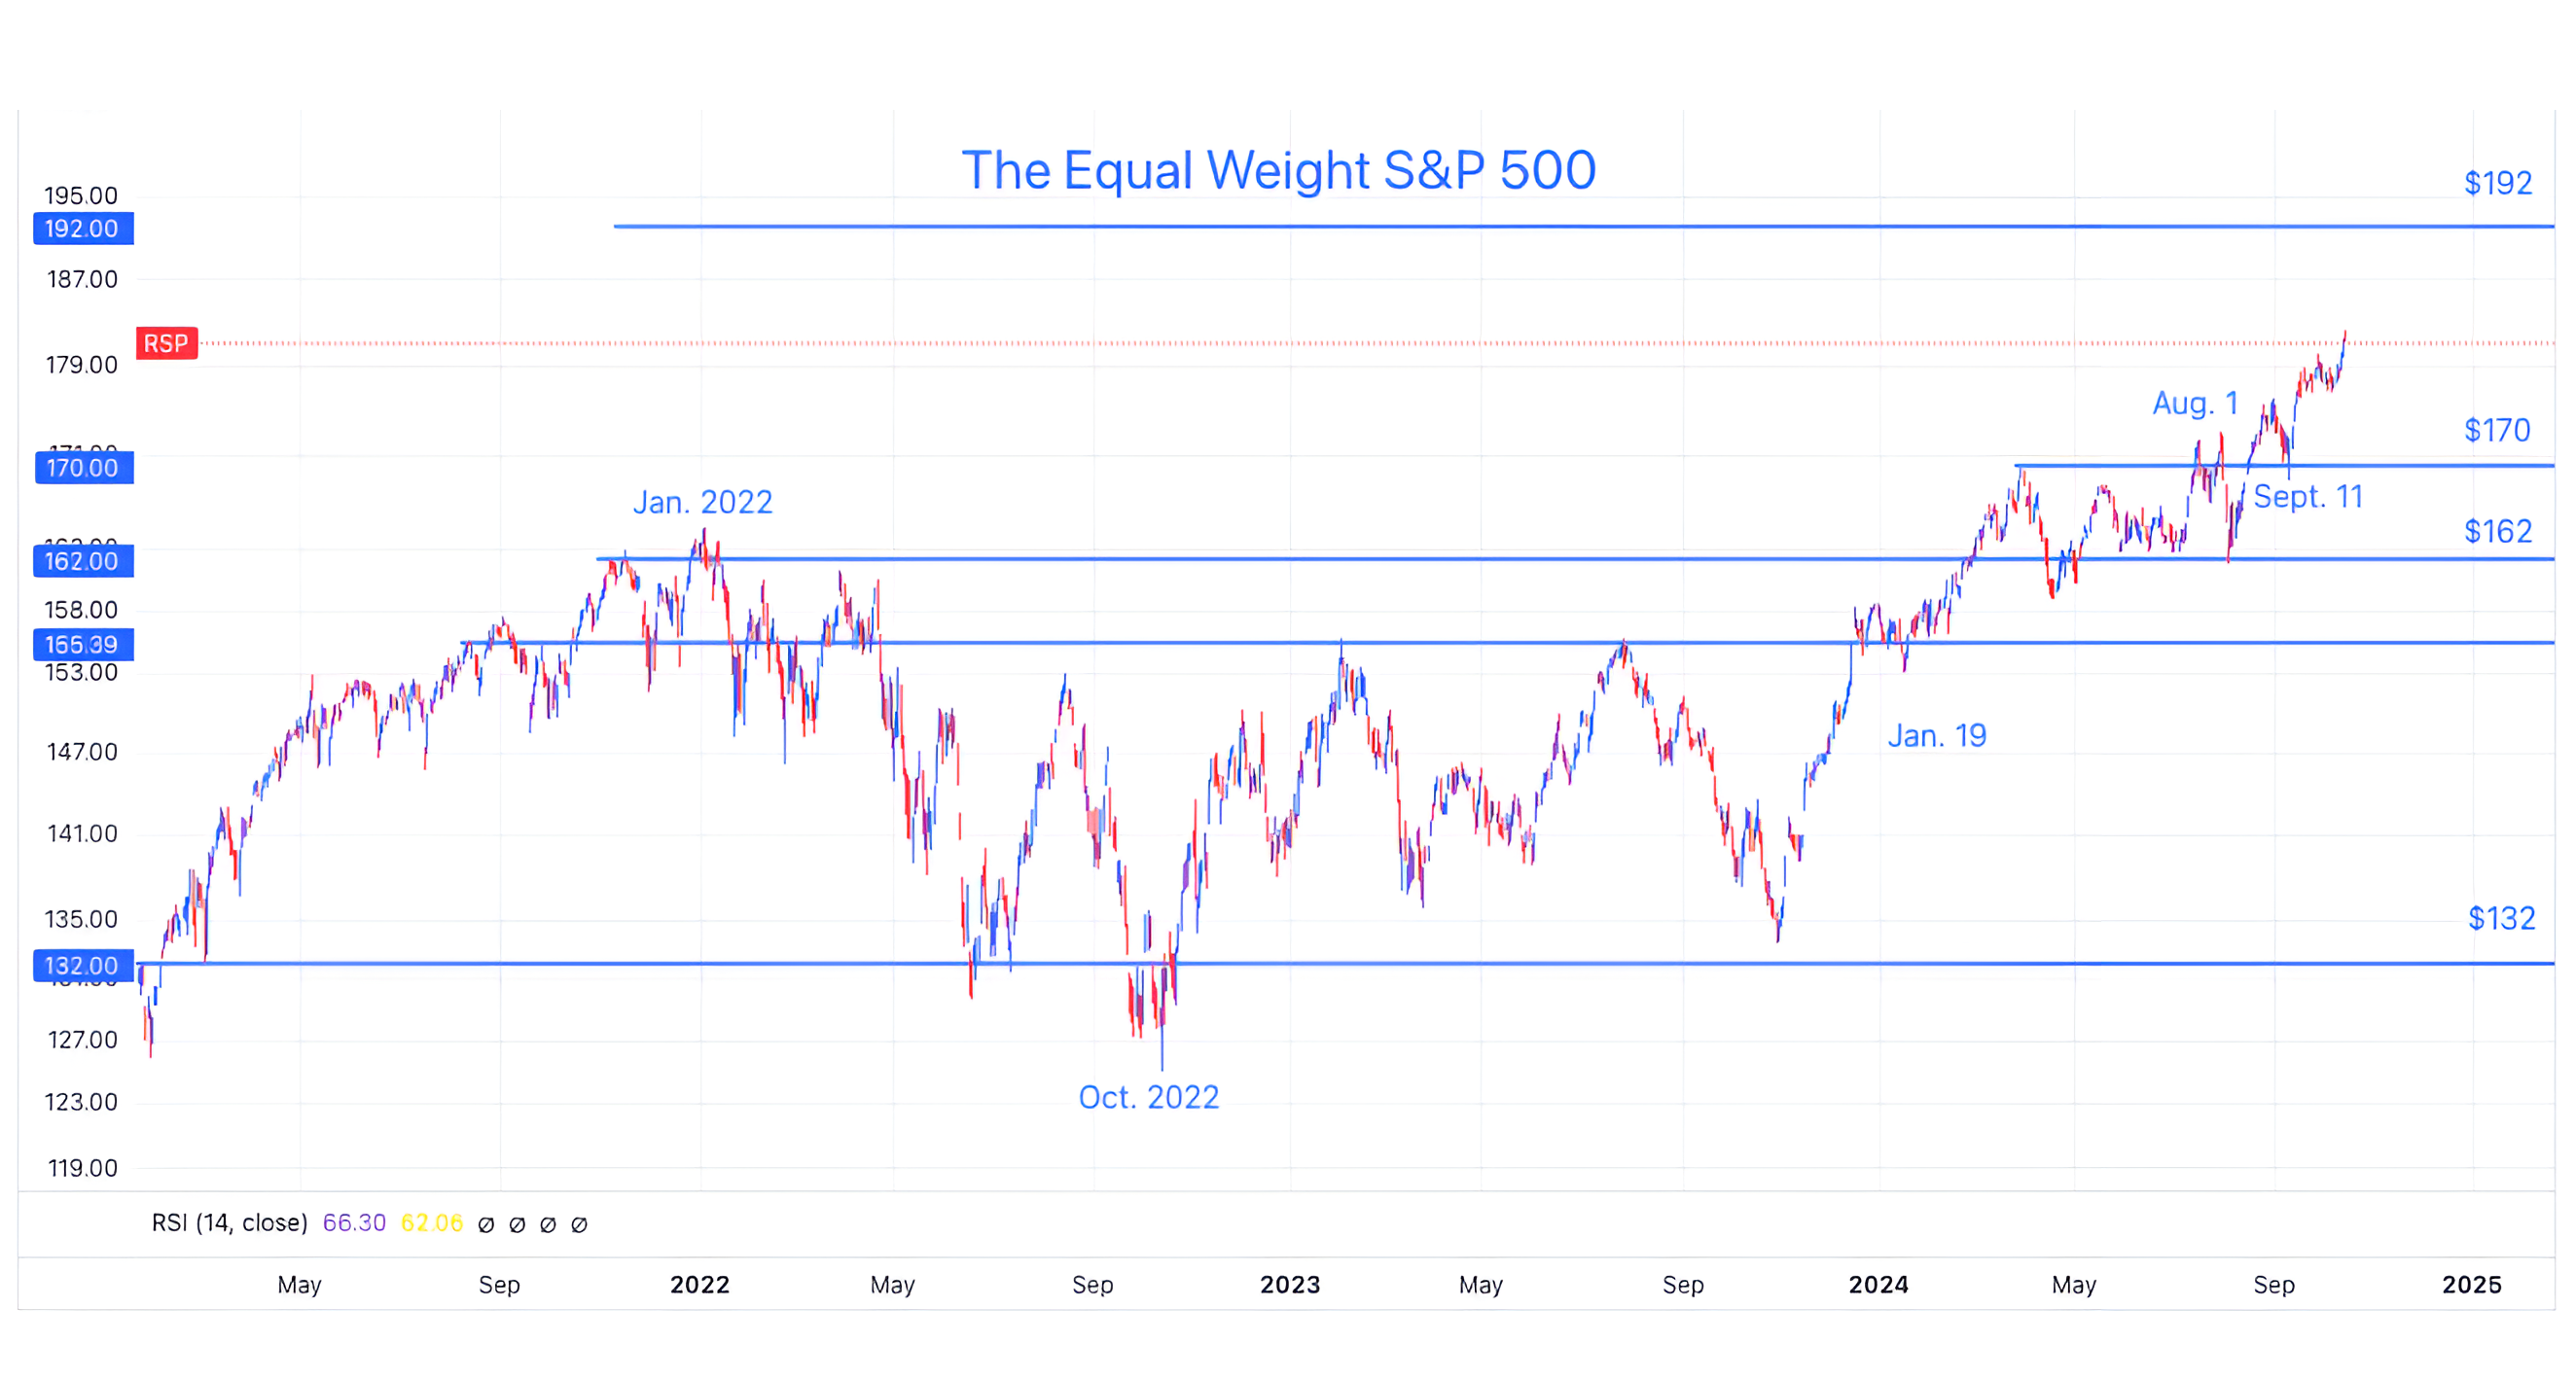
2. The Equal Weight S&P 500: Confirming the S&P 500
Source: Trading View. Through year-to-date 2024.
The chart above shows the Equal Weight S&P 500 (ticker: RSP).
We always monitor the Equal Weight S&P 500 to see how the “average” S&P 500 stock is doing.
Looking at the chart above, the average stock is doing well!
Like the chart of the S&P 500, the chart of the Equal Weight S&P 500 looks like it’s out of a textbook of what to look for when in a bullish environment.
After having peaked in January 2022, the Equal Weight S&P 500 (like most US equity indexes) bottomed in October 2022. It then traded sideways for a period before moving to a new all-time high this past March.
Once achieving a new all-time high in early April, the Equal Weight S&P 500 spent the next four months in a trading range testing the floor at the January 2022 high several times.
In early August, the Equal Weight S&P 500 moved above the range two times, but quickly fell back in.
In late August, the Index moved above the range again, this time, it retested its prior ceiling ($170) and bounced.
Although our upside objective for the Equal Weight S&P 500 is $192 (simple symmetry from the $162 January 2022 high to the $132 October 2022 low), we view the index as being in purgatory right now.
At its current level of $181, we could just as easily see the Equal Weight S&P 500 moving back down to $170 as moving up to $192 (+/- 6%).
In our view, the next move will be dependent on earnings, outlooks and estimate revisions.
(Past performance is not indicative of further results. This is not a recommendation to buy or sell any security and is not investment advice. Please do your own due diligence).
3. Valuation Looks Stretched

Source: Goldman Sachs. Through June 2024.
The chart above shows the current price to forward earnings multiples of various markets (orange diamonds) along with their respective 20-year interquartile ranges (blue rectangles); their median valuations (grey squares); and their 10-90th% valuation ranges (black lines).
This is a simple chart to show that at 22x next 12-months earnings, the US is currently trading above its 90% most expensive price to forward earnings valuation of the last 20 years.
Outside of big tech (second line from the left), US equities exhibit the same characteristic (it’s not just big tech that’s expensive).
Other major global markets are trading closer to their 20-year median valuations (as a reminder the MSCI AC World is around 62% US).
As we always say, valuation is not a catalyst, but a measure of risk (or safety).
In other words the high valuation will not be a reason for the US equities to correct, but when they do correct, valuation will not provide support and could allow for a further drop than if valuation were more moderate.
(Past performance is not indicative of future results. This is not a recommendation to buy or sell any security and is not investment advice. Please do your own due diligence).
4. Fiscal Dominance, the Bond Vigilantes and Relative Valuation

Source: Trading View. September 2024.
The chart above shows the 10-Year US Treasury Yield since 1980.
In our view, after the 39 year bull-market in US Treasuries (as yields moved lower) - from 1981 to 2020, the regime has changed.
Furthermore, with the move above the long-term downtrend line (angled line beginning in 1981 at the 16% peak in 10-Year US Treasury yields) in 2022, the potential for structurally (longer-term) higher yields has increased.
One of our themes this year has been Fiscal Dominance.
Fiscal Dominance is the idea that government debt outstanding and interest payments are so great that they impact central bank policy decisions. (We wrote about this here; in chart 5 here; in the introduction here; chart 2 here; and chart 2 here.)
The US has $35 trillion in debt outstanding (and growing) and interest payments of over $1 trillion annually.
The risk in a “Fiscal Dominance” regime is that “bond vigilantes” require greater return (higher yields) given the debt outstanding and easy central bank policy.
After the Fed cut rates last month, the 10-Year US Treasury yield moved from 3.6% to 4.1%.
While we see this near-term move as a possible reason (along with earnings, valuation and sentiment) for a small correction (3-5%) in the S&P 500 over the next month, over time higher US Treasury yields become “competition” for equities.
This is because investors consider the relative value of the “risk free returns” of Treasury Bonds vs. the relatively risky prospective returns of equities.
The best measure of prospective long-term returns in equities are valuations.
Historically, 10-year equity returns have negatively correlated with valuation metrics such as price to sales; price to EBITDA; and price to earnings.
The simple relative value analysis of equities and 10-Year Treasuries - what has become known as the Fed model - uses the inverse of the PE ratio (E/P) to compare the “earnings yield” of equities to Treasury yields.
Based on the next 12 months earnings of the S&P 500 (considering Q4 2024 - Q4 2025), the current forward PE of the index is 22x. The inverse of this (E/P) - the “earnings yield” - is 4.5%.
As we can see on the chart, the 10-Year US Treasury has a yield of around the 4.05%.
Investors are receiving 0.45% for taking equity risk. Although this is low relative to history is has been inverted in the past (equity earnings yields lower than Treasury yields).
Looking closely at the chart above, it is obvious that the 4.05% level has been a battleground for Treasury yields in the past. A move above this level would open a path back toward 4.5-5.0%.
While a move to 4.5-5.0% Treasury yields does not seem imminent (inflationary and / or deficit concerns could be a catalyst), a move towards these levels would put pressure on equities.
If this were to occur (we would expect it in Q1 / Q2 2025), we believe that the Treasury might implement QE once again to lower long-term yields, crush the bond vigilantes and send equities higher back higher.
(Past performance is not indicative of future results. This is not a recommendation to buy or sell any security and is not investment advice. Please do your own due diligence).
5. A “Bizarro” Presidential Election Year

Source: All Star Charts. Through year-to-date 2024.
The chart above shows the average path of the S&P 500 over the last 5- (grey line), 10- (black) and 20- (blue) US Presidential election years and the path of the S&P 500 this year.
Since the beginning of the year, we have included “seasonality” as an input to our view.
However, looking at the chart above, 2024 has exhibited “bizarro” (a reference to the mirror image world in Superman comics and a Seinfeld episode) seasonality - where everything is the opposite of typical:
In late February through March, the S&P 500 has typically sold off in US Presidential election years. This year, the S&P 500 rallied through late March and peaked around the time when in other election years, it has bottomed.
This year, the atypical late March sell-off bottomed around April 19. In the last 5 and 10 years, late April has marked a short-term peak for the S&P 500.
The pre-election peak in past US Presidential election years has, on average, occurred in early August. This year, that time period marked a bottom from which the S&P 500 has gone on to make new highs.
Typically, during the current period - the lead up to the election - the S&P 500 exhibits caution and there is a post election rally. This year, the lead up to the election has exhibited no caution, we will see if there remains strength and buying power for a post election rally.
In other words, the timing of average peaks and troughs in US Presidential election years have been nearly the mirror image (“bizarro”) of typical this year.
The take-away from this is that either we can throw out seasonality this year and ignore it or we can continue to look for the opposite of what we would normally expect to continue to occur.
(Past performance is not indicative of future results. This is not a recommendation to buy or sell any security, please do your own research).