

Blame it on the Rain!
The S&P 500 and Nasdaq 100 are now up eight days in a row. In our view, the Treasury and its leader, the Wizard Yellen, have been behind the curtain pulling some strings. Let's dig in...
For those that don’t recognize today’s song-title headline, it is the 1989 “hit” from Milli Vanilli.
Shortly after the release of “Blame it on the Rain” and at the peak of their short career, Milli Vanilli was caught lip-syncing and subsequently ostracized from the music world for basically not saying (or singing) what people believed they were saying (or singing).
For the last year, the Fed has left its Fed funds rate at an elevated level and its stance has been characterized as “higher for longer.”
While this has been true, in our view, the Treasury has been behind the scenes applying liquidity to combat every economic and market downdraft.
This “stealth liquidity” has been a theme of ours since the beginning of the year (see here, here, here, here, chart 4 here and here) and it continued in early August (see chart 2).
In our view, the Treasury liquidity has helped provide fire power to the equity market rebound from the August 5th low that climbed straight through our potential “pause” levels and back to the July peak.
The Treasury has continued to make it rain!

1. Back to the 2024 High in the S&P 500
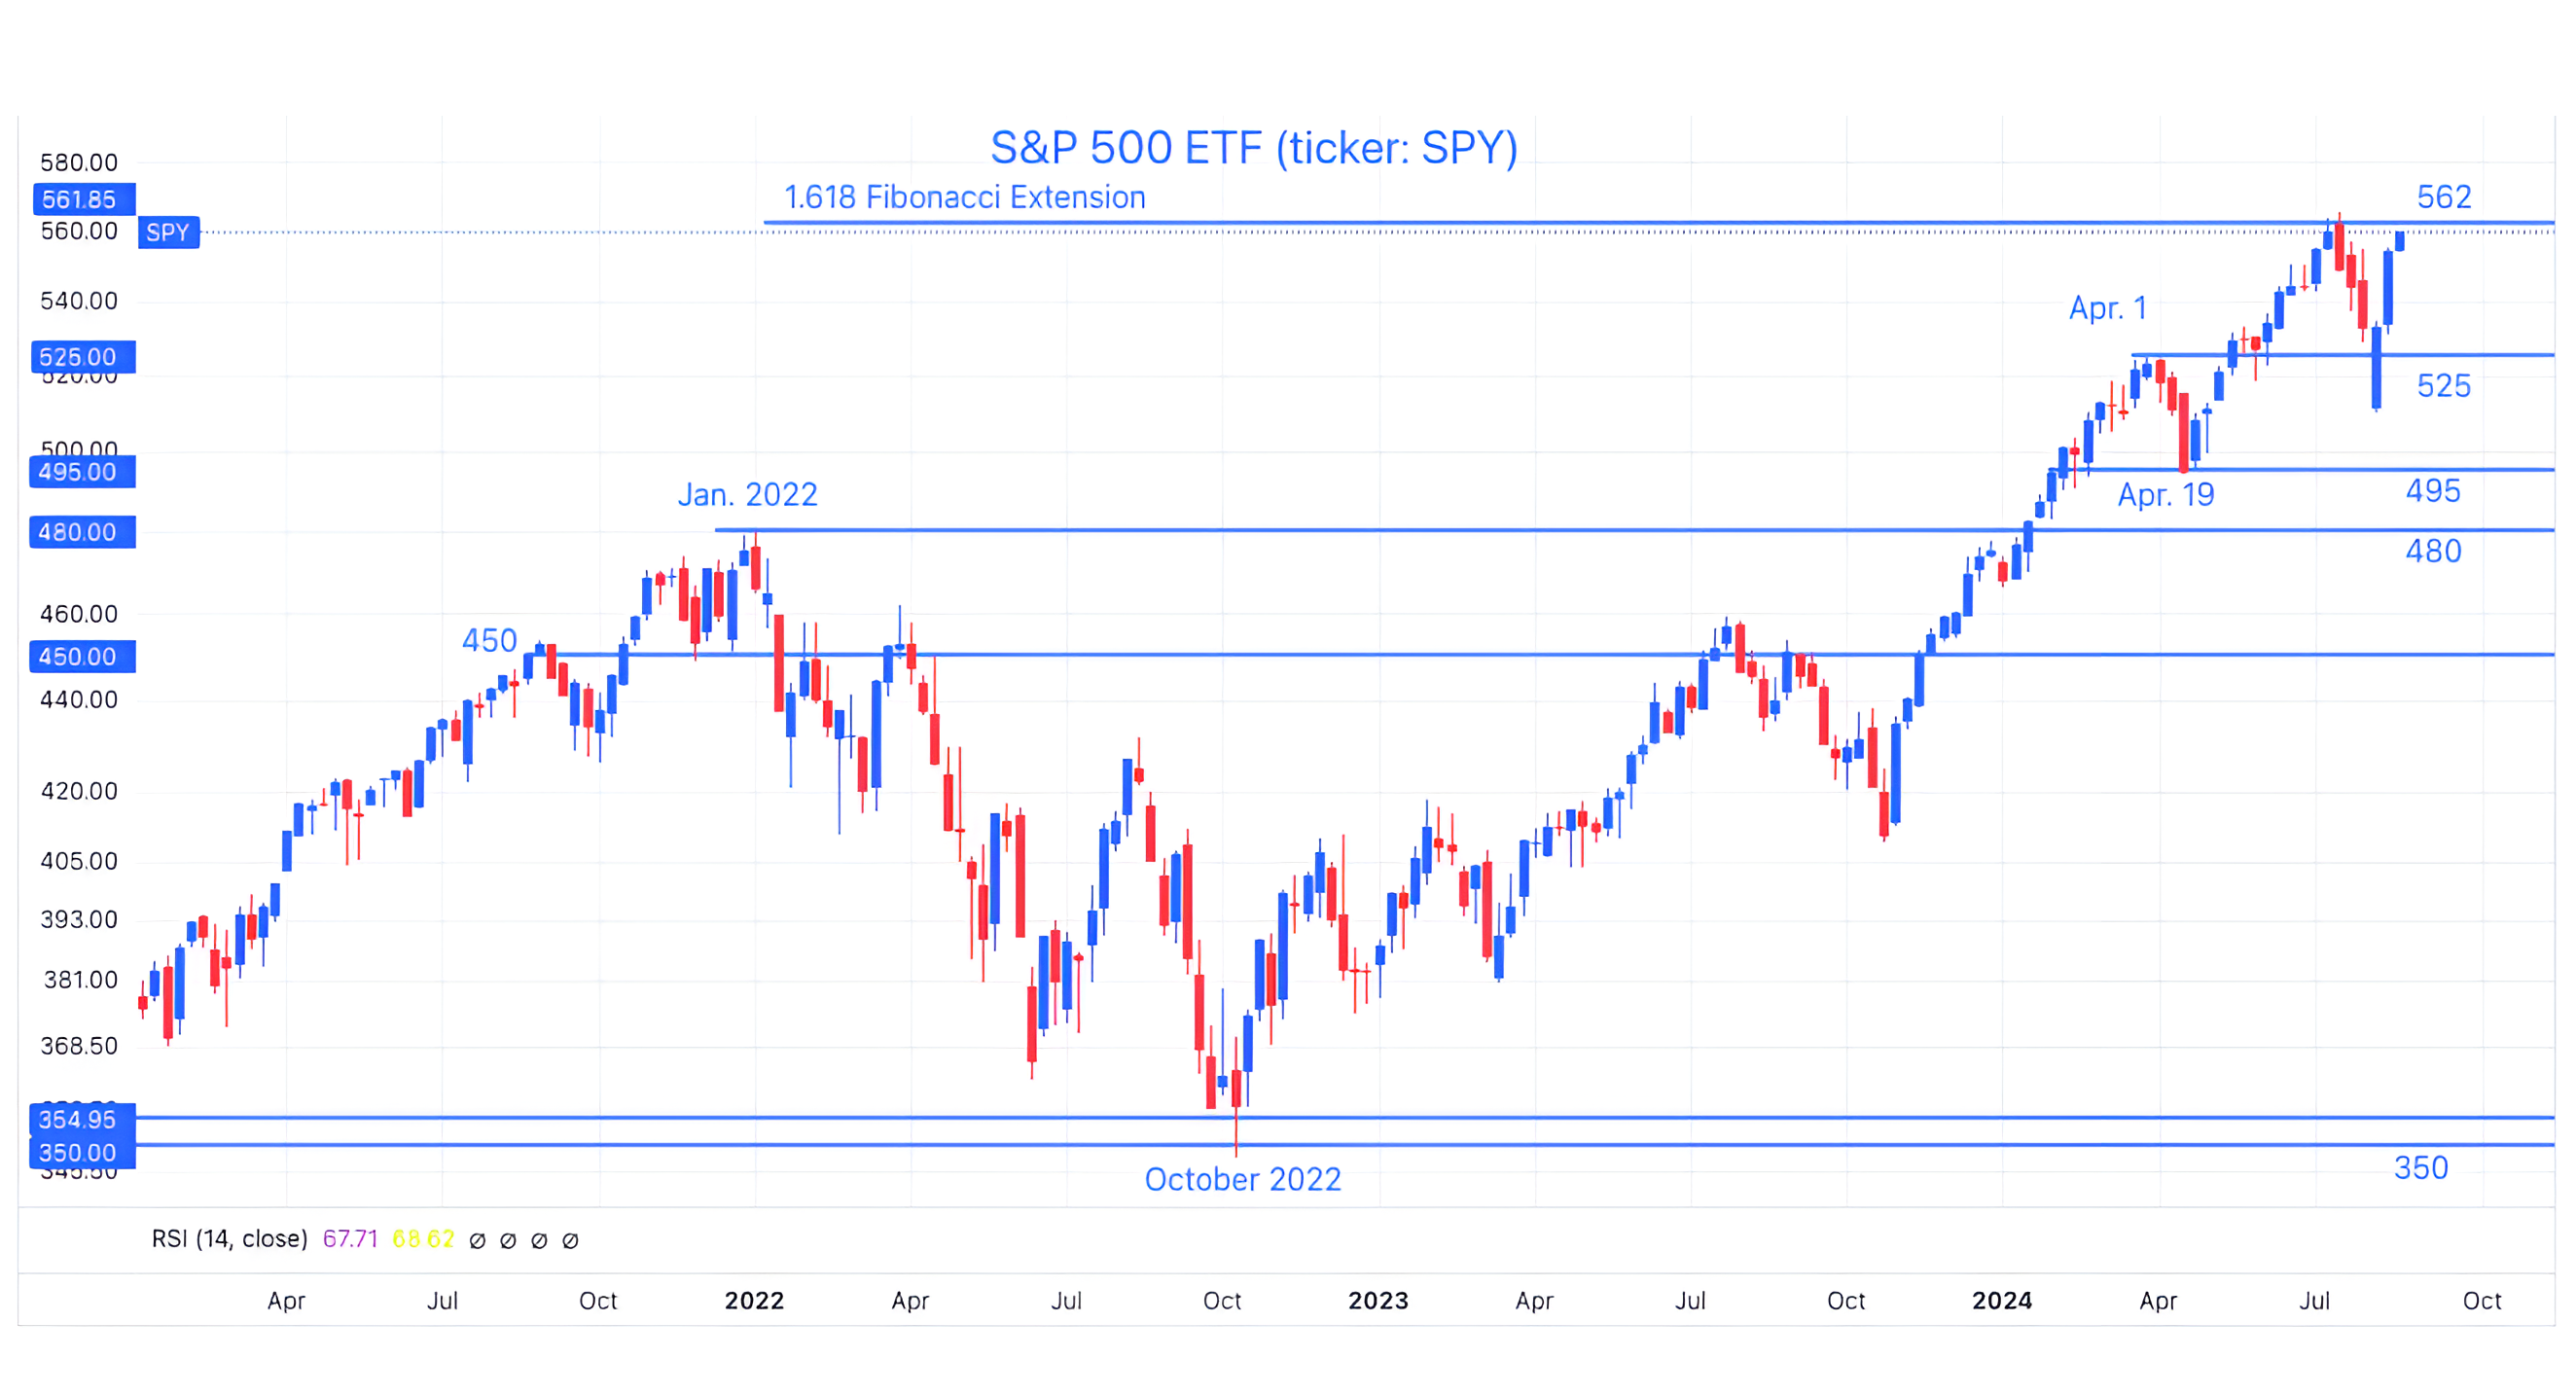
Source: Trading View. Through year-to-date 2024.
Over the past three weeks, we have consistently been showing the charts of the S&P 500 ETF (ticker: SPY) above (here, here and here) and of the Nasdaq 100 ETF (ticker: QQQ) (here, here, here and here).
These two indexes are the most important in our work and given the early August sell-off and bounce, it has been critical to update the charts in order to consider what’s next and to articulate our overall market view.
The S&P 500 ETF, after eight straight up days, is now nearly back to its 2024 high which coincides with the 1.618 Fibonacci extension of its January 2022 to October 2022 sell-off.
Where do we go from here?
We are the first to admit that the recovery from the sell-off has surprised us.
While we believe that once again the explanation is “stealth liquidity” (as shown in chart 2) - that is in the past, and we need to look forward.
We believe that the Fed’s statement at Jackson Hole this Friday will likely be dovish.
However, given the rally of the past two weeks, it may be that the Fed’s dovish statement, liquidity and the likely September cut have already been priced in.
Given the pace of the market’s ascent and the fact that it is once again at an important level where it has previously sold off, in our view, it is likely that at the very least, equities will pause (stop going up).
We believe it is likely that the S&P 500 ETF will trade back down to the 540 neighborhood from the 562 area where it’s currently trading.
In other words, we expect a 3% sell-off over the next few weeks with the caveat that short-term calls in this market have been challenging.
Beyond the next few weeks, there is the possibility of a liquidity drain in the second half of September (discussed in chart 2) that could lead to further volatility and I believe the tone of the US Presidential election along with more detailed prospective policies might begin to influence equities.
From a fundamental perspective (how quaint), we continue to see next year's earnings expectations as too high with a demanding valuation. We’ve been highlighting this all year and it has not been a market driver.
Can the Fed’s liquidity bridge the gap between earnings and valuation - potentially, but we don’t believe that will be a completely smooth ride.
As we’ve said for some time, we still see a 10-15% chance of a 30% sell-off from the 2024 peak into the 2025 trough.
(This is not a recommendation to buy or sell any security and is not investment advice. Please do your own research and due diligence).
2. The Treasury’s Liquidity Tools…
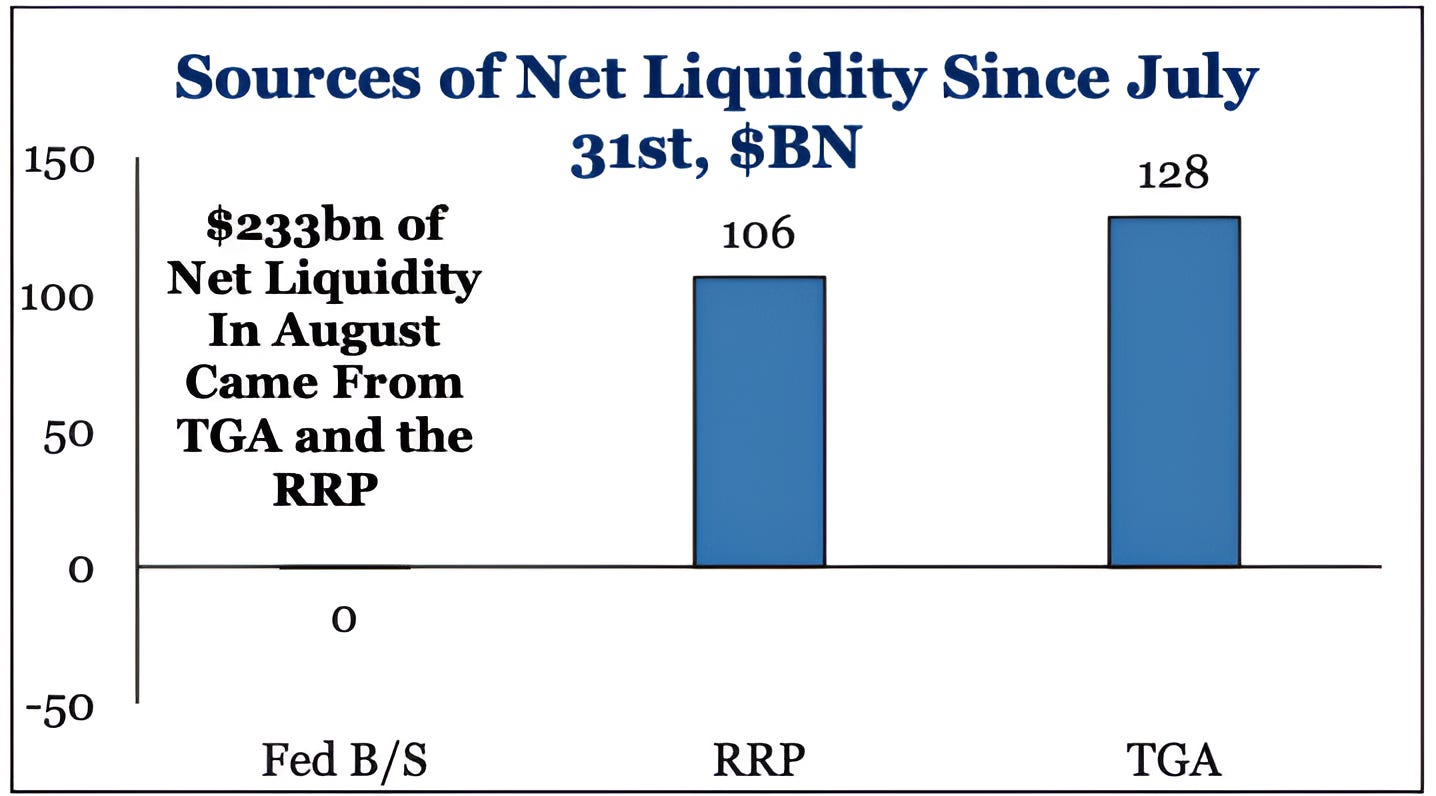
Source: Strategas. Through year-to-date 2024.
Over the past 18 months, the Fed and Treasury have been using several non-traditional tools behind the scenes to apply liquidity to the economy and markets to smooth volatility.
We have continued to call this “stealth liquidity” and it has been a major theme of ours as an equity market driver.
The three tools on the chart above are:
The expansion and / or shrinking of the Fed’s balance sheet (B/S).
This is the mechanism used in “Quantitative Easing” (expanding the balance sheet) and “Quantitative Tightening” (shrinking the balance sheet).
Up until earlier this year, the Fed was shrinking its balance sheet (“Quantitative Tightening”).
Simply ending Quantitative Tightening was a de-facto easing measure in our view. The Fed did not expand its balance sheet in August to apply liquidity to the economy / markets.
The Reverse Repo (“RRP”) account. The RRP initially grew during the post-Covid QE period from 2020-2021.
At the time, the Fed printed so much money that the excess needed a place to go. That place was the Reverse Repo account.
As the account is drawn down, this money is used (instead of bank reserves) to buy Treasury bonds.
The Reverse Repo account was drawn down quickly in early August to apply liquidity to the markets.
The Treasury General Account (the “TGA”). This is essentially the Treasury’s savings account.
In late March 2023, when the US hit its “debt ceiling”, the Treasury used its General Account to provide liquidity.
By May 2023, when an agreement was reached on the debt ceiling (the new debt ceiling is no debt ceiling), the TGA had essentially been drained and needed to be refilled. The new debt issuance (under the no debt ceiling agreement) was used to refill this account.
Since that time, the Treasury has used the TGA to apply liquidity to the economy. It did so once again in early August.
According to Dan Clifton at Strategas (the best Washington analyst at the best independent research firm in my view):
“The liquidity effect is most notable when liquidity ramps up or drains over $150bn per month.
August has been a liquidity bazooka, with $233bn of net liquidity provided in the first half of the month.
Next stop is the mid-September liquidity DRAIN that should last from September 14-October 1st .”
We believe the Treasury’s “stealth liquidity” once again provided a boost to markets and probably led to a rebound from the August 5th low that was beyond our expectations. (This is the “Rain” from today’s title).
We will see if the expected liquidity drain in the second half of September will coincide with equity market volatility.
(Past performance is not indicative of further results. This is not a recommendation to buy or sell any security and is not investment advice. Please do your own due diligence).
3. Homebuilders…
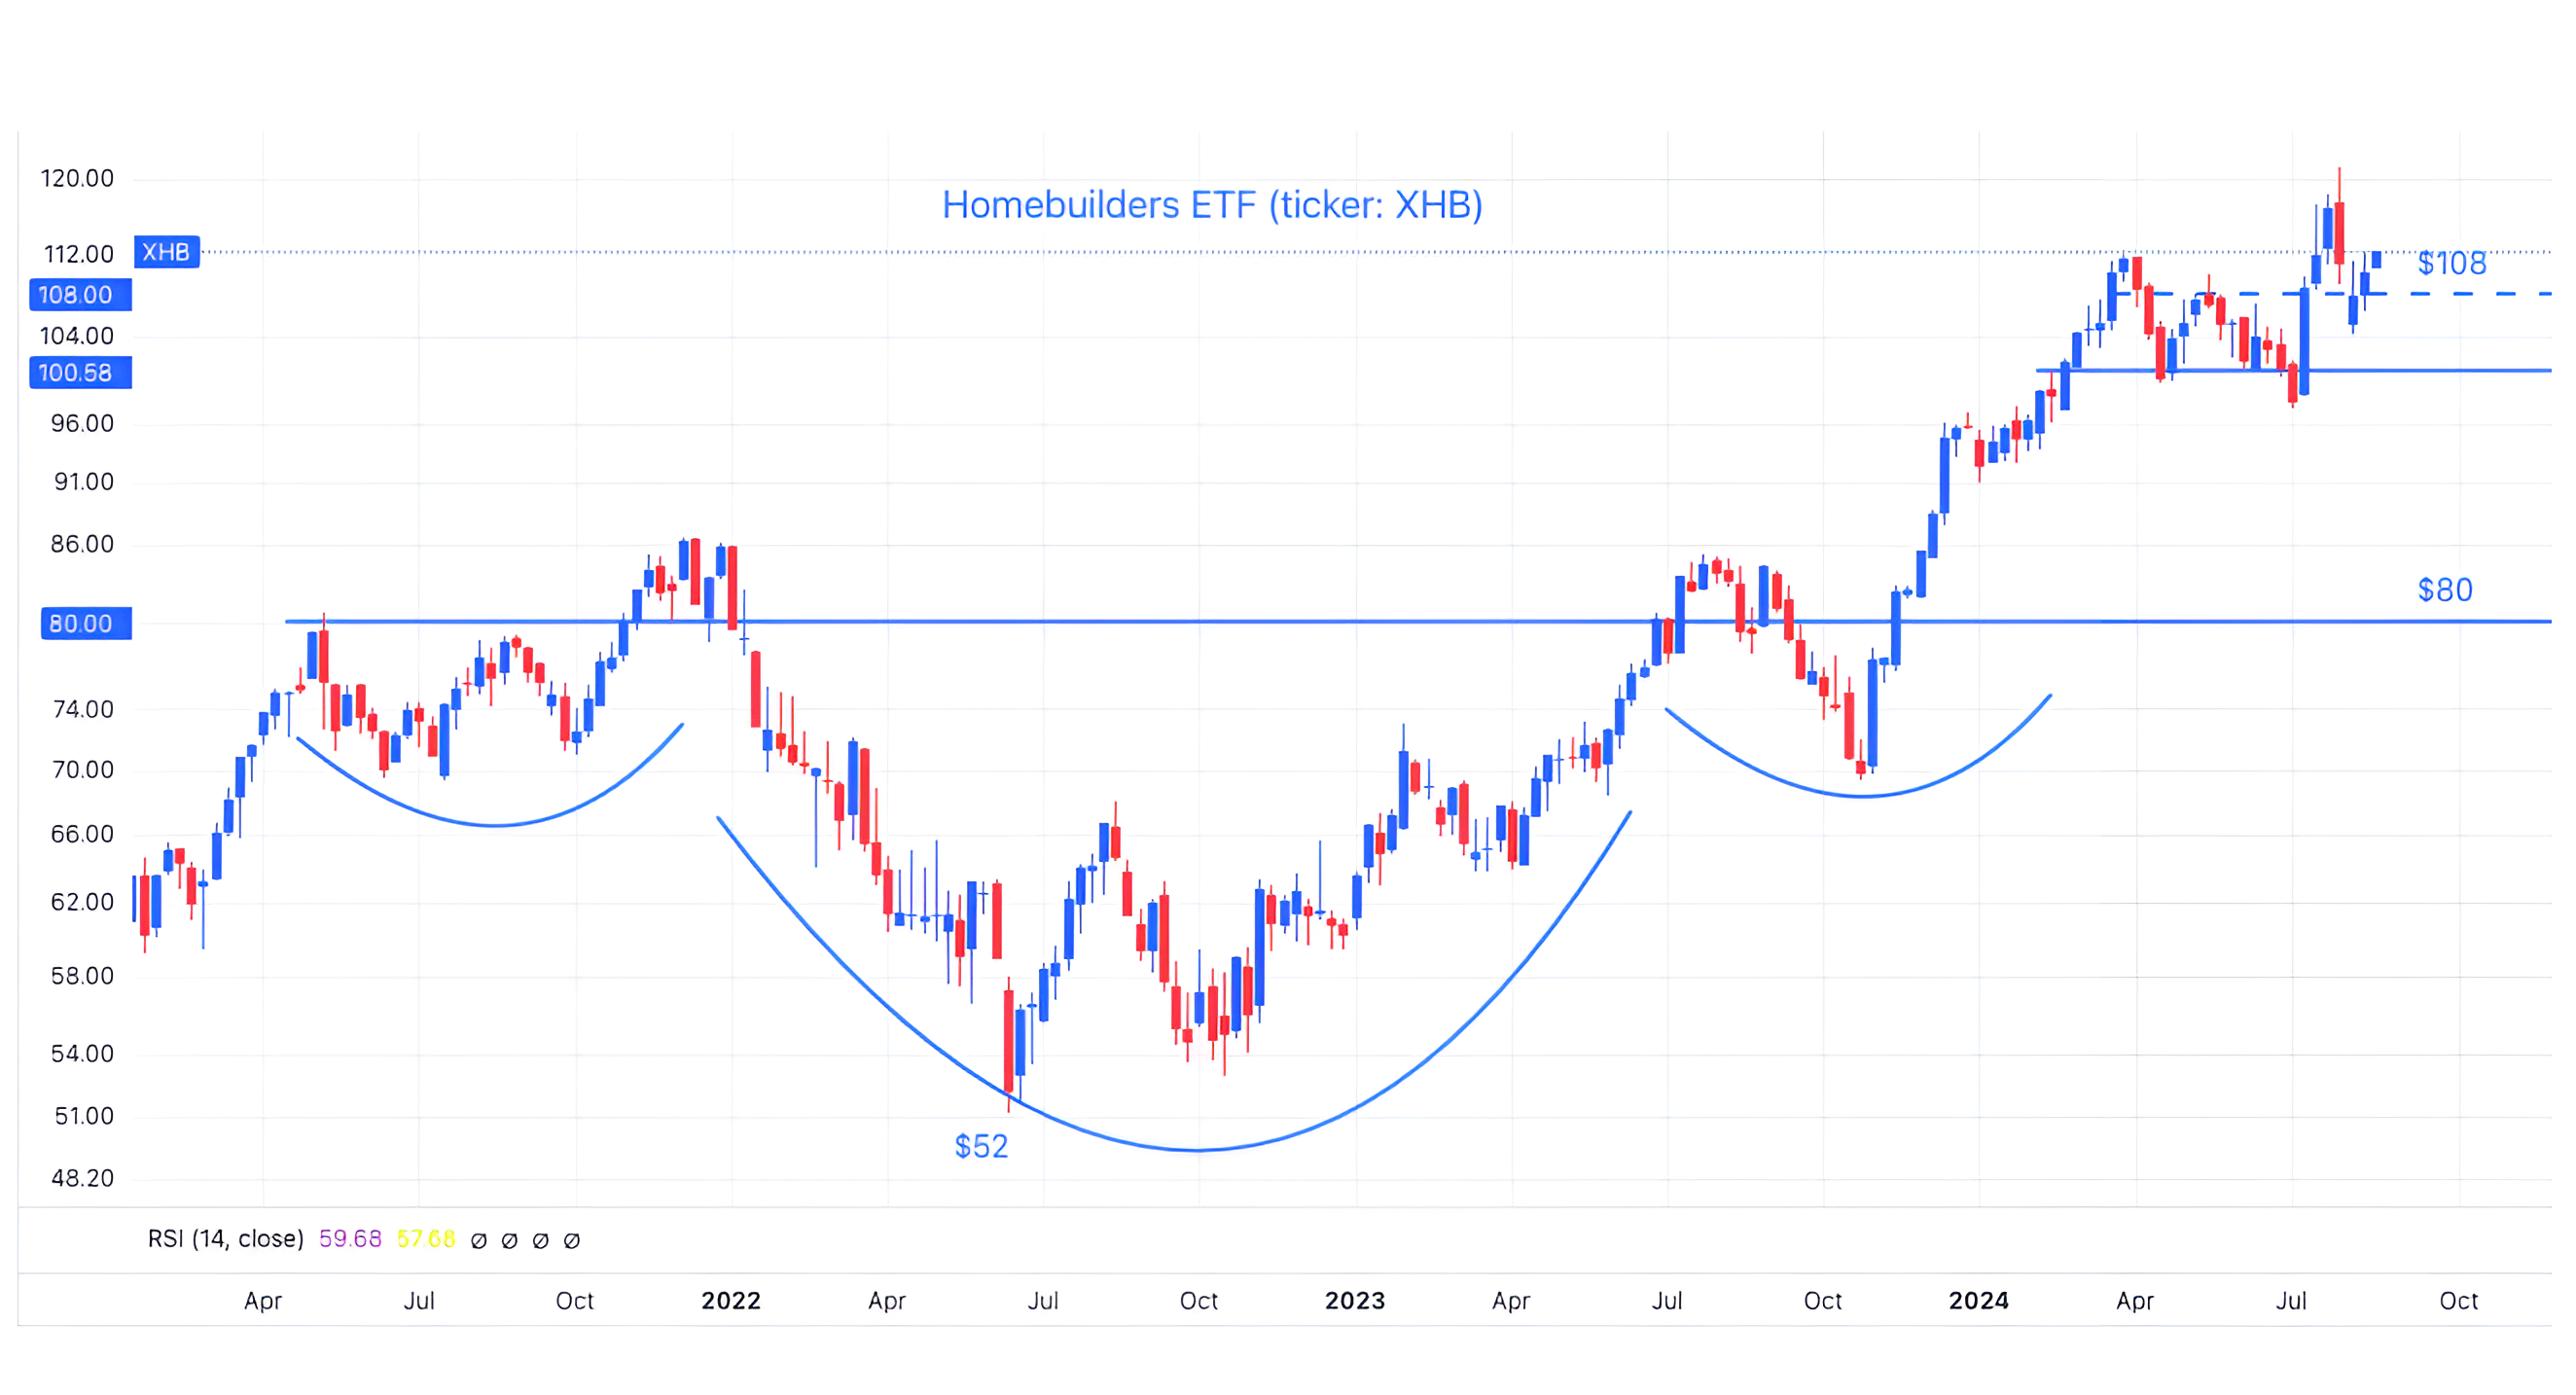
Source: TradingView. Through year-to-date 2024.
The chart above shows the Homebuilders ETF (ticker: XHB). This includes companies like Toll Brothers; KB Homes; Lennar Homes and DR Horton.
A couple of points on this:
Let’s start with the fundamentals. It may be counterintuitive that Homebuilder stocks are moving higher given elevated mortgage rates.
Homebuilders have been able to provide financing to prospective buyers often at rates well below the prevailing mortgage rate. This has made buying a new house from a homebuilder less expensive (in some ways) than an equivalent existing home.
In addition, many homebuilders have bought substantial tracks of land to develop. With inflation and scarcity, large attractive parcels of land have increased in value.
From a technical perspective, I’ve drawn in a bullish “head and shoulders” on the chart.
The measured target based on this pattern is $108 (the neckline $80 plus the difference between the neckline $80 and the low of the head $52). This is essentially where the Homebuilders ETF is currently trading.
Although we are late on this one (we should have presented it when the “head and shoulders” was being triggered) - we wanted to show a “head and shoulders” achieving its measured target.
We wouldn’t be surprised to see the current sideways movement in the Homebuilders ETF resolve higher.
(Past performance is not indicative of future results. This is not a recommendation to buy or sell any security and is not investment advice. Please do your own due diligence).
4. Non-Farm Payrolls Revision…
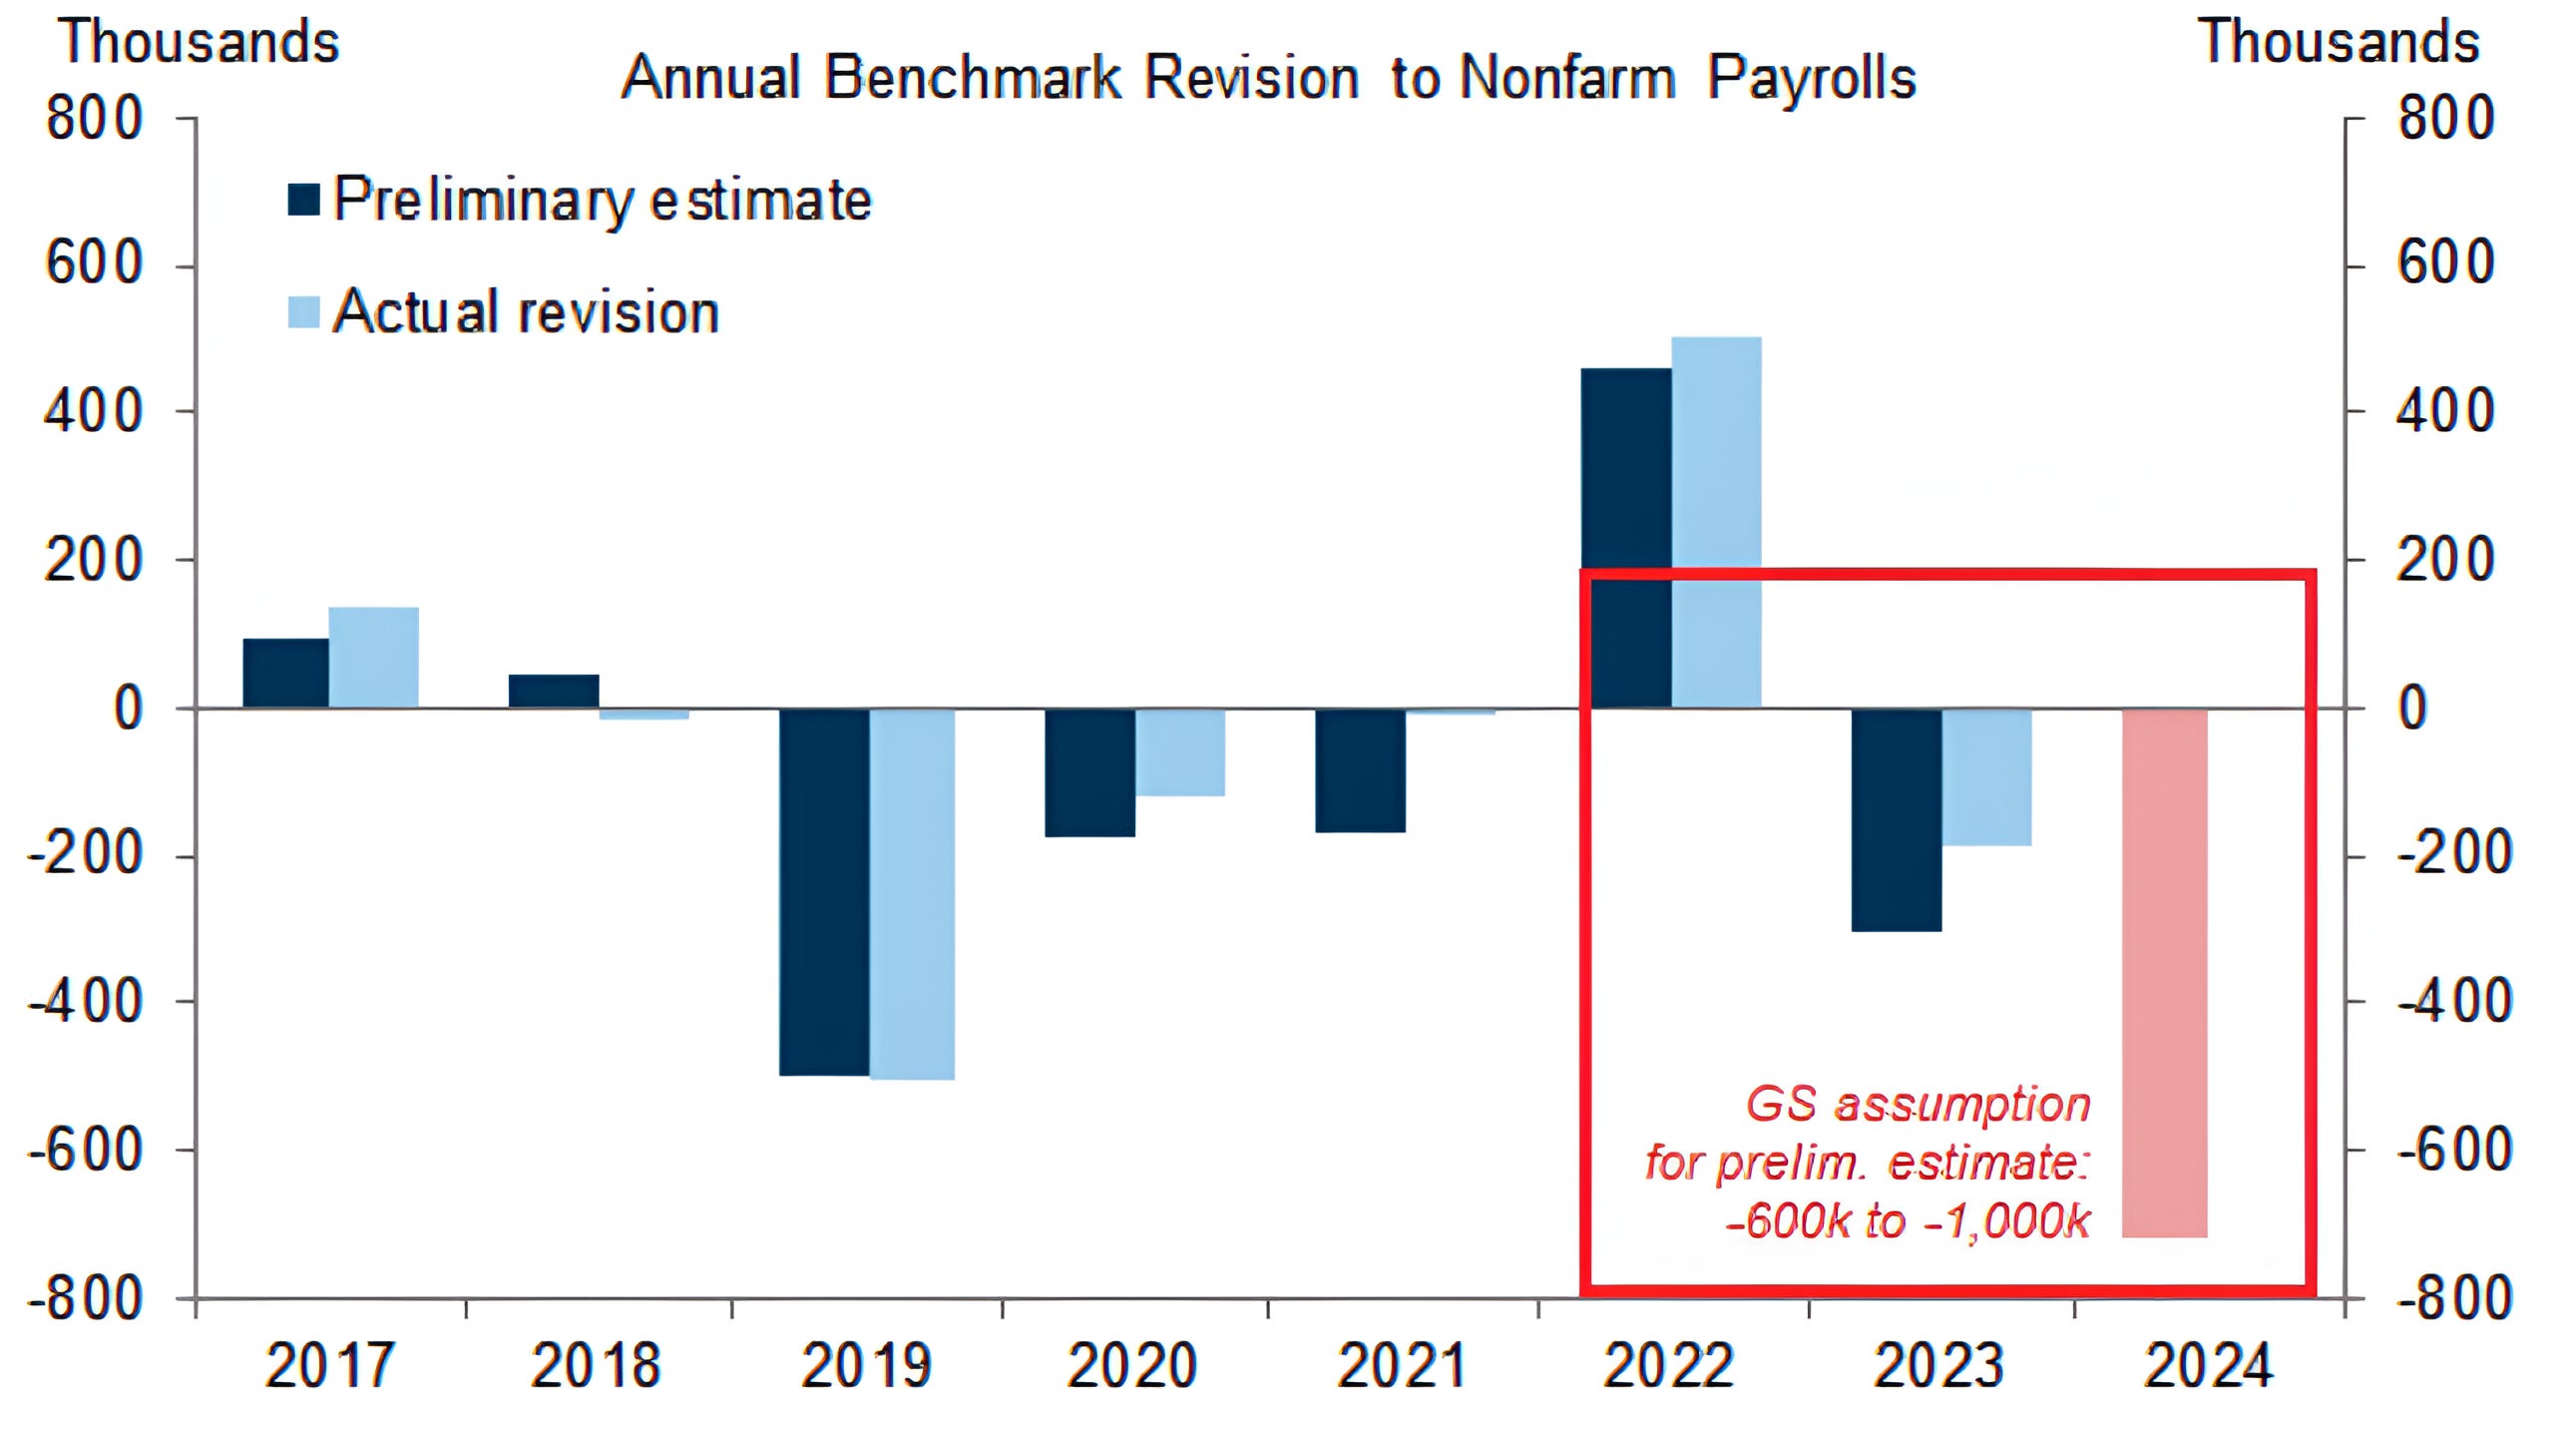
Source: Goldman Sachs. Through year-to-date 2024.
Tomorrow, the Bureau of Labor Statistics will release the 2024 Preliminary Benchmark Revision, which includes revisions to non-farm payroll numbers between April 2023 and March 2024. (The final revision will be in March 2025.)
US non-farm payrolls are released on the first Friday of the month following the data.
The non-farm payrolls figures are then revised twice in the two months after the release of the initial number.
In other words, the May non-farm payrolls report that is released in early June, is revised with the release of the June report in early July and, once again with the July report in early August.
There is then a preliminary “benchmark revision” and a final benchmark revision of non-farm payroll numbers.
With respect to tomorrow’s Preliminary Benchmark Revision, Goldman Sachs has estimated that the non-farm payrolls numbers from April 2023 and March 2024 will be reduced by 600,000 to 1 million jobs. (Chart above).
While there are questions about whether the non-farm payrolls data based on the establishment survey has been able to capture immigrant employment, this is not what this post is about.
The average non-farm payroll gain from April 2023 and March 2024 was about 235,000.
Imagine if every payroll report from April 2023 and March 2024 was 50,000 to 80,000 lower.
What would that have done to equity and fixed income markets, recessionary views, Fed policy, the US dollar and Presidential approval?
I am not saying that the Bureau of Labor Statistics which employs over 2,500 people is a bad as Milli Vanilli that lip-synced “Blame it on the Rain” and other songs; but, if Goldman’s estimate is correct, I am saying that some of those 2,500 people at the Bureau of Labor Statistics should end up on an upcoming initial jobless claims report.
(Past performance is not indicative of future results. This is not a recommendation to buy or sell any security and is not investment advice. Please do your own due diligence).
5. Eight Day Win Streaks in the S&P 500
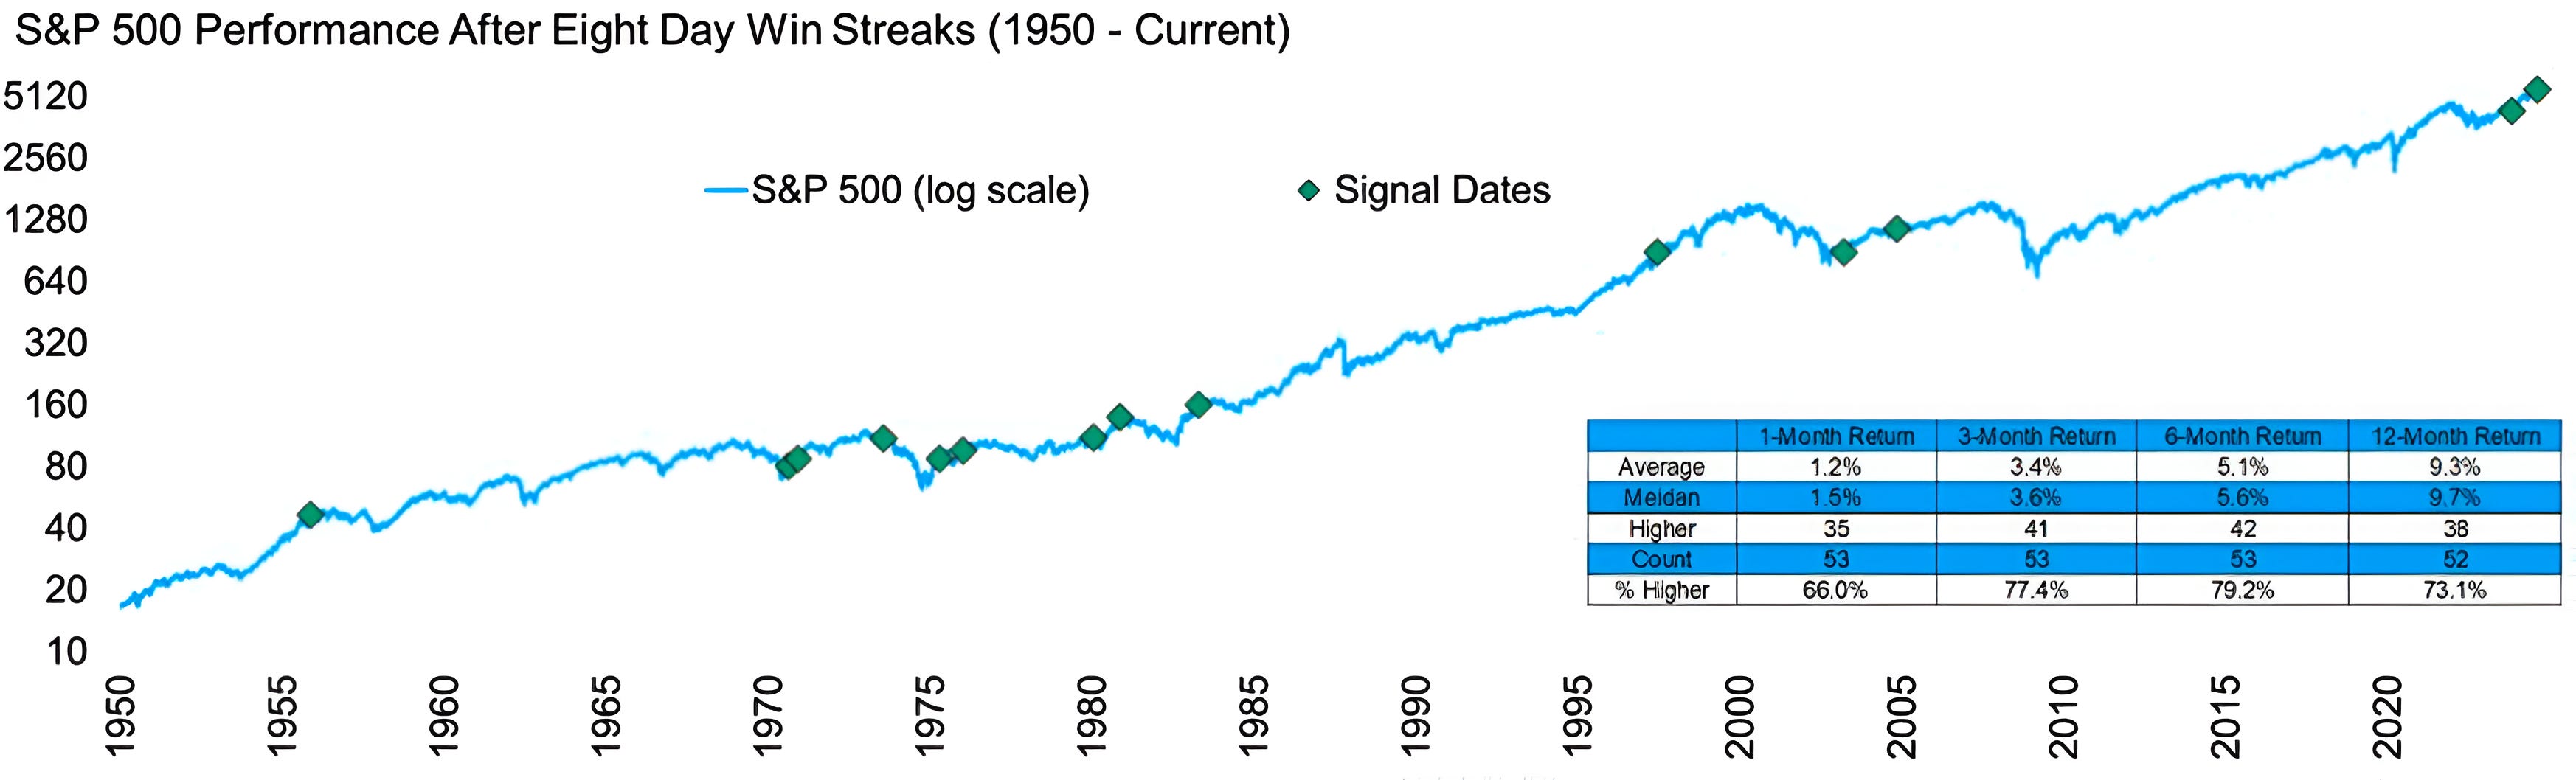
Source: Carson Investment Research / Ryan Detrick. Through year-to-date 2024.
As of yesterday, the S&P 500 had been up eight days in a row.
This was the 54th eight-day win streak in the index since 1950.
There have been 13 nine-day win streaks; five 10-day win streaks; three 11-day win streaks; four 12-day win streaks; and one 14-day win streak (1971).
These are all non-overlapping - in other words the five 10-day win streaks listed above are not included in the three 11-day win streaks which occurred at different times.
While the one-month; 3-month; 6-month and 1-year returns after an eight-day win streak are not dramatically different than average S&P 500 returns over those periods, the past four years that had an eight-day win streak during the year did this:
2013 - 29.6%
2017 - 19.4%
2019 - 28.9%
2021 - 26.9%
Year-to-date, the S&P 500 is up 16.4%.
(Past performance is not indicative of future results. This is not a recommendation to buy or sell any security, please do your own research).