


Bad Boys, Whatcha Gonna Do?
The violent bounces in the market seem indicative of an investor base that's undecided on future market direction. We are watching a number of indicators for clues. Let's dig in...
1. Two Scenarios in the Nasdaq 100 ETF

Source: Trading View. Through year-to-date 2024.
Over the past two weeks (here and here), we have showed the chart above of the Nasdaq 100 ETF (ticker: QQQ).
We now see two possible scenarios for the Nasdaq 100 ETF:
We see the possibility of a bearish “head and shoulders” developing. (The three arcs on the right side).
[As a reminder a bearish “head and shoulders” often occurs after a long bullish trend. At that point, the price rises to a peak and subsequently declines to form a arc. The price rises again to form a second high substantially above the initial peak and declines again. The price rises a third time, but only to the first peak level, before declining again. The “neckline,” drawn at the base of the three arcs (in the chart above the top light blue dashed line).]
If the “head and shoulders” is confirmed by a fall through the “neckline,” the downside target is symmetric to the distance from the “neckline” to the top of the head.
In the case of the Nasdaq 100 ETF, we see the top of the “head” at around $500 and the neckline at $420. Therefore, if the pattern were to come to fruition, the downside target would be $360 (the lower light blue dashed line).
It is possible that there will be a “re-test” and rally.
This would mean that Nasdaq 100 ETF would re-visit Monday’s low (around $420) and then rally back towards the $496 level.
What would this look like?
Unfortunately, initially, it would look a lot like the bearish “head and shoulders” pattern is developing.
The Nasdaq 100 ETF would trade back down towards the April 19th low (light blue dashed line) around $420 - it may slightly undercut the April 19th low - and then it would reverse.
There will be internal indicators that we will look for in this scenario to help guide us.
The key here is that in either scenario, we see the Nasdaq 100 ETF revisiting Monday’s low.
In our view, the odds favor the second scenario - we would call it 60-70% chance “retest and rally” and 30-40% bearish “head and shoulders.”
This may all develop over time.
Notice that the left “shoulder” (first arc) required three months to develop.
Could the Nasdaq 100 ETF trade somewhat sideways (chop around) for the next two to three months in a range of $435-455 before re-visiting $420?
Absolutely.
We will watch for this…
We still believe that there is a 20% possibility of a more extreme (~30%) sell-off that will begin in the next 6-12 months but for now, we see the current volatility as a somewhat normal correction.
(This is not a recommendation to buy or sell any security and is not investment advice. Please do your own research and due diligence).
2. The Equal Weight S&P 500 is in Purgatory
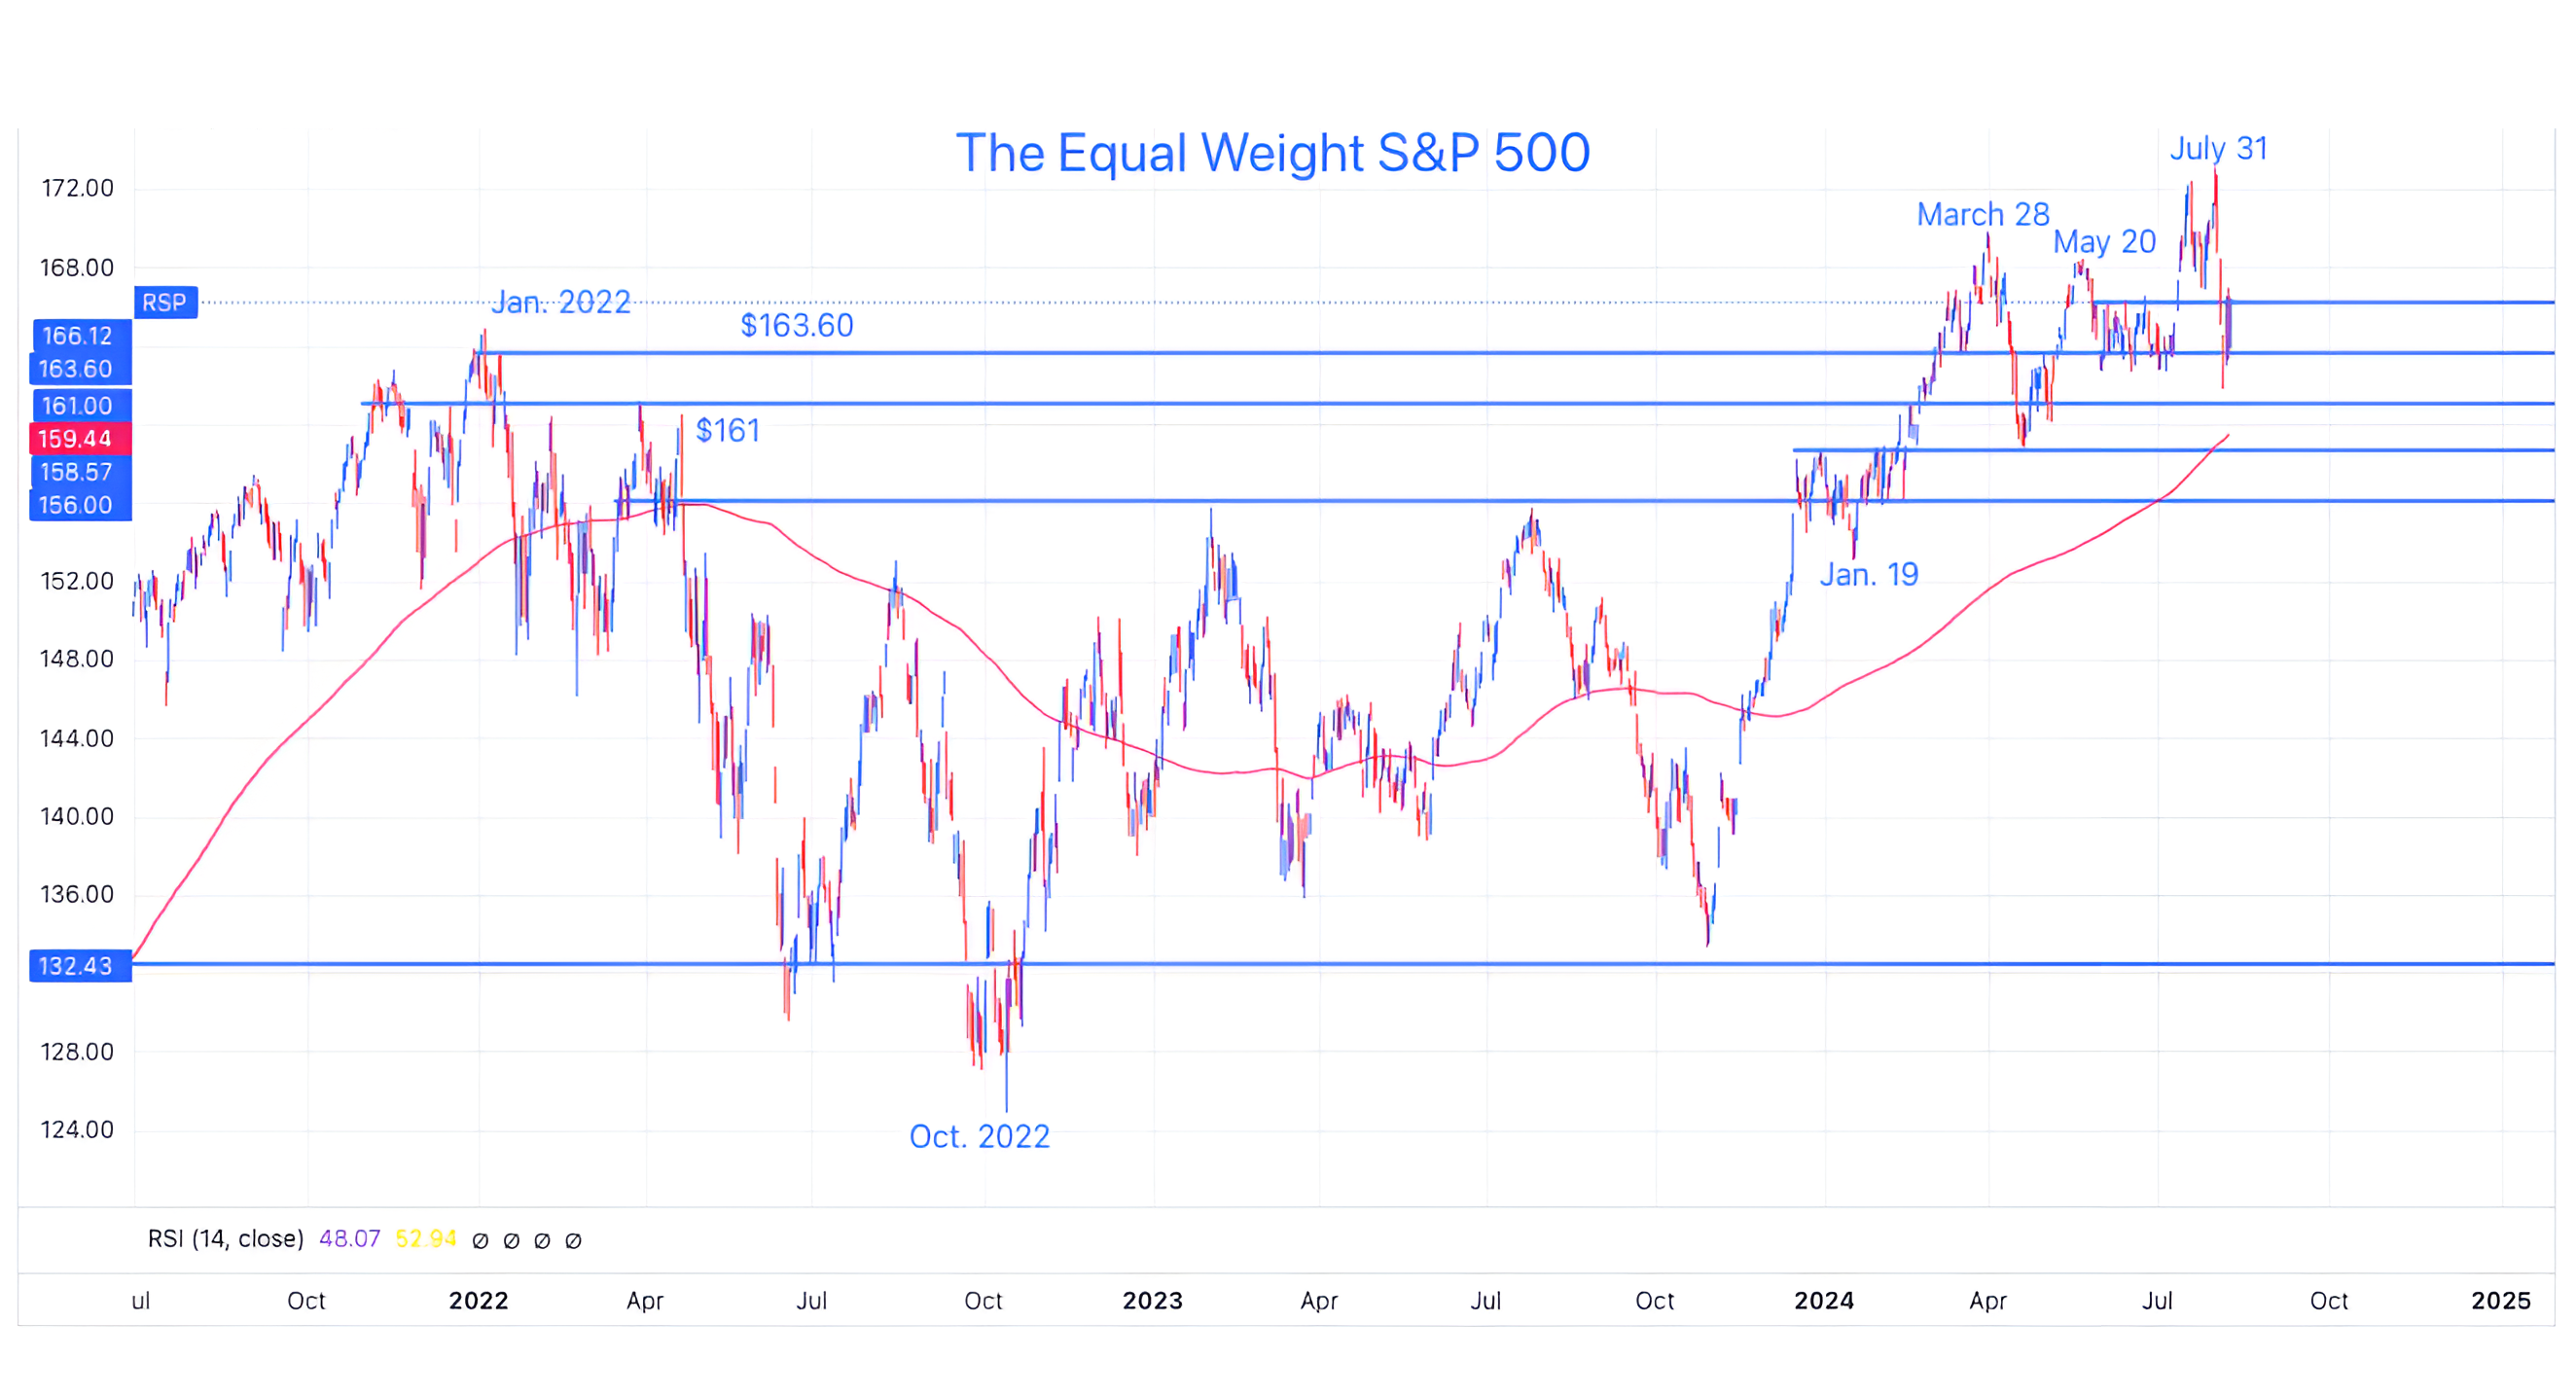
Source: Trading View. Through year-to-date 2024.
The chart above shows the Equal Weight S&P 500 ETF (ticker: RSP).
Even with today’s rally, the Equal Weight S&P 500 is trapped below its June ceiling / July floor (top horizontal light blue line)
On Tuesday, we showed the Equal Weight Nasdaq 100 (here) and observed that it was below its its November 2021 peak and its 200-day moving average.
Unlike the Equal Weight Nasdaq 100, the Equal Weight S&P 500 hit its January 2022 high (the rough equivalent of the Nasdaq’s November 2021 high) and bounced and it remains firmly above its 200-day moving average.
That said, since its March peak, there seems to be no discernable conviction or pattern in the Equal Weight S&P 500.
It’s as if investors are waiting on additional information - earnings, economic data and the Fed to take the “average stock” in one direction or the other.
While we have no edge in observing this chart, being patient and waiting for conviction to develop is our edge.
(Past performance is not indicative of further results. This is not a recommendation to buy or sell any security and is not investment advice. Please do your own due diligence).
3. The Consumer

Source: Haver Analytics, Institute of Supply Management. Through year-to-date 2024.
The chart above shows the Equal Weight Consumer Discretionary Sector ETF (ticker: RSPD).
I like to look at markets to see what investors are saying about the economy as well as looking at the economy and see how it’s being reflected in markets.
The consumer is 2/3 of the US economy.
In our view, the Equal Weight Consumer Discretionary ETF provides insight into investors perceptions of the health of the US consumer.
Unlike the (typical) Consumer Discretionary Sector ETF, which is market cap weighted and is disproportionately allocated to Amazon, Tesla and Home Depot (~40% combined), the Equal Weight Consumer Discretionary ETF weights all 52 consumer discretionary constituents equally (~1.92% each).
As can be seen, the Equal Weight Consumer Discretionary ETF has fallen below its former floor (horizontal light blue line) and is treading water below its 200-day moving average.
In late 2023, the ETF experienced the same conditions and was able to overcome them easily.
We will see if it can do it again.
(Past performance is not indicative of future results. This is not a recommendation to buy or sell any security and is not investment advice. Please do your own due diligence).
4. Volatility Spike = Bullish

Source: Strategas. Through year-to-date 2024.
The chart above shows the level of the Volatility Index (“VIX”) vs. the 6-month forward S&P 500 returns.
On Monday, the VIX spiked to 60 which put it in the 10th decile of all VIX readings.
Historically, 6-month forward S&P 500 returns have averaged 11.9% when the VIX has entered its 10th decile. It is the best forward performance for any VIX decile.
We continue to write about the difference between what we see as questionable fundamentals and technicals (money flows, patterns, historical symmetry, etc.) that paint a more bullish picture.
Despite our concerns with the fundamentals, we continue to maintain an open mind with respect to overall market direction.
(Past performance is not indicative of future results. This is not a recommendation to buy or sell any security and is not investment advice. Please do your own due diligence).
5. Which Path is the S&P 500 On?

Source: Goldman Sachs. Through year-to-date 2024.
The chart above shows the average performance of the S&P 500 around bear markets and corrections.
The current sell-off has been sharper than the average of “correction” sell-offs, however, as we are observing averages, the path of the current sell-off is far from conclusive.
I like this chart as a book-end to chart 1 (two scenarios in the Nasdaq 100 ETF) and for further consideration.
(Past performance is not indicative of future results. This is not a recommendation to buy or sell any security, please do your own research).