


You Might Think I'm Crazy
The rally from the August 5th low has continued unabated and has led us to re-examine our near term views. Let's dig in...
I was recently with a friend / reader who remarked that he appreciated that I take a view on markets in a relatively detailed and specific way.
The challenge with doing so is that every so often, I am wrong. (If you don’t believe me, just ask my wife).
With yesterday’s rally, my near-term view of a “re-test” of the August 5th lows (or at least the way I articulated it) was likely invalidated.
That said my view that recessionary fears would dissipate and that the early August sell-off was a normal correction and not the beginning of something significantly more seems to have been correct.
What we are left with is possibly a much more bullish near-term (I would posit through year-end) scenario than I envisioned. (See Chart 1).
I will continue to complain say that the fundamentals - earnings, earnings growth, expectations and the macro environment - in my view don’t warrant a further rally given the current top decile valuation level.
That said, I am not here to be academically right, nor am I here to be overly dogmatic in my view.
We are here to make money and as I’ve tried to show with continuously bullish historical analogs (Chart 5 nearly every day) - the market doesn’t care about what I think is warranted.
This is why we have been mindful to remain invested but hedged.
Given the gains on the hedges that we were able to achieve during the early August sell-off, they have been only a slight drag on our performance year-to-date.
My view continues to be that there is more (stealth) liquidity being provided by the Treasury than is easily recognized. Along with fiscal spending, this has more than off-set the tight stance of the Fed.
While Treasury stealth stimulus has been going on since around the time of the regional banking crisis in Q1 2023, as the Treasury runs out of fire power, the Fed will be ready to take the baton (September) to elongate the glide path for the market and economy. (See Chart 3).
We continue to keep an open mind in terms of outcomes and used the recent sell-off to upgrade the quality of our portfolio. We have once again added hedges to our portfolio, but remain invested.
This quote from Peter Lynch, the legendary former manager of the Fidelity Magellan fund resonates, “Far more money has been lost by investors preparing for corrections or trying to anticipate corrections than has been lost in corrections themselves.”
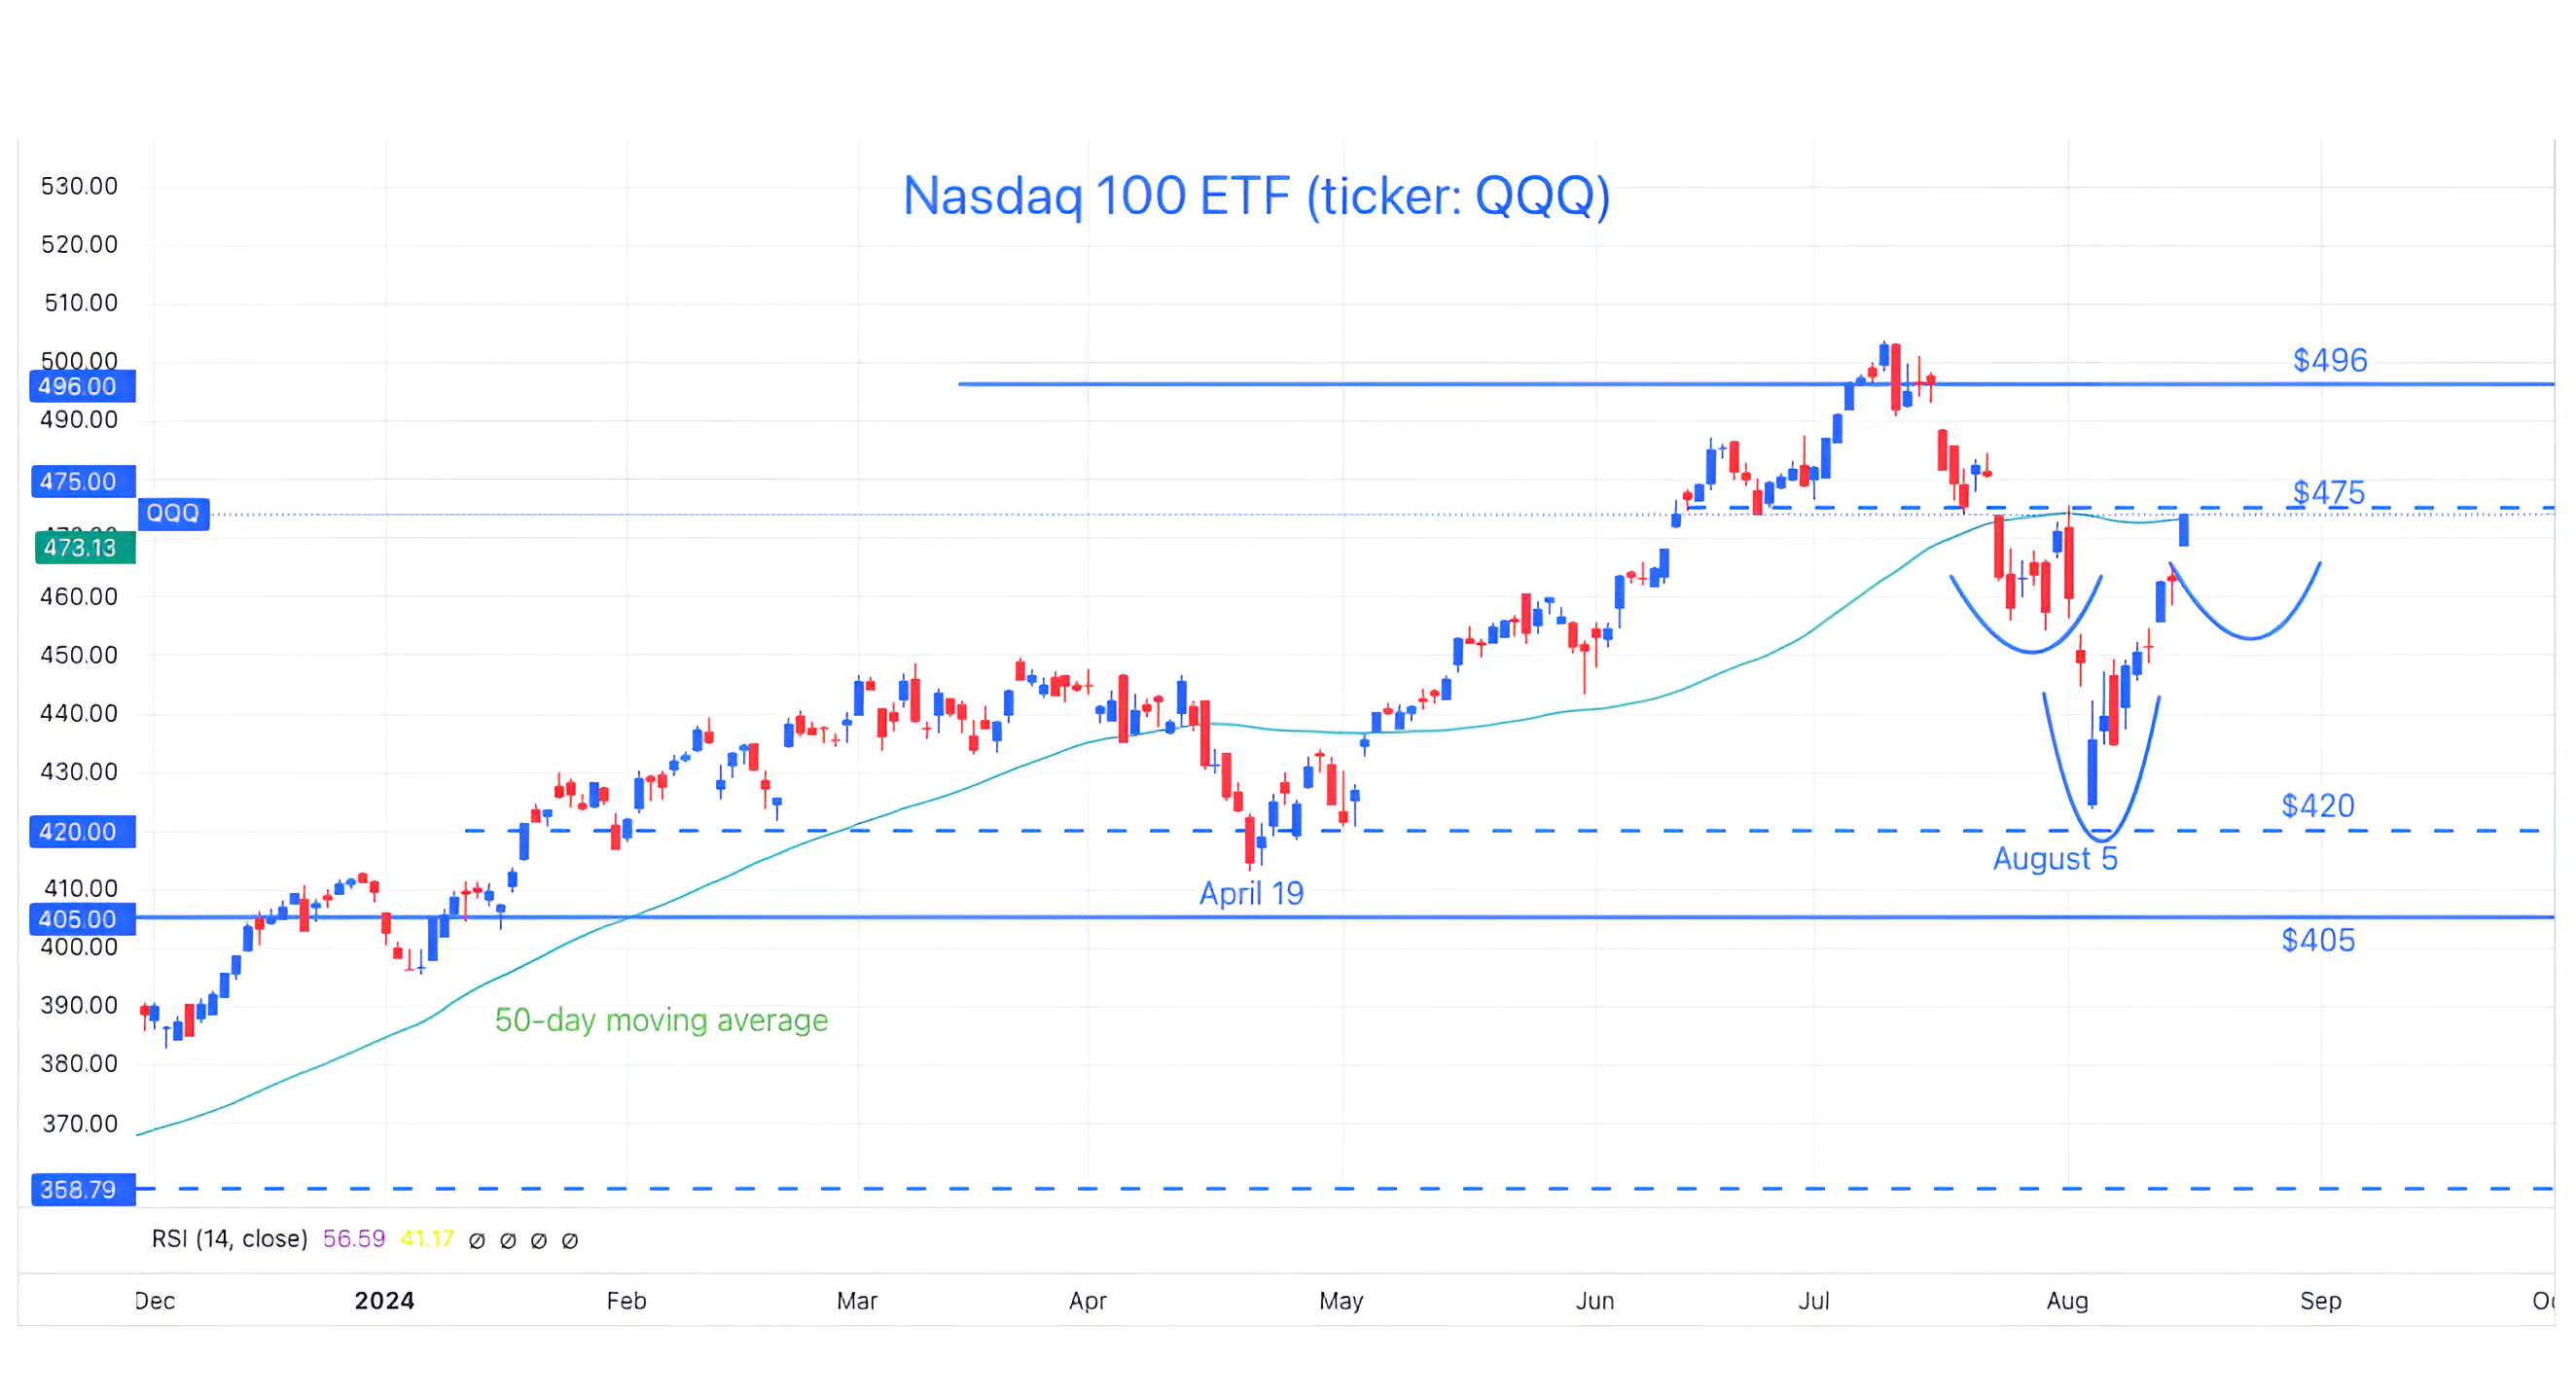
1. A Potentially Bullish Scenario for the Nasdaq 100
Source: Trading View. Through year-to-date 2024.
Over the past three weeks (here, here and here), we have showed the chart above of the Nasdaq 100 ETF (ticker: QQQ).
In the earlier two charts of the Nasdaq 100 ETF, we showed a bearish “head and shoulders” developing with the neckline at $475.
That bearish “head and shoulders” triggered (a fall through the neckline) and the Nasdaq 100 ETF hit our measured target and fell further.
In the most chart of the Nasdaq 100 ETF, we viewed a larger potential bearish “head and shoulders.”
This one did not develop and the pattern was invalidated (no breach of the neckline).
“You might think I’m crazy”, but what we see potentially developing now is a bullish “head and shoulders” pattern (the 3 inverted arcs on the right side of the chart).
If this were to be triggered / confirmed, in our view, the measured target would be around $530.
As we wrote, we are continuing to keep an open mind.
(This is not a recommendation to buy or sell any security and is not investment advice. Please do your own research and due diligence).
2. The Volatility Index

Source: Charlie Bilello. Through year-to-date 2024.
Concurrent with the August 5th market sell-off, the Volatility Index (“Vix”) spiked.
In the subsequent seven trading days (through yesterday), volatility has experienced its greatest seven-day crash.
The chart above shows the top 20 seven-day volatility crashes and the forward S&P 500 returns over different subsequent periods.
While the one-month and one-year and beyond returns are greater than the average return of all other periods, the three-month returns are essentially in line and the six-month returns are lower.
We will see if this trend continues.
(Past performance is not indicative of further results. This is not a recommendation to buy or sell any security and is not investment advice. Please do your own due diligence).
3. Fed Rate Cuts (in Basis Points) Priced In

Source: Mike Zacardi. Through year-to-date 2024.
The chart above shows the Fed rate cuts priced in (in basis points) each month over the next year.
As a reminder, the Fed has three meetings / likely policy announcements left this year: September 18; November 7; and December 18. (The November 7 decision is the day after the US Presidential election).
The market is pricing in at least two 0.25% cuts through November (0.61% / 61 basis points on the chart) and at least four through January (1.06% / 106 basis points on the chart).
There are eight 0.25% cuts priced in over the next year.
While this may have changed with today’s retail sales and jobless claims numbers (both better than expected and reflecting decent economic strength), we thought this was interesting and worth sharing.
(Past performance is not indicative of future results. This is not a recommendation to buy or sell any security and is not investment advice. Please do your own due diligence).
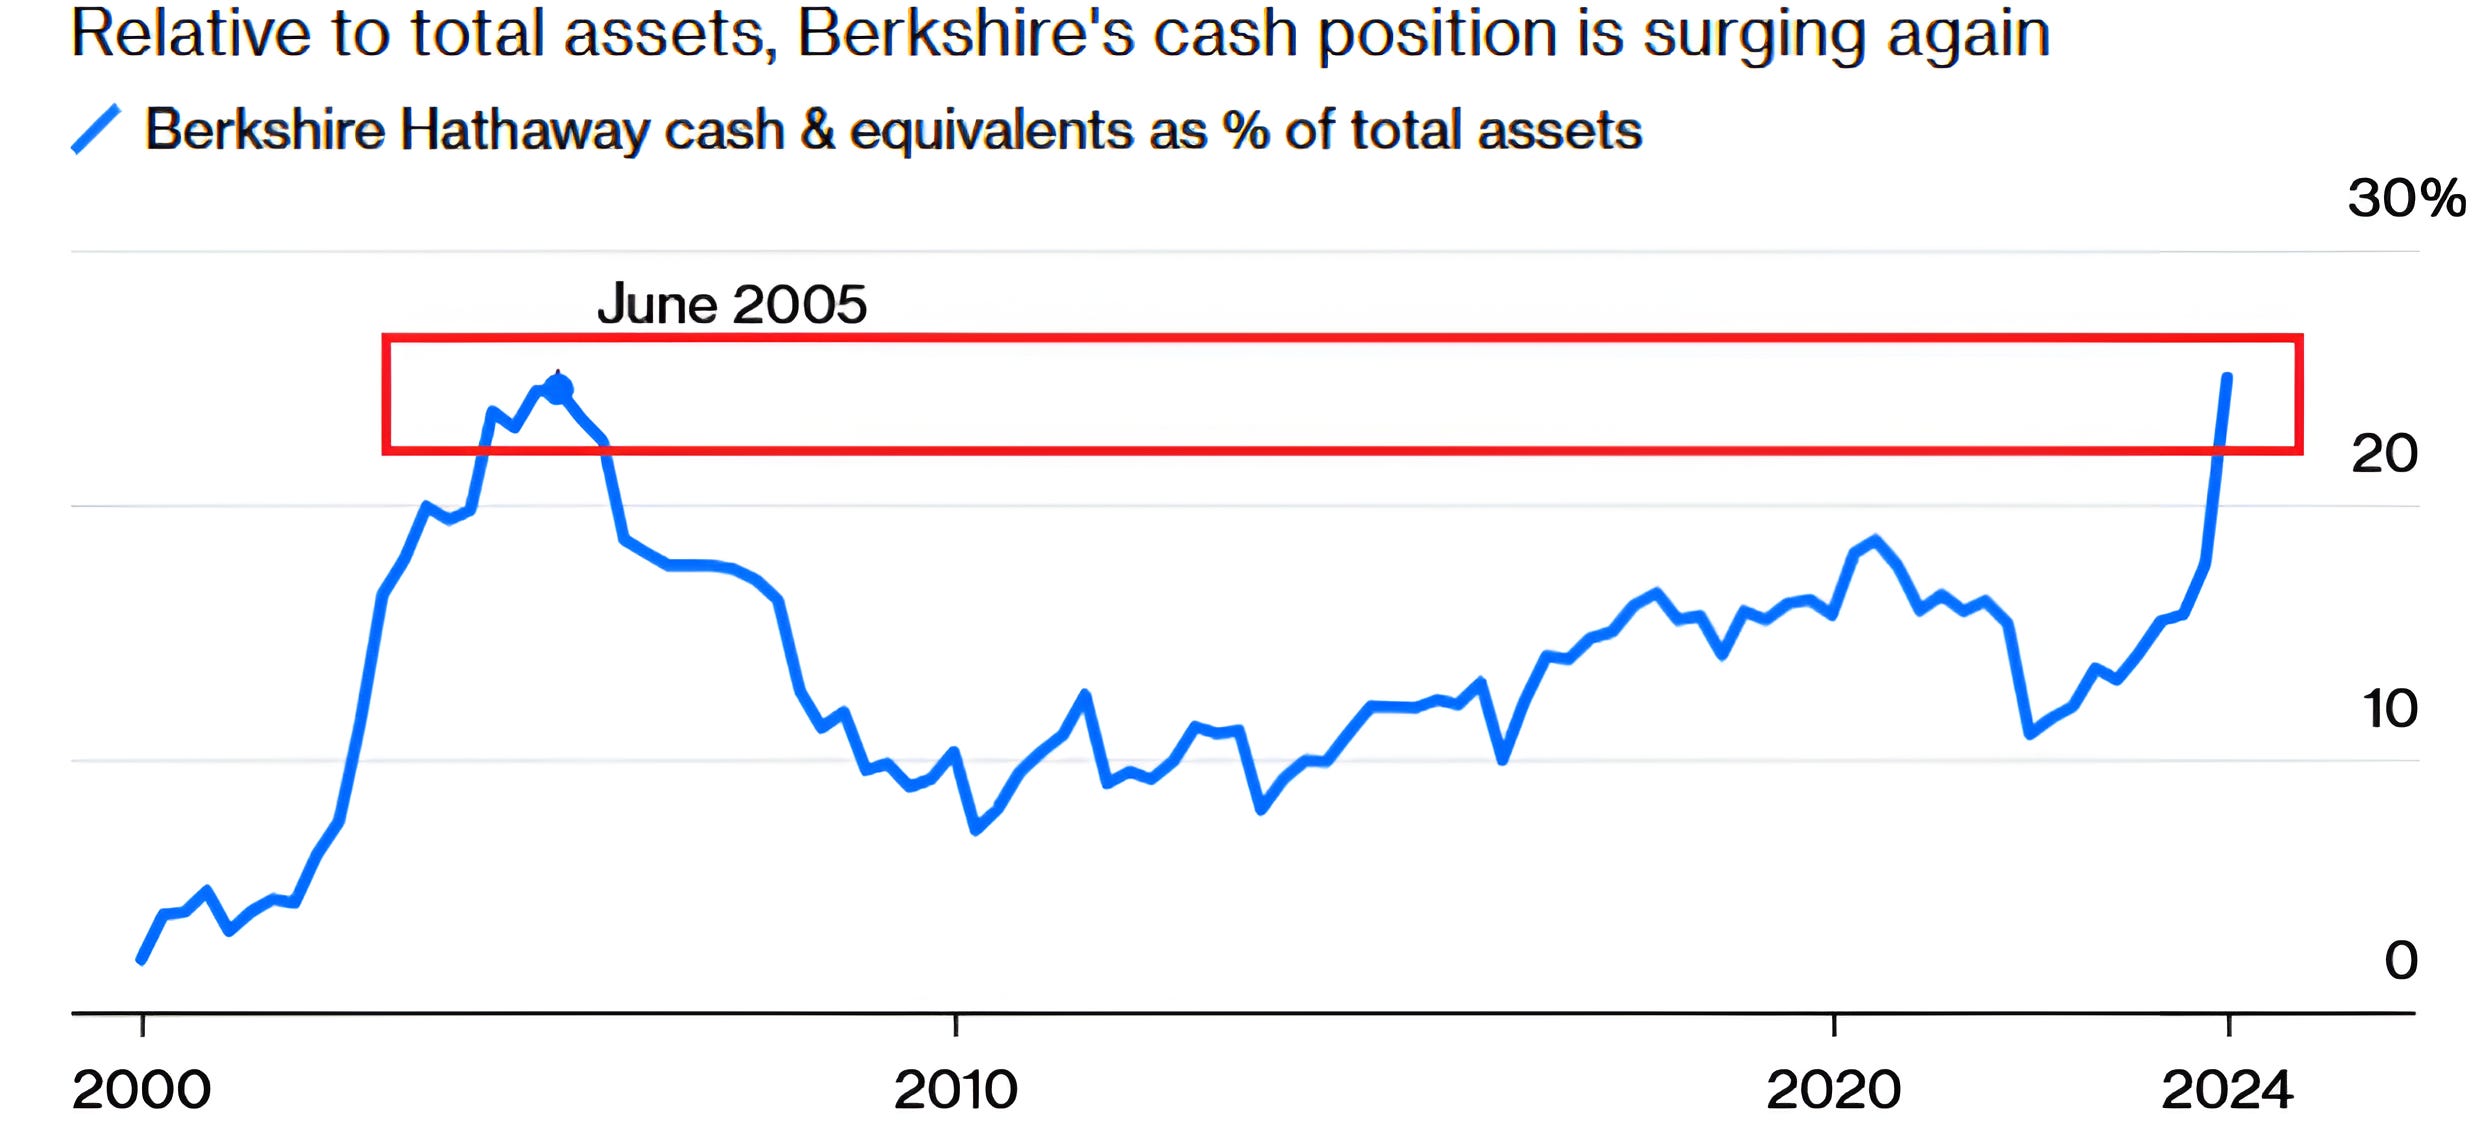
4. WWWD: What Would Warren Do?
Source: Bloomberg. Through year-to-date 2024.
During the second quarter, Berkshire Hathaway sold half of its Apple shares and, in the process, accumulated the highest cash position in the company’s history.
As a percent of total assets, Berkshire Hathaway’s cash and cash equivalents (chart above) is at levels only seen in June 2005.
The good news - in retrospect - is that in 2005, Berkshire Hathaway was two years too early in establishing a high cash position.
In other words, while the company is known for its stock picking prowess, perhaps its market timing is less stellar.
(Past performance is not indicative of future results. This is not a recommendation to buy or sell any security and is not investment advice. Please do your own due diligence).
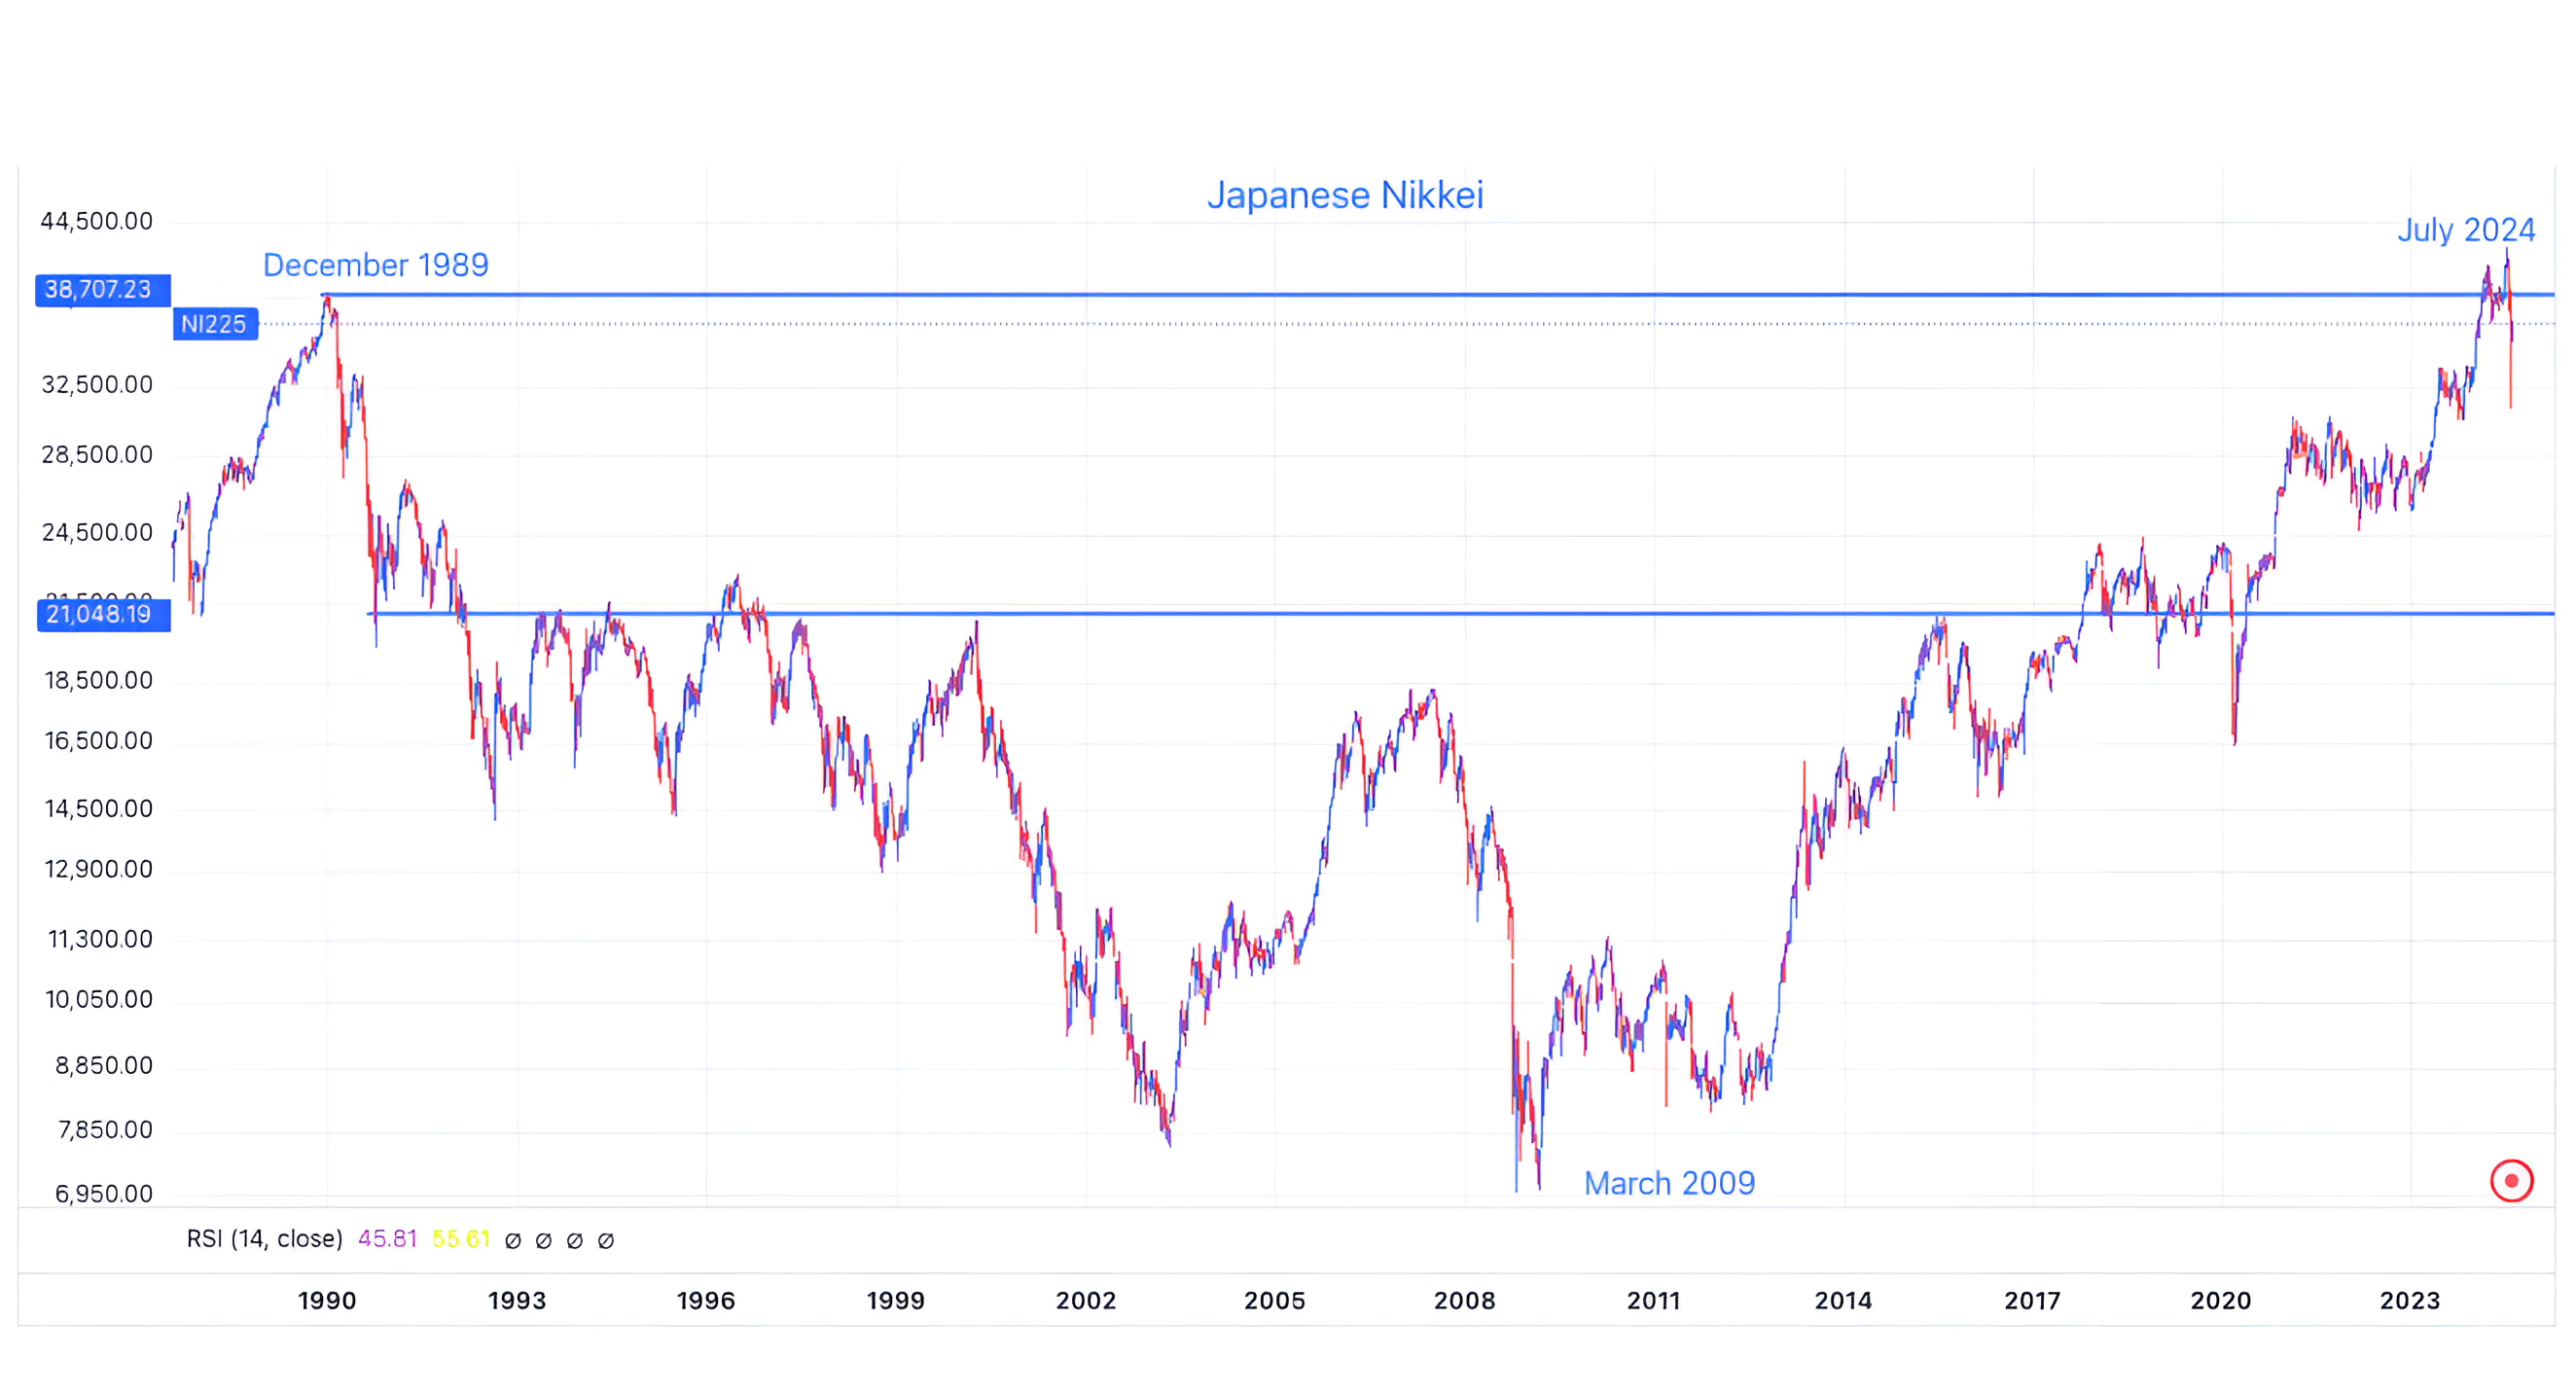
5. This Amazes Me: the Japanese Nikkei
Source: TradingView. Through year-to-date 2024.
Six months ago (chart 5 here), we showed this long-term chart of the Japanese Nikkei and questioned “how much institutional memory is in markets?”
At the time, the Nikkei was approaching its December 1989 peak after 34 years and we wondered how the index would react.
We wrote:
“Many believe that after climbing back to a past peak level after a fall, asset prices pause because those that bought at or near peak levels sell with the relief of “getting back to even.”
Important price levels like past peaks are sometimes referred to as institutional memory.
The question is what holder of the Japanese Nikkei has been waiting 34 years to “get back to even” before selling?”
Well - I guess we have our answer.
After trading through its 1989 high (what I would call in the range), the Japanese Nikkei fell 26%!
It is now back below the 1989 peak and in our view, it may take some work to regain the strength to meaningfully cross back to the north.
(Past performance is not indicative of future results. This is not a recommendation to buy or sell any security, please do your own research).