

Do Do That Voodoo that You Do So Well.*
Since the beginning of the year, we've been highlighting stealth liquidity that has been driving markets higher. The Fed and Treasury are at it again and markets may be responding. Let's dig in...
In a series of subtle moves over the past few weeks, the wizard Janet Yellen has added liquidity to the markets and continued to fund the US deficit all while Powell (and other Fed members) have talked tough about inflation and she has complained about fiscal spending.
Stealth liquidity and stimulus has been a theme of ours since the beginning of the year (see here, here, here, chart 4 here and here) as we tried to answer our question of why US equities were trading at early cycle valuations (20-21x expected earnings) with elevated inflation, Fed tightening and higher 10-Year yields (the 3 factors most (negatively) correlated with equity valuation).
As we have written, we are believers in Stan Druckenmiller’s Austrian view of economics that liquidity drives markets:
“Earnings don't move the overall market; it's the Federal Reserve Board... focus on the central banks, and focus on the movement of liquidity... most people in the market are looking for earnings and conventional measures. It's liquidity that moves markets.”
This morning, Stan Druckenmiller was interviewed on CNBC:
“The Treasury is still acting like we’re in a depression. Since October, there does seem to be a lot more recognition by various people I see on your show and elsewhere of the fiscal situation facing us. Everyone seems to get it but Yellen who keeps spending and spending.”
While we share and have written about Druckenmiller’s (and our) concerns of inflation, deficits, and fiscal dominance, we are here to invest.
Last Monday (here) we wrote:
“If, over this week, as earnings, the Fed, PMIs and employment come out and the S&P 500 trades convincingly over its 50-day moving average (currently 5126), we may consider rescinding our cautious call.”
Today’s close was not necessarily a “convincing” continuation of yesterday’s move over the 50-day moving average and before sounding the “all-clear”, we would like to see decent follow through.
That said, with the liquidity from the Fed and Treasury; a solidifying earnings story (chart 2); and seasonality (chart 5), equities may be on a glide path to 2025.
*By the way, this morning’s headline is song lyric rather than a title. The song is “You Do Something to Me” by Cole Porter.
1. Look Over There…
Source: Strategas. Through year-to-date 2024.
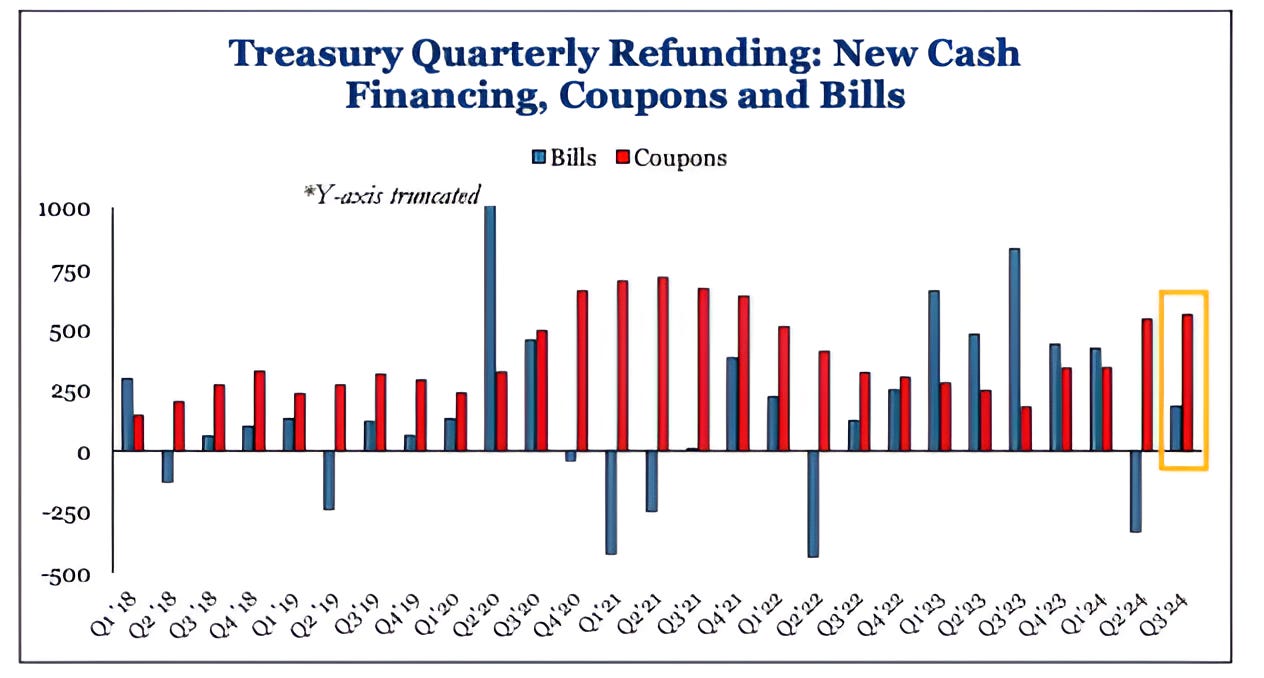
Last week, while most investors were focused on the Fed and the employment figure, the Treasury was busy in the background announcing its quarterly refunding policy.
Essentially, this is the time each quarter when the Treasury announces how much it will borrow over the next three months to finance the deficit and how it will borrow split between bills and coupons. (We looked at this here).
Coupons are long-dated bonds that are considered to tie up investors’ money and reduce liquidity.
Bills are short-term and keep markets far more liquid.
As we have been highlighting under our fiscal dominance theme, the US budget deficit is coming in higher than expected. (chart 5 here).
Last Monday, the Treasury acknowledged this by announcing that issuance (borrowing) will need to increase, but chose not to increase longer dated (coupon) bond issuance.
Instead, the Treasury will retire $50 billion fewer T-bills in Q2 and issue $183 billion new T-bills in Q3.
These T-bills are likely to be funded by the Reverse Repo facility.
Throughout this year, we have been highlighting how the Treasury through a combination of its General Account (the TGA) and the Reverse Repo facility (RRP) have been adding “stealth” liquidity to the markets.
We highlighted last Thursday in chart 1 of “Welcome to the Machine” here.
In addition, last week, as we mentioned, the Fed announced (as we had expected they would) the slowing of Quantitative Tightening (QT) - another liquidity measure.
According to Dan Clifton at Strategas (the best Washington Strategist and the best independent research firm, respectively):
“Last week will mark one of the most important weeks for policymakers laying down a security blanket of liquidity into the 2024 election.
By our count, Wednesday’s one-two punch from Powell and Yellen resulted in $273 billion of NET new liquidity through Q3 via T-bills/Reverse Repos and the slowing down of Quantitative Tightening (QT).
Policymakers are showing they will use other vehicles of liquidity, like QT or T-bills, until the Fed can cut rates.
Liquidity is turning higher through the end of September.”
In other words, Dan Clifton is saying, that the Fed and Treasury are juggling non-traditional liquidity measures - using bills rather than coupons, slowing quantitative tightening, using the Treasuries General Account and the Reverse Repo facility - until the Fed is actually able to cut rates.
The Fed and Treasury did this throughout 2023 and in our view were largely partially responsible (compliance) for the equity rally (at least the valuation multiple expansion).
They are trying for a repeat performance in 2024.
If markets respond in the same way as they did last year, this will likely mean lower 10-Year Yields (we highlighted 4.34% yesterday); a weaker dollar and higher equities.
(This is not a recommendation to buy or sell any security and is not investment advice).
2. An Positive Sub-Plot In Earnings Season
Source: FactSet. Through year-to-date 2024.
During Q4 earnings season, I complained that companies were cutting estimates for the current quarter (Q1 estimates were moving lower) and padding the back half of the year with higher projections (Q3 and Q4 estimates were moving higher).
I called this phenomena “cut and roll” (here, here, here, and here).
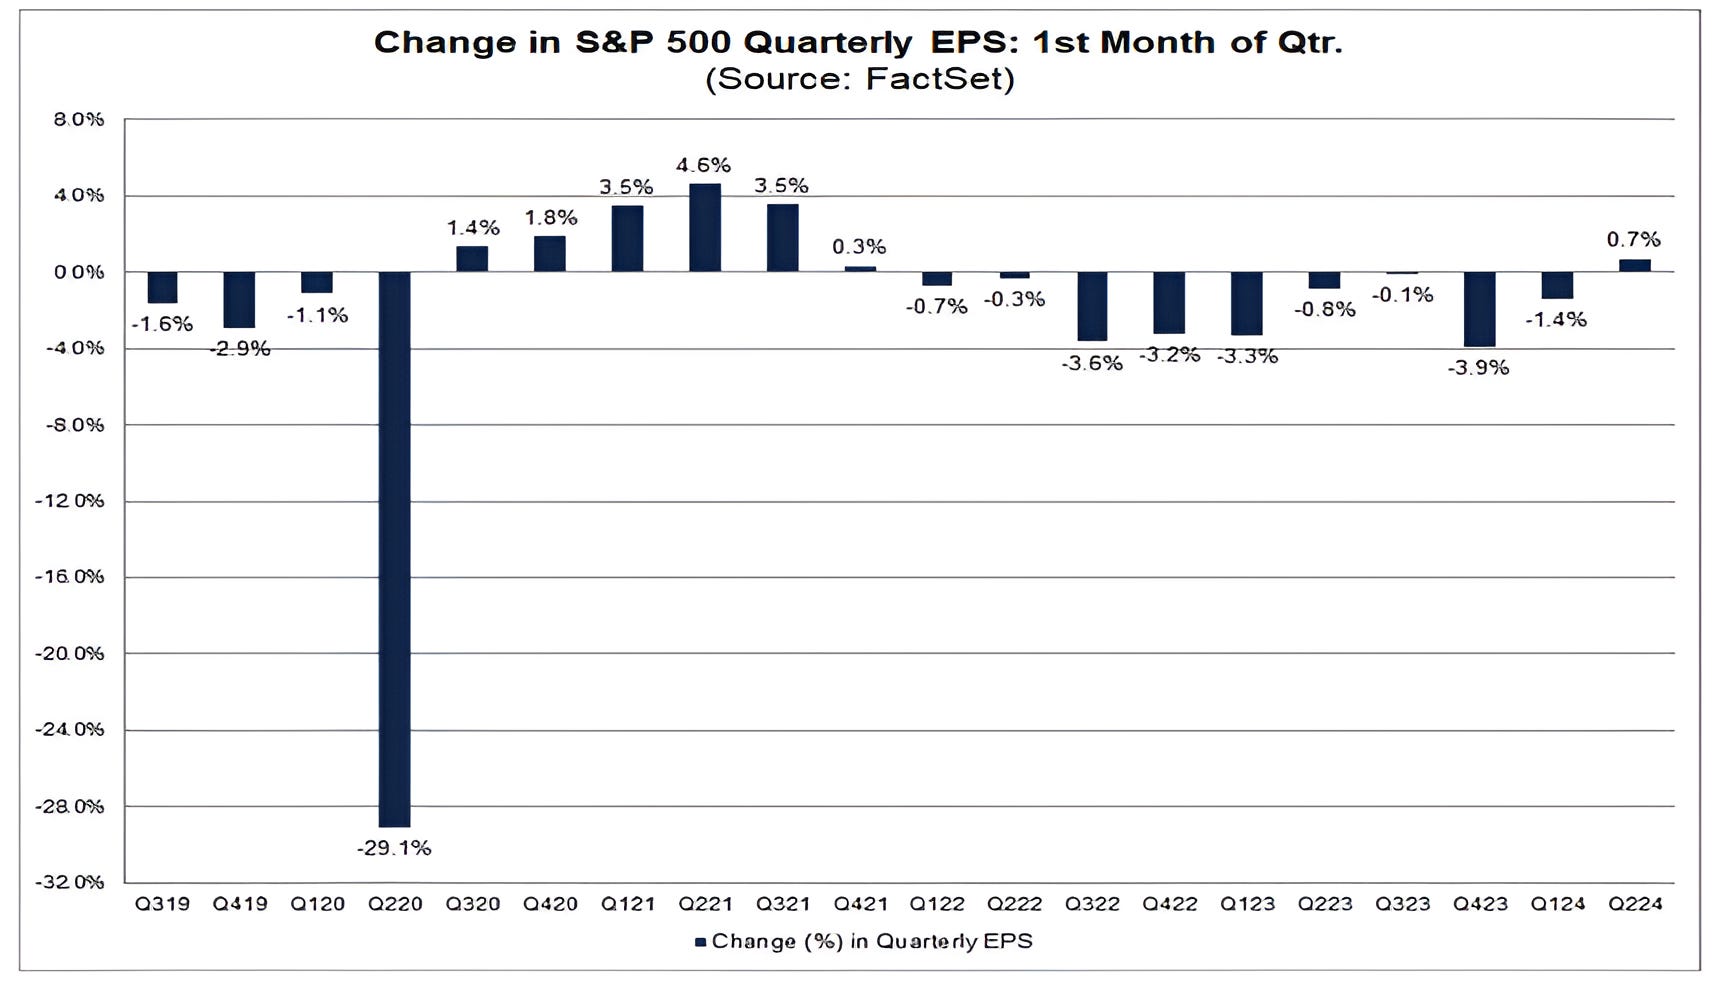
Q1 earnings season, as can be seen on the chart above, has been different.
During the first month of Q1 earnings season, Q2 earnings expectations have actually increased.
This needs to be acknowledged (especially by me).
During the past 20 years (80 quarters), the average decline in the S&P 500 earnings estimate during the first month of a quarter has been 1.8%.
The current quarter has marked the first time that the S&P 500 earnings estimate has increased during the first month of a quarter since the post covid recovery quarter of Q4 2021 (+0.3%).
In other words, unlike the past 9 quarters, during the first month of Q1 earnings, companies are raising their current quarter (in this case Q2) estimates rather than cutting them.
We have continually questioned whether future earnings expectations - including what was 8.7% year over year growth in Q2 - was achievable.
We have also consistently said, the quarter upon which management team’s have the most clarity is the current one.
Now nearly half way through Q2, companies are expecting 9.2% earnings growth in the quarter.
When management teams, who’s share prices are often rewarded by lowering the earnings bar and jumping over it, are actually raising the bar for the current quarter, that to me says the fundamental outlook is stronger than I believed.
(As an aside, as the two foundations, in our view, of the current market are earnings / fundamentals and liquidity (which is driving and supporting valuation), we have continually reviewed, discussed and analyzed these topics and therefore there are a lot of links).
(This is not a recommendation to buy or sell any security and is not investment advice. Please do your own due diligence).
3. Watching this Battle Closely…

Source: TradingView. Through year-to-date 2024.
Over the past three months, I have spoken to several family offices and individual investors that are considering increasing their allocation to ETFs and away from active managers, single stocks, hedge funds, and, in some cases, other illiquid investments (see Chart 4).
Despite the fact that ETFs are considered to be “passive” investments - there is no active portfolio manager of the underlying holdings as they often simply mirror an index - I am a believer that even passive investments need to be actively managed.
What does this mean?
Even if the S&P 500 is a core holding in your liquid equity portfolio through an ETF (SPY, VOO or something else), there are times that “tactically” S&P 500 exposure can be trimmed and allocated to cash or to the Nasdaq 100 ETF (ticker: QQQ); Semiconductors, Financials, Software, Energy, EM equities, Europe or another region, sector or theme.
Why?
Just as the the Nasdaq 100 outperformed the S&P 500 from beginning of 2023 to the beginning of 2024 (chart above), there are often other opportunities to increase return and / or decrease risk.
If the S&P 500 is moving higher by 20% and the Nasdaq 100 is moving higher by 30%, all else equal, we want to be invested (at least a portion of our allocation) in the Nasdaq 100.
This is why we show the relative charts.
While Nasdaq 100 outperformance has paused (chart above), in our view, if it resumes, the gains relative to those in the S&P 500 could be attractive.
If, on the other hand, the Nasdaq 100 continues to lose its performance battle with the S&P 500 (it has been underperforming since January 24), we want to be aware and invest accordingly.
(This is not a recommendation to buy or sell any security and is not investment advice. Please do your own due diligence).
4. The Private Transaction Illiquidity Dilemma

Source: Bain. Through year-to-date 2024.
After having worked with so many families for so long, the current illiquidity challenge has become apparent to me.
The chart above from Bain attempts to quantify it.
While the Fed and Treasury have maintained their stealth liquidity balancing act, many individuals and family offices invested in hedge funds, private equity, venture, real estate, private credit and other “illiquid” transactions from 2018 - 2023 and are feeling “stuck.” (for lack of a better word).
The real estate and private equity deals from 2018 / 2019 are suffering from the effects of high interest rates.
Hedge fund and venture investors are still recovering from the valuation re-rating of 2022.
Despite all of this, there remain capital calls for unfunded commitments.
In the chart above, this dynamic in a ratio of distributions to contributions (top line).
Based on this metric, the current period has been the worst for illiquid investors than any other period over the past 15 years.
Like the other periods, this too shall pass, however, it will be a matter of time (longer) and price (likely lower).
(This is not a recommendation to buy or sell any security, please do your own research).
5. Another Look at Seasonality…
Source: Strategas. Through year-to-date 2024.
We have continued to look at election year seasonality (chart 5 here and our favorite, chart 5, here).
The one consistent element we see is that often in US Presidential election years by the end of May, equity volatility has subsided and the prevailing trend is higher. (Past performance is not indicative of future results).
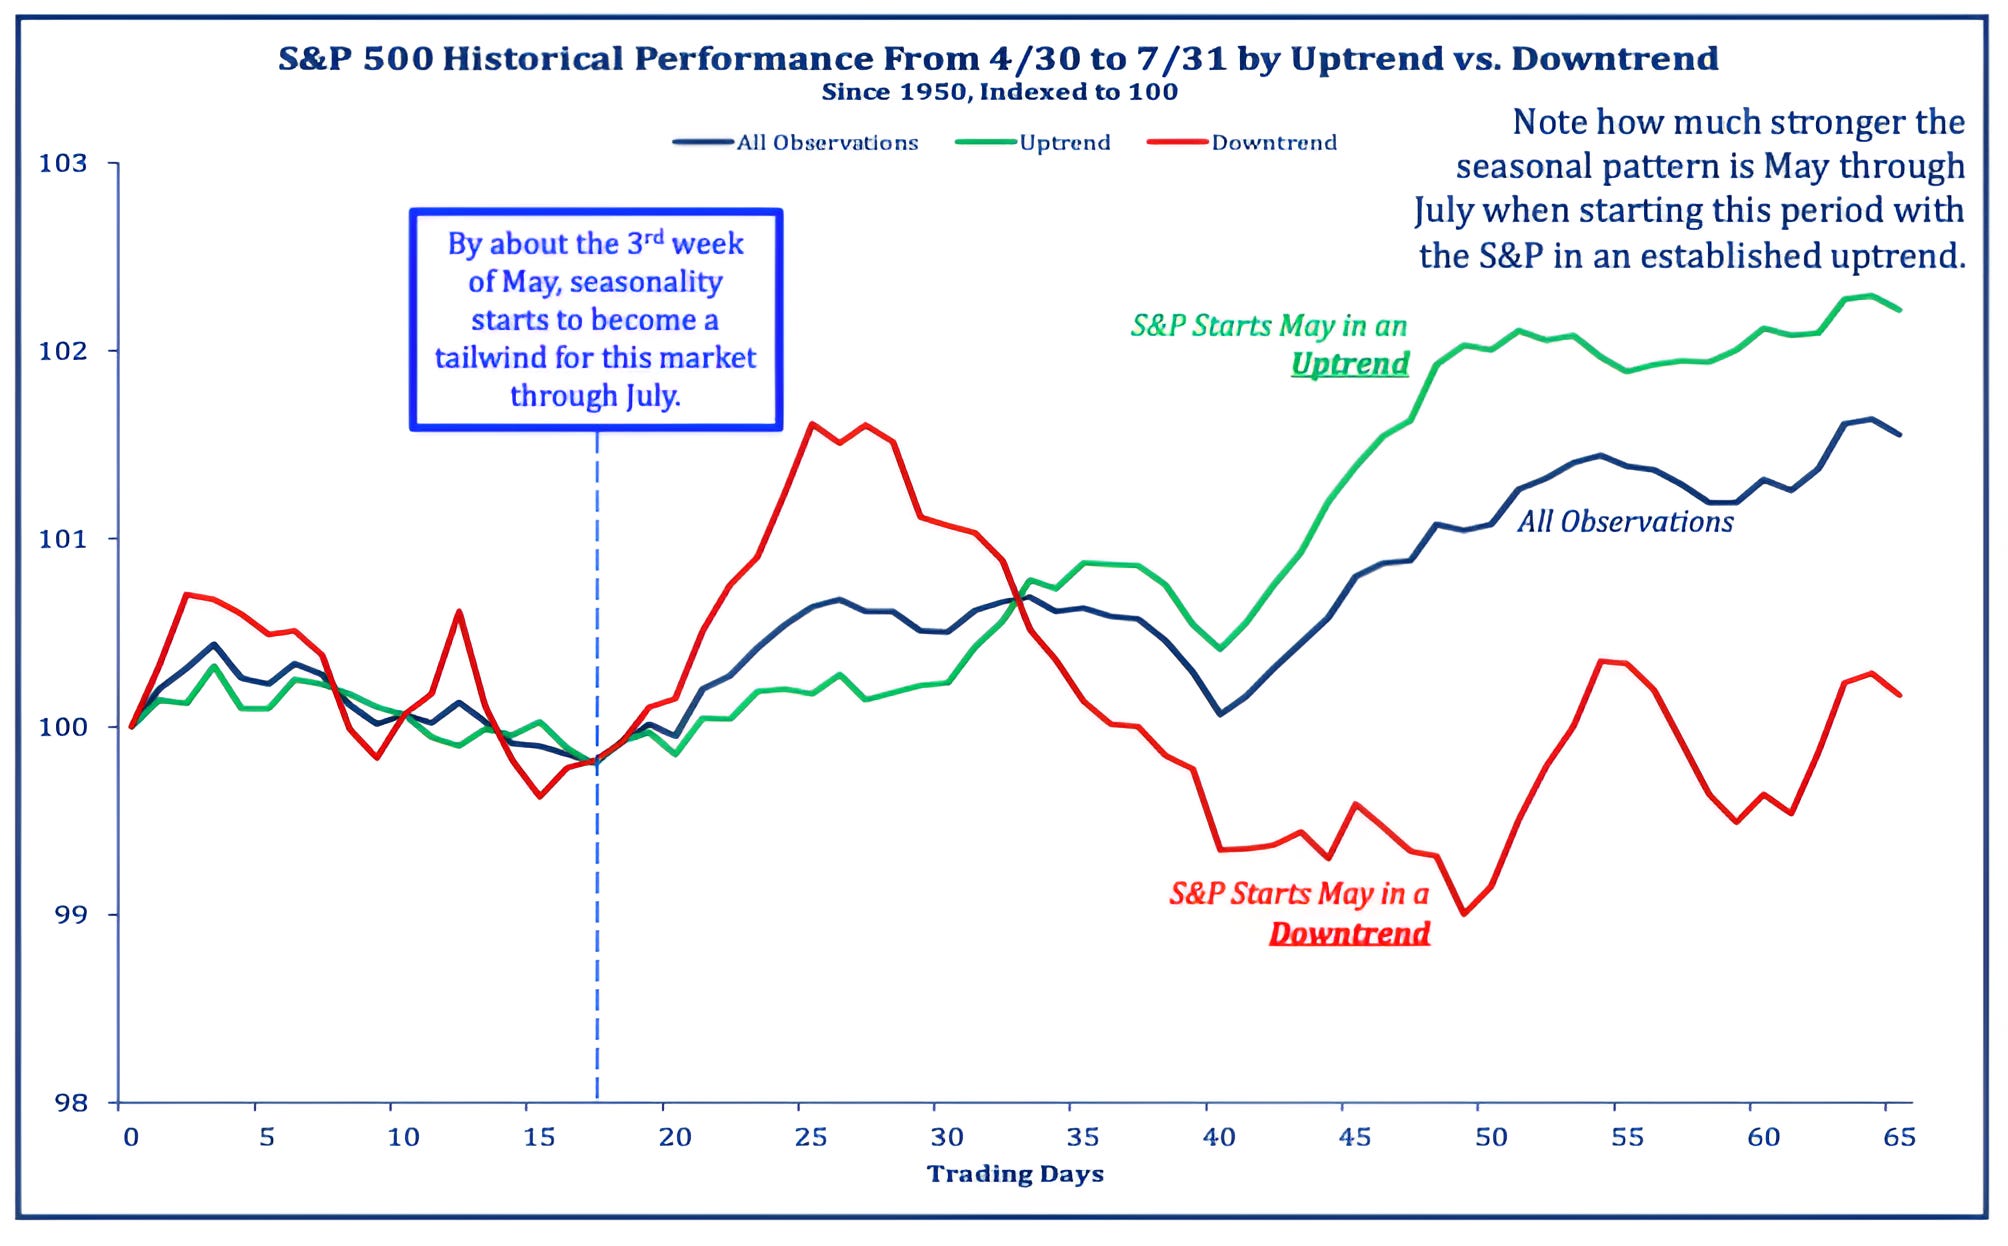
The chart above takes a different approach as it includes all years since 1950 (not just US presidential election years) and considers whether or not the S&P 500 when entering May is in an uptrend (above its 200-day moving average) or a downtrend (below its 200-day moving average).
This year, entering May, the S&P 500 was above its 200-day moving average (in an uptrend).
Historically, when the S&P 500 has entered May in an uptrend, the predominant trend over the next two months is higher. (Past performance is not indicative of future results).
(This is not a investment advice and is not recommendation to buy or sell any security).