


Land of Confusion
Dead cat bounce or sustainable recovery? That is the question (apologies to Shakespeare). Regardless, we believe watching leadership and refining positioning (value + AI 1.1) is key. Let's dig in...
1. How it Started, How it’s Going…Small Caps

Source: TradingView. Through year-to-date 2024.
We last showed Small Caps 8 days ago (here).
At the time, we remarked that the Russell 2000 was nearing the $192 level from which it could bounce.
“With its 2-week 9% sell-off (peak to low), we believe the near-term selling in the Russell 2000 and for that matter equities overall may be exhausted.”
While we were a little early with our commentary, the idea was clearly accurate.
We went on to say, “While we don’t see a full near-term recovery, we do see the Russell 2000 moving back up to the $198 level (the 2022 / 2023) ceiling, where we believe a real test will take place.”
Yesterday, the Russell 2000 Small Cap ETF (above) closed at $198.57, and, consistent to what we wrote 8 days ago, we expect a battle to take place around this level.
Will Small Caps fight there way back up to the $206 level or will they be pushed back down to $192?
In our view, watching the Small Caps will be helpful in assessing whether last week’s 5.5% correction has completely run its course and a sustainable upside move has begun; or if this week’s move is simply an oversold bounce that will give way to lower prices.
(This is not a recommendation to buy or sell any security and is not investment advice).
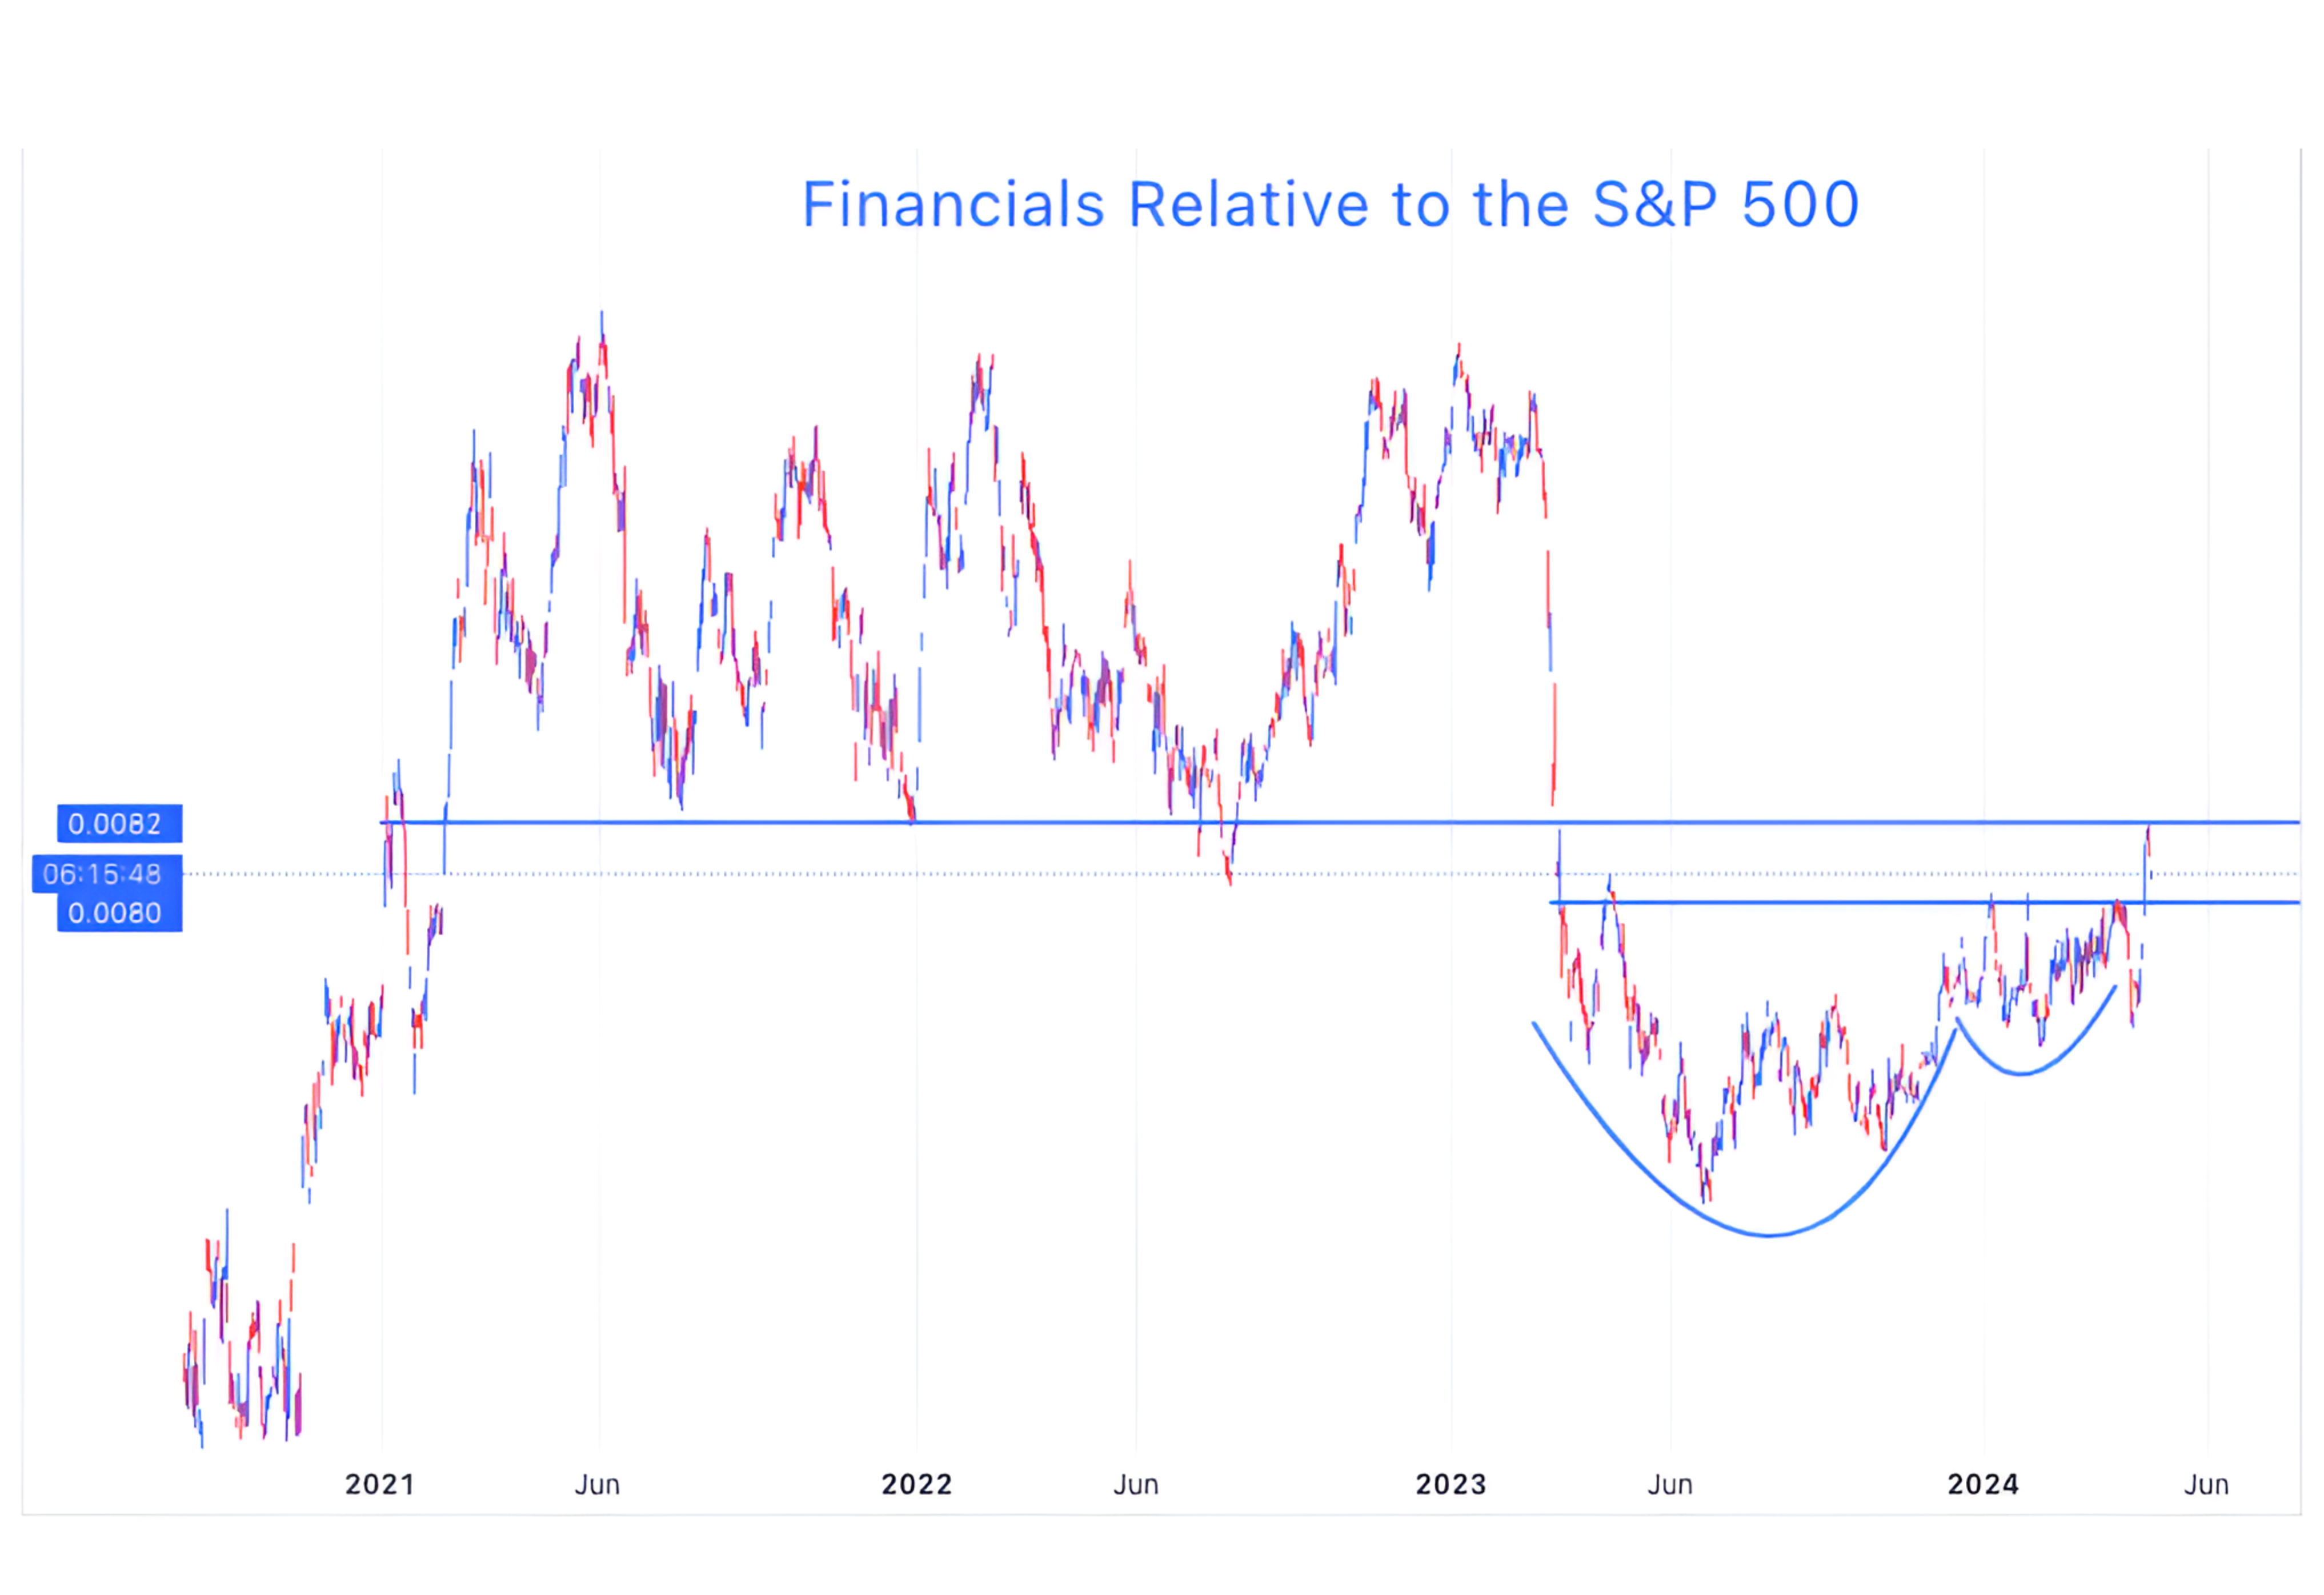
2. Financials Relative to the S&P 500: Purgatory
Source: Earnings Whispers. Through year-to-date 2024.
After the March 2023 regional-bank induced sell-off, Financials have spent the last year proving their appeal to investors.
Despite the negative initial reaction to JP Morgan’s earnings (that we had characterized as solid), last week, as Growth / Technology / AI sold off, the Financial sector outperformed.
The good news was that on a relative basis, the Financial sector moved above the ceiling level on a “cup and handle” pattern (large arc followed by a more shallow arc) which, if confirmed, often signals further upside.
The bad news was that upon its move above the ceiling level of the “cup and handle” pattern, the relationship ran right into its 2021-2022 relative floor (higher light blue horizontal line).
At this point, we see the relationship in purgatory - caught between the “cup and handle” ceiling and the long-term floor.
A move above the long-term floor would likely signal “confirmation” of the “cup and handle” and indicate the possibility of further relative upside. Whereas a drop back below the recent ceiling would “negate” the pattern and potentially call into question the strength of the economy.
From a more macro equity perspective, similar to the next move in the Small Cap shares, we see the relative performance of the Financials - an economically sensitive sector - as an indicator of whether the current move is a sustainable rally that should be embraced or an oversold bounce that should be used to refine positioning and allocation.
(This is not a recommendation to buy or sell any security and is not investment advice).
3. Could this be Putting Downward Pressure on Oil Price?

Source: Financial Times / Vortexa. Through year-to-date 2024.
Last week, we questioned, why in the midst of heightened Middle East tension were oil prices going down.
On Thursday, we asked “Was it because the Biden administration knows the sensitivity of the US electorate to oil prices and has been aligning itself more with Saudi Arabia to keep oil in check?”
And on Friday, we wrote, “Although this might not be exactly the right reason, I wouldn’t be surprised to see a OPEC quota increase or another source of supply that is weighting on oil price.”
When we saw the graphic above, with the headline Iran’s oil exports hit a six-year high, we felt as if we had part of our “another source of supply” answer.
As we sought further evidence to support our hypothesis, we found that during March, based on data from the General Administration of Customs, China's imports from Russia increased 12.5% to 2.55 million barrels per day.
According to Reuters, “Seven Russian tankers under sanctions offloaded Sokol cargoes in Chinese ports in March, as Russia worked to clear a glut of stranded supply in the wake of tightened U.S. sanctions.”
The data also showed 375,296 tons of imports from Venezuela, following a rare shipment of 352,455 tons of Venezuelan crude in February amid a temporary relaxation of U.S. sanctions on Caracas.
Sanctions were re-imposed last Thursday after the U.S. said President Nicolas Maduro had failed to meet his election commitments.” (Full article here).
In our view, heightened exports from Iran, Russia and Venezuela seemed to have recently added to supply and weighed on price. There may have been other factors.
We will continue to watch oil prices as they are a key component of inflation and inflation expectations.
(This is not investment advice or a recommendation to buy or sell any security).
4. We Continue to Watch Utilities…

Source: TradingView. Through year-to-date 2024.
We last showed the Utilities sector three weeks ago (here) and thought an update was appropriate.
As a reminder, whereas Financials are considered cyclical value, Utilities are considered defensive value.
In other words, Utilities are the corner of the equity market to which portfolio managers allocate when they want to be defensive but either cannot (due to mandate) or don’t want to raise cash.
As an example, we can see that Utilities began to rally before the covid sell-off (two arrows on the left).
Interestingly, prior to covid, the Utilities sector fought with and moved higher than the same level that it surpassed in the past few days.
Often Utilities, which generally carry above average dividend yields, will rally if investors believe 10-Year Treasury yields will or are moving lower.
However, in the current environment, Utilities have moved higher concurrent with higher 10-Year Treasury yields.
All of that said, we have three current observations with respect to the move in the Utilities sector:
The recent move above the ceiling in the “cup and handle” formation that we have drawn in (large arc followed by the small arc), will not hold and the Utilities sector will “fail” on its attempt to move back above it long-term battle-line. In which case, “nothing to see here;”
The new 6-month closing high (yesterday) in the Utilities sector is a warning that equity investors are expecting volatility and seeking safety, or;
The power requirements of AI data centers is such that the fundamental expectation for Utilities has increased and price, despite higher 10-Year Treasury yields, is simply reacting to an improving earnings outlook.
We saw a similar dynamic post covid when Utilities, despite their defensive nature, rallied with the rest of the equity market.
We will continue to watch.
(This is not a recommendation to buy or sell any security, please do your own research).
5. Seasonality: Magnitude Looks Right, Duration is Short
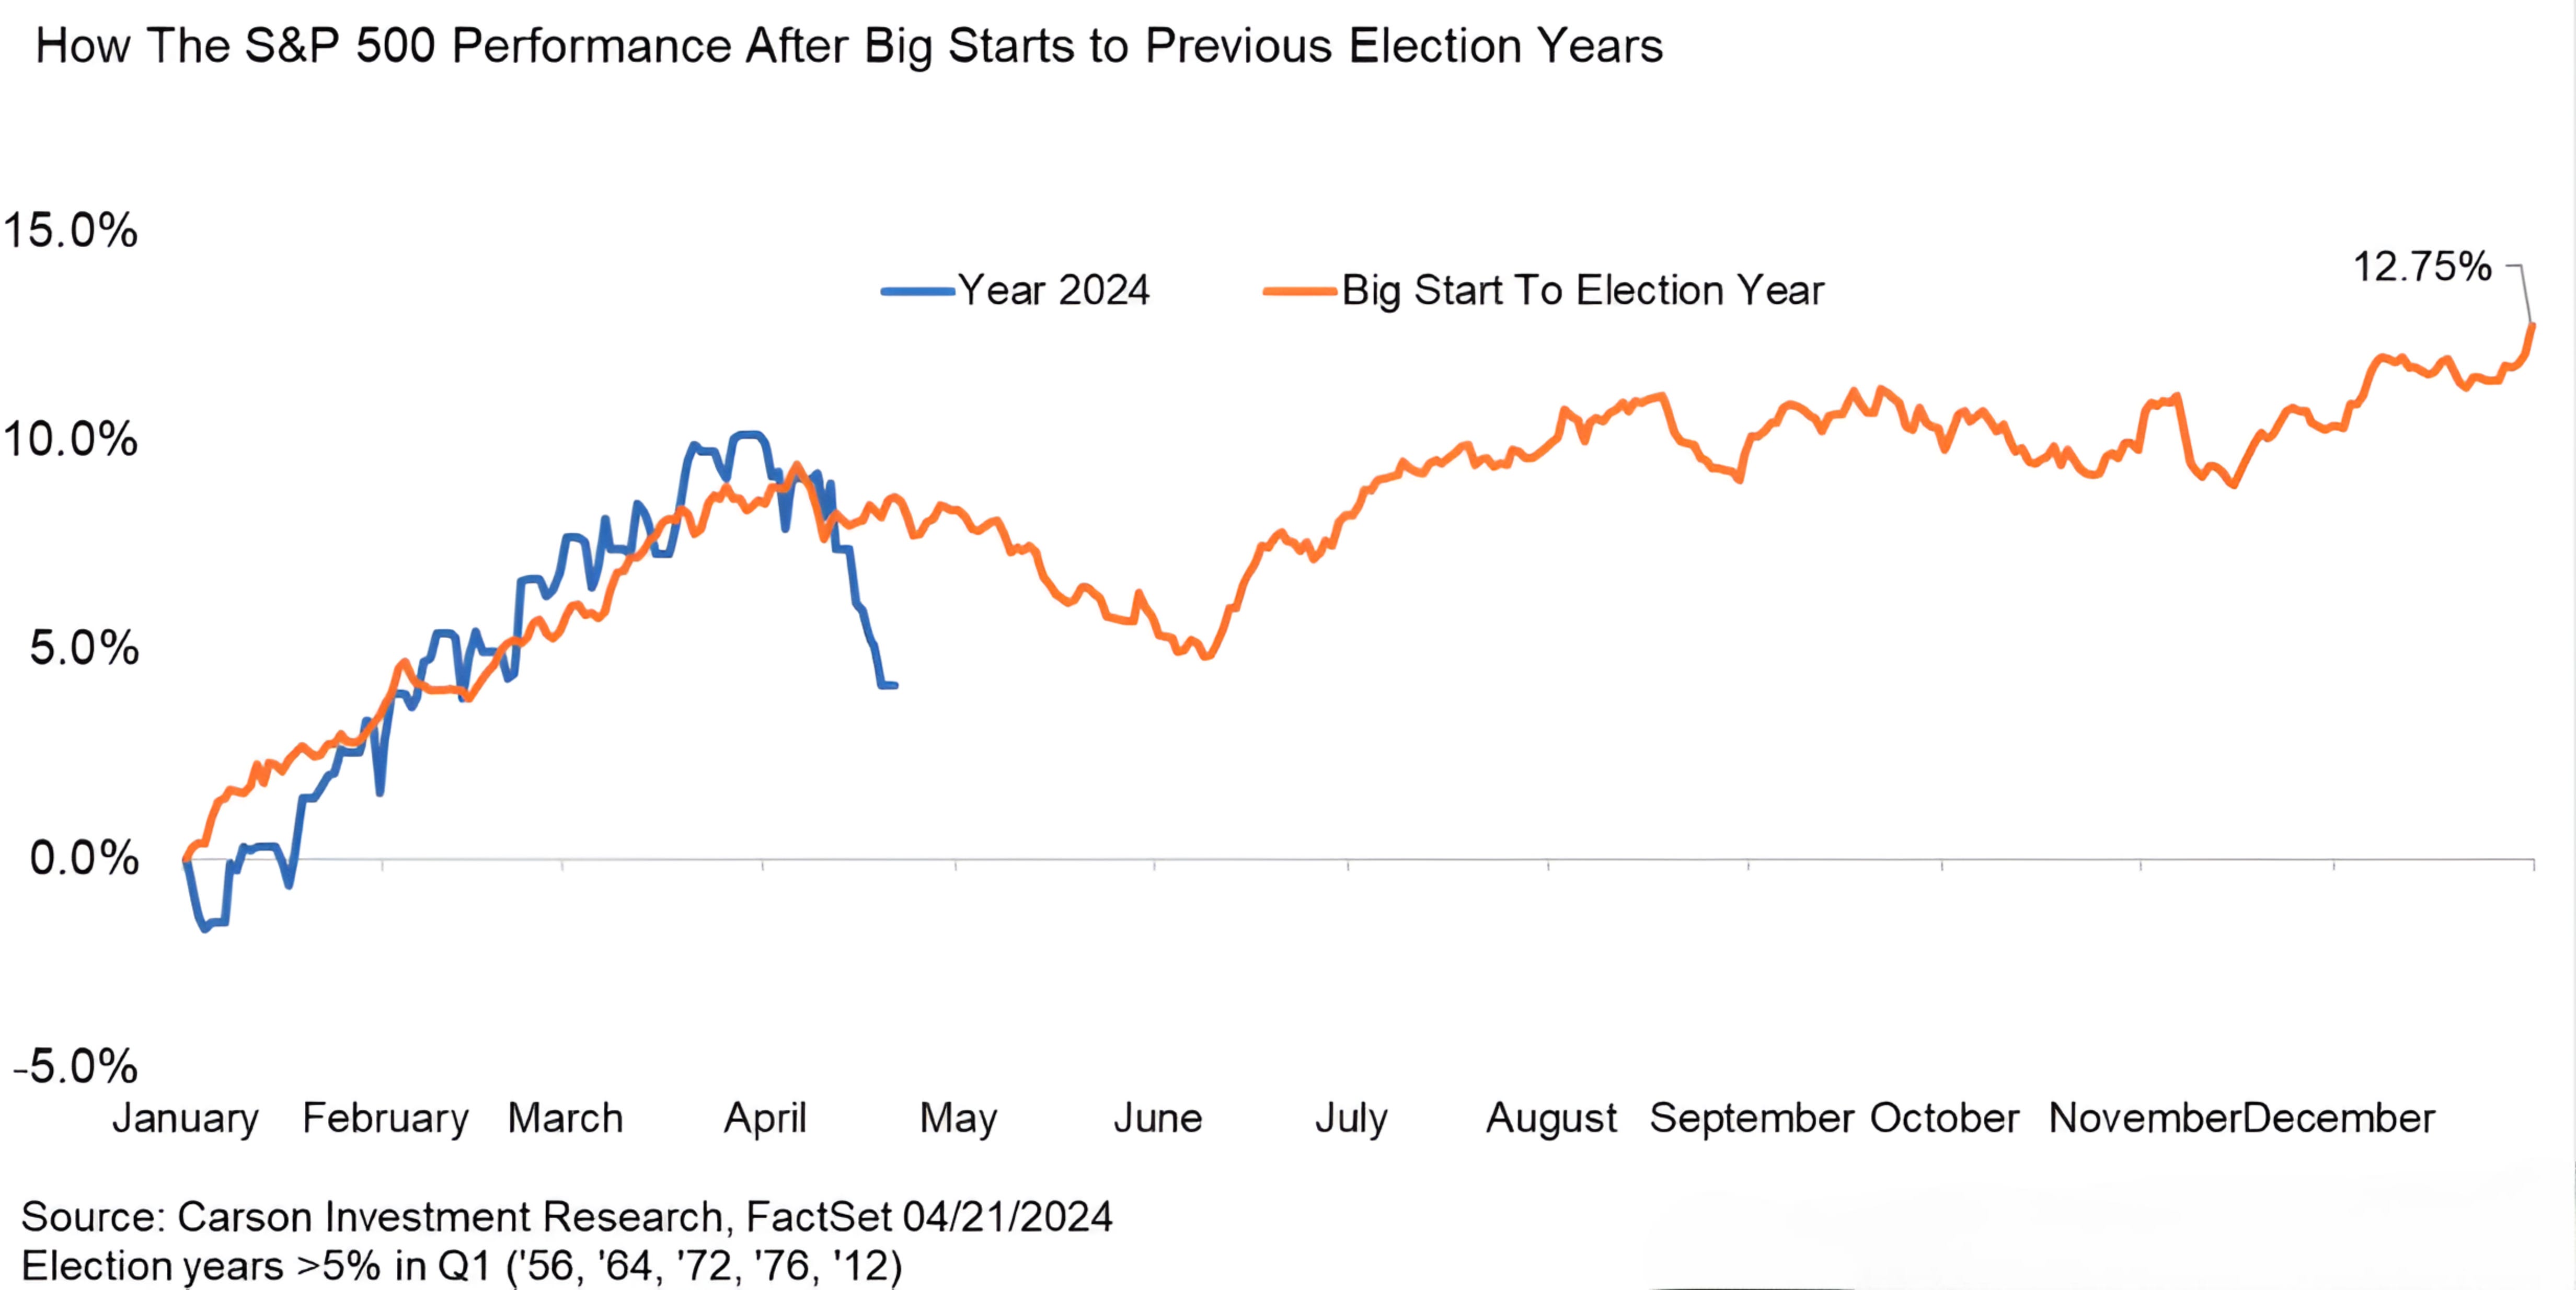
Source: Carson Investment Research. Through year-to-date 2024.
We took a slightly different look at election year seasonality (here).
The first chart looked at Presidential Election year seasonality from 1936 and looked at the S&P 500 pattern when the incumbent won re-election vs. those years when the incumbent lost.
The chart above, which begins in 1956, looks at those election years when the S&P 500 was up more than 5% during the first quarter.
While we recognize there is some overlapping data, both charts take different approaches and conclude in the same place.
Typically, in years when the incumbent wins re-election (the path more similar to that of the S&P 500 in 2024) and / or when the S&P 500 has been up more than 5% during the first quarter, there is a sell-off from April through May.
Although last week’s sell-off seems to have matched the magnitude of a typical 5%+ first quarter election year April through May correction, the duration seems short.
We never solely rely on seasonality to draw conclusions, but it is always an interesting consideration when combined with other factors.
In our view, there may be further equity market volatility ahead.
(This is not a investment advice and is not recommendation to buy or sell any security).