True Faith
What happens when fundamentals (earnings and valuation) battle with technicals (liquidity, positioning and momentum). Technicals win until they don't. Let's dig in...
I am always reading to learn from the investment greats.
I am a big believer in the idea that while “history doesn’t repeat itself, it rhymes”. Lessons from the past can provide a road map to the future.
As Winston Churchill said, “The farther back you can look, the farther forward you are likely to see.”
Within this context, I always appreciate the wisdom of Charlie Munger, Warren Buffet’s recently deceased investment partner.
Charlie Munger used to tell a story about human nature:
"One of my favorite stories is about the little boy in Texas.
The teacher asked the class, “If there are nine sheep in the pen and one jumps out, how many are left?”
And everybody got the answer right except this little boy, who said, "None of them are left.”
And the teacher said, “You don't understand arithmetic.”
And he said, “No, teacher. You don't understand sheep.”"
While it hasn’t paid to stray from the pack, at some point it may.
We are continuing to watch liquidity, fundamentals and sentiment (pretty much our holy trinity) to help us understand markets and guide our portfolios.
1. Q1 Earnings
With 4 days (including today) left in the quarter and the S&P 500 up slightly more than 10%, I thought I would once again check in on earnings.
I will cut to the punch line:
Both the number and percentage of S&P 500 companies issuing negative earnings guidance for Q1 2024 are higher than average.
While this isn’t necessarily bearish, it is an interesting juxtaposition with the strength in the market.
As of last Friday, 111 companies in the index had issued earnings guidance for Q1 - 78 have issued negative guidance and 33 have issued positive guidance.
The number of companies issuing negative guidance is above the 5-year average (58) and above the 10-year average (62).
The percentage of S&P 500 companies issuing negative guidance for Q1 is 70% (78 out of 111), which is also above the 5-year average of 59% and above the 10-year average of 63%.
Companies could simply be “lowering the bar” only to exceed in when earnings are announced (in 3 weeks).
From January 5 to March 21, Q1 earnings expectations have come down from $56.35 to $54.86 (-2.6%) while Q4 earnings expectations have moved higher from $64.06 to $65.15.
As we have pointed out in the past, essentially analysts have lowered near-term expectation will raising future expectations with the net impact of keeping full year 2024 expectations relatively stable ($242.57).
(This is not a recommendation to buy or sell any security, it is not investment advice).

Source: FactSet. Through year-to-date 2024.
2. Strong Markets Often Foreshadow Strong Markets
While we have continued to question parts of the fundamental foundation of the current rally (chart 1), we have tried to reiterate our message of participate but be mindful.
Within our portfolios, we have bought puts and put spreads (options strategies that pay off if the market moves lower) where appropriate. While they have been a slight drag on performance, they have allowed us to invest more aggressively than we otherwise might knowing that we have some downside protection.
Despite our sometimes cautious tone, we see the possibility of a normal (5-10%) correction within the context of market that, in our view, will likely move higher through the end of year. (We have focused 5500 as our year-end upside target).
Why will it move higher?
Liquidity - we have highlighted the stealth liquidity that we believe has existed over the past year.
With last weeks announcement of that the Fed will likely slow the reduction of its balance sheet (tapering QT) and forward guidance of rate cuts (despite firm data), liquidity will likely continue.
Investor mis-positioning - the rally of the last 15 months has not been trusted or embraced. We write about the reasons why nearly daily. We see investors continuing to try to “catch-up” either in performance or in allocations.
Do benchmark long-only managers have the right allocation to Nvidia? (We wrote about this in chart 5 here).
Momentum - momentum is the most persistent factor in markets (not valuation, return on equity, size (small vs. large), sales growth, sector or style (value vs. growth).
Markets that go up often keep going up and markets that go down often keep going down.
The chart below shows how the S&P 500 has done in the final 9 months of the year after it has had a positive November, December, January, February and March.
In our experience, a significant move lower (more than 10%) in equity markets is often either caused by a change in liquidity (this is related to inflation and 10-year yields) that will compress valuation multiples or a big drop in earnings expectations.
As described in Chart 1, despite lower estimates for Q1 earnings, full year expectations have remained stable. Furthermore, 2025 S&P 500 expectations (which we have continually referenced for our year-end target) have drifted slightly higher since January (from $274.41 to $275.97).
(This is not a recommendation to buy or sell any security and is not investment advice. Past performance is not indicative of future results).

Source: TradingView. Through year-to-date 2024.
3. Why Healthcare Underperformance is a Good Thing
Looking at the chart below - that shows the performance of the Healthcare Sector relative to the S&P 500 - it is hard to believe that the Healthcare Sector itself made a new all-time high a month ago and is still trading near that level. (We showed this in chart 3 here).
Let’s unpack both of these:
The Healthcare Sector made a new all-time high. After trading in a sideways range for nearly 3 years - from April 2021 to early February 2024 - the Healthcare sector made a new all time high in late February.
Over the past month, the Healthcare Sector has been trading near the levels of the new all-time high, but, importantly all of the action has taken place 2-3% above the April 2021 to February ceiling level.
We often write about a price moving “meaningfully” above or below an important ceiling or floor.
After moving to a new-all time high and consolidating at a level above the prior ceiling level for a month without revisiting the ceiling level to us seems meaningful.
We view the new all-time high in healthcare as bullish.
We can consider it a part of expanded participation in an bull market and a new member of what we have referred to as the “everything rally.”
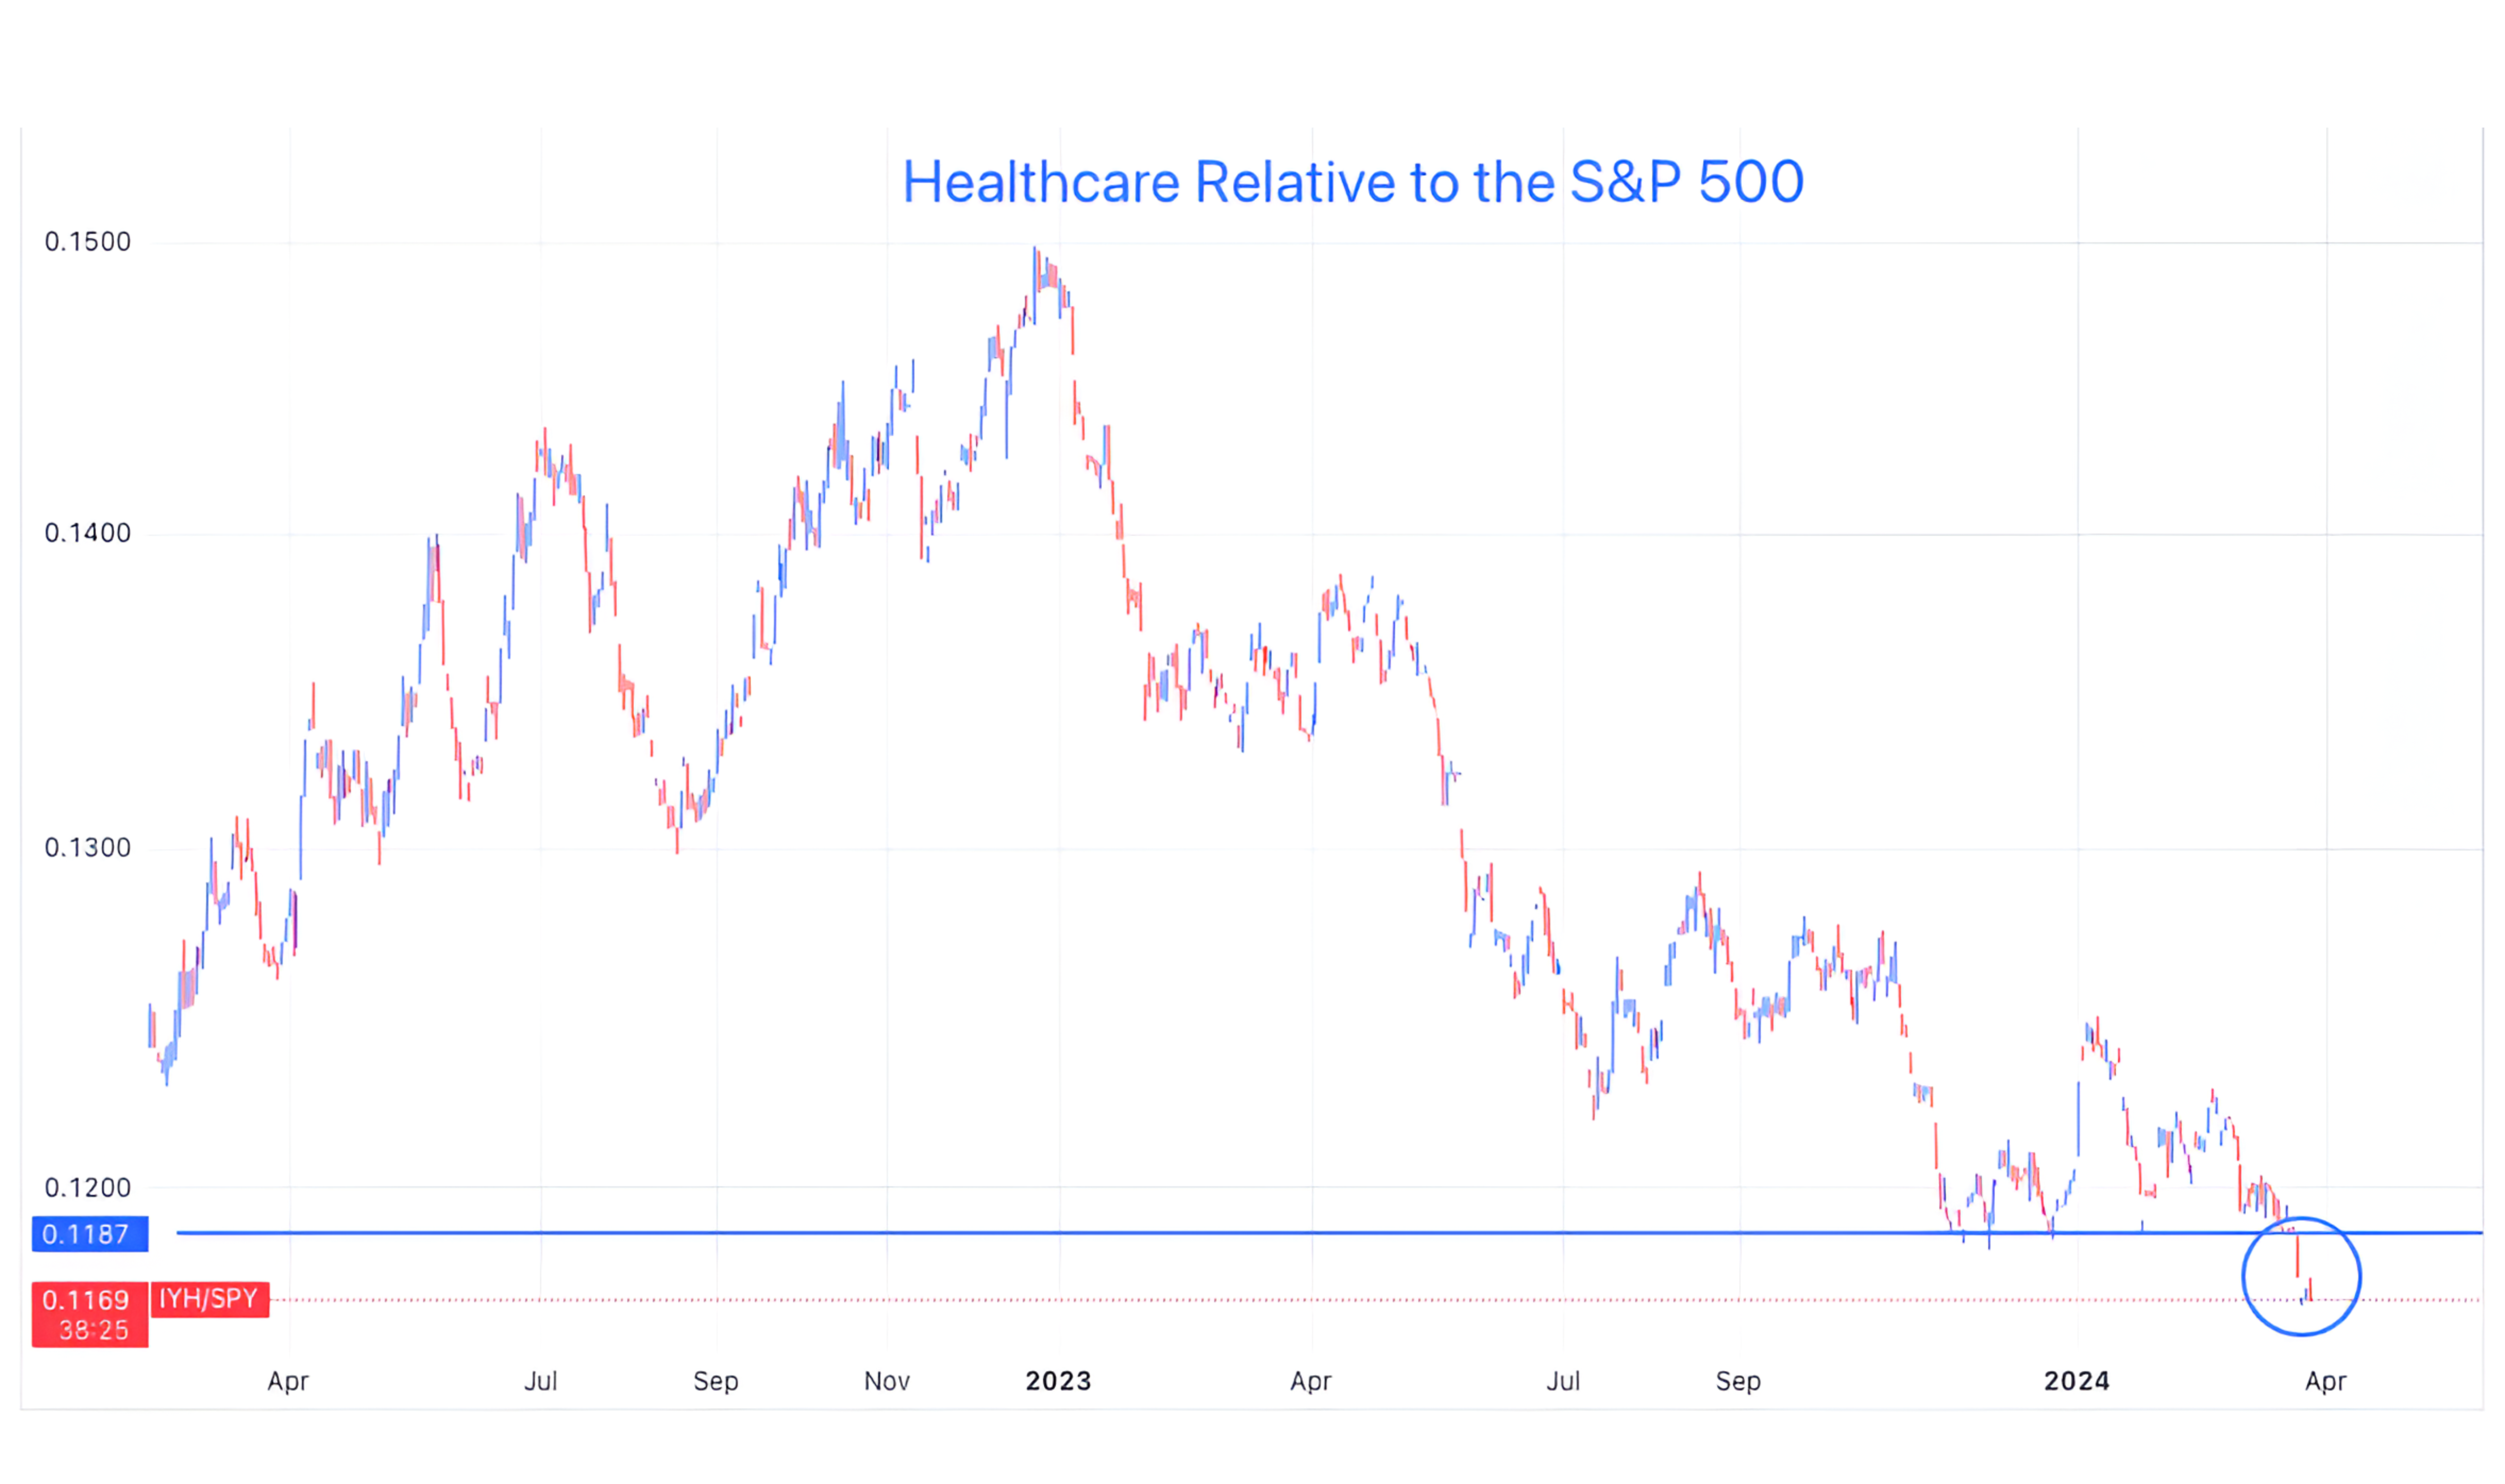
The Healthcare Sector has Made a Recent Relative Low. (Chart below).
Healthcare is a defensive sector. It typically leads when equity investors are worried about the economy and / or the market.
On the chart below, we can see Healthcare outperforming in 2022. That was a difficult period for the S&P 500 overall.
2023 was a great year for equities and Healthcare underperformed for nearly the whole year.
We don’t want to see Healthcare outperforming, but we want to see it performing well.
This is exactly what’s happening now and its bullish.
(This is not a recommendation to buy or sell any security).
Source: TradingView. Through year-to-date 2024.
4. Efficient Markets?
One of those debates that people in business school have is whether markets are efficient.
The so-called Efficient Market Hypothesis (2nd day of finance 101) states that stocks always trade at their fair value, making it impossible for investors to purchase undervalued stocks or sell stocks at inflated prices. As a result, according to the hypothesis, it is not possible to outperform the overall market consistently through stock selection or market timing.
The Efficient Market Hypothesis is seen at the cornerstone for modern financial theory.
However, as I often like to say, the difference between theory and practice is that in theory, they are both the same.
In other words, I do not believe markets are efficient.
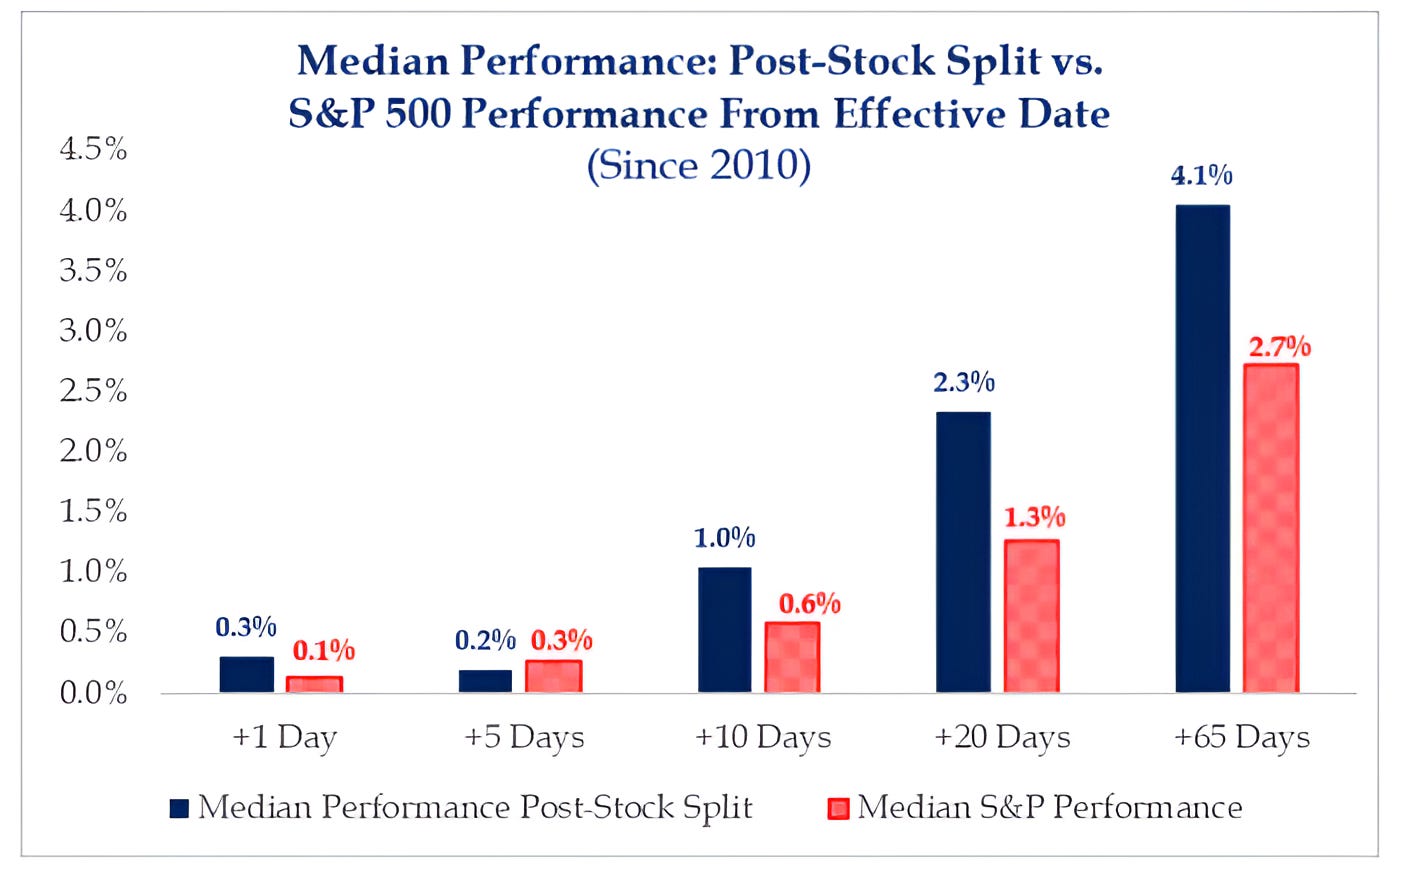
To that end, I present the chart below.
Since 2010, 3 months after a stock-split (65 days), there has been a significant difference in performance between those shares that have split and the S&P 500.
In an “efficient” market, total market capitalization would not vary based on share price and shares outstanding (the two factors in a market capitalization equation that are both impacted by a share split).
There are a number of high profile companies with share prices nearing or above $1,000 that have been speculated to be split candidates.
Food for thought.
(This is not a investment advice and is not recommendation to buy or sell any security).
Source: Strategas. Through year-to-date 2024.
5. Checking in on the Dollar
Although we are equity investors, we believe many of the drivers of clues for the direction of equity markets can be found in fixed income and currencies.
We consider these assets imperative to keep on our radar as early warning or conversely opportunity signals. (This is why we write about them so often).
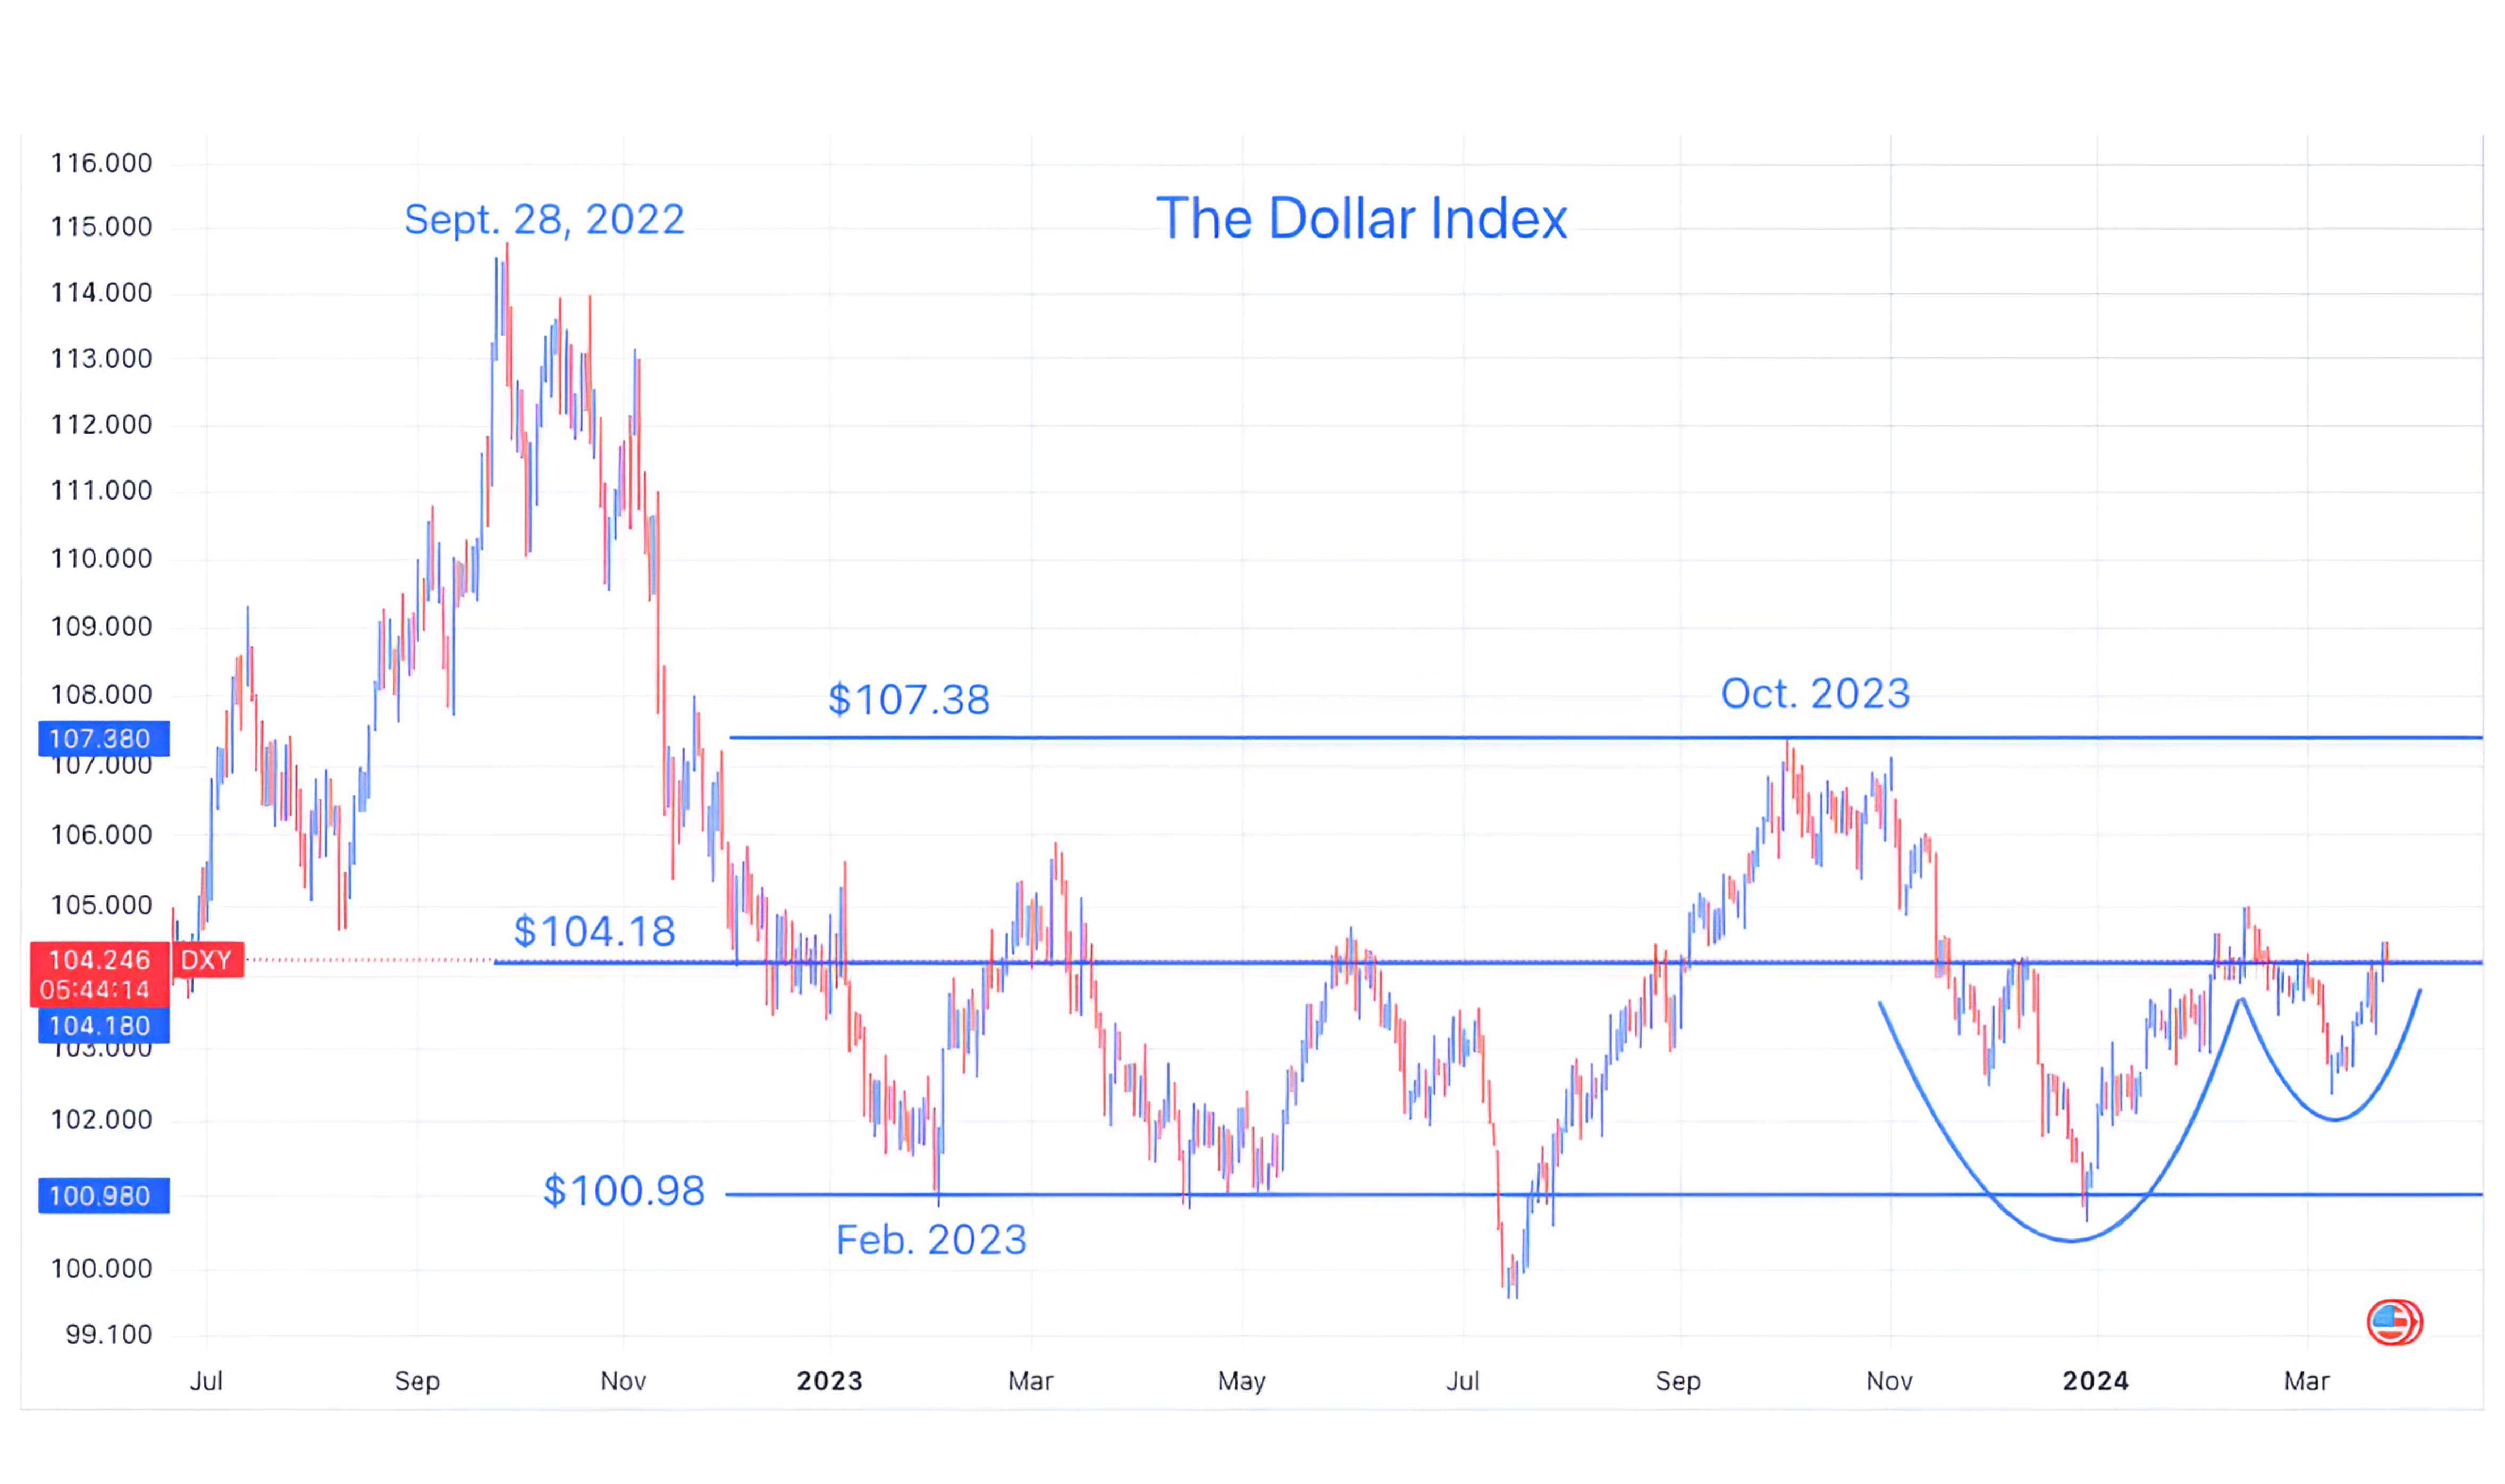
The dollar and the S&P 500 often have a converse relationship. (Past performance is not indicative of future results).
The dollar began to weaken from its 3-year peak at the end of September 2022. The S&P 500 had its 3-year low in mid-October 2022.
When the dollar strengthened from July to October 2023, the S&P 500 corrected (went down).
With that in mind, we are watching closely as the dollar is probing the $104.18 level that has been a ceiling at times and a general battleground over the past 30 months.
If the dollar were to move above the $104.18 level, based on our simple symmetric view of price movement, we believe it could move back to its October 2023 high.
If it does it might put some pressure on equity markets like it did the last time it moved there.
(This is not a investment advice and is not recommendation to buy or sell any security).