


Bad Moon Rising
Equities have rallied on earnings (see below), but haven't recovered from the recent sell-off. With the Fed this week, Yen sell-off and high 10-Year Yields, challenges could be ahead. Let's dig in...
I will start this week with a caveat, I can often be overly cautious when it comes to the economy and markets.
As Stanley Druckenmiller once said, “I'm constantly fighting my bearishness about the world... I know, therefore, that if you have a bearish bias, you have to be very aware of it. You have to work around it. And I always have.”
Since launching this publication, despite our questions about the fundamental and macro backdrop and our early contrarian views that the Fed would likely be tighter than consensus was pricing (here) and 10-Year Yields would be higher, we have been careful to remain invested (albeit with hedges) and consistent in our outlook for 5500 as a year-end S&P 500 target. (See chart 3 here).
In considering the possibility (above average likelihood, in our view) of a near-term sell-off, we are taking into account a) the technical set-up of the market including sentiment as investors, over the past 7 months have been conditioned to buy every small market drop; b) valuation - elevated, particularly when considering the 10-Year yields, inflation and change in Fed posture; c) fundamentals, that have not been that impressive in our view and; d) seasonality - this is the time during US Presidential election years that have historically experienced volatility (here and here).
We still see 4800 as a near-term (next month, maybe sooner) possibility on the S&P 500; however, rather than being overly cautious and reducing our equity allocation, we have reloaded our put and put spread positions.
If, over this week, as earnings, the Fed, PMIs and employment come out and the S&P 500 trades convincingly over its 50-day moving average (currently 5126), we may consider rescinding our cautious call. As always, we will watch our under the surface sub-indicators.
(This is not investment advice).
1. A Potentially Challenging Technical Set-Up

Source: TradingView. Through year-to-date 2024.
In late February, the Nasdaq 100 Equal Weight ETF began to fight to move above its November 2021 high and by mid-March it had achieved victory.
However, as we often write, the real test for any price series is after it has moved through an important level (such as a previous all-time high) and revisits from the other side.
Looking at the chart above, it’s easy to see that the Nasdaq 100 Equal Weight ETF essentially collapsed when it revisited its November 2021 all-time high level from the north.
It is as if there were a lot of buyers (and holders) from November 2021, who finally had made it back to even after two and half years and, when the Nasdaq 100 Equal Weight 100 began to reverse those gains, those buyers and holders collectively said, “we’re out.”
The good news is that this is how the market “cleanses” itself of weak holders, those owners of equities will low conviction - and builds a stronger base.
The bad news is - from a technical standpoint, the Nasdaq 100 Equal Weight Index could be forming a “head and shoulders” top, that if it were to fully materialize, would target 12% downside from current levels to $104.50.
While a lot needs to happen to go from today’s level to $104.50 given the imbalances we cited in our introduction and similar set-ups across various equity indexes, it needs to be considered.
(This is not a recommendation to buy or sell any security and is not investment advice).
2. Earnings Update

Source: FactSet. Through year-to-date 2024.
As of Friday, 46% of the companies in the S&P 500 had reported results for Q1 2024.
The analysis below is based on FactSet data (that I maintain in a spreadsheet), however, it draws different conclusions than the FactSet analysis (they provide commentary).
I trust my analysis more than theirs as I have noticed inconsistency in their calculations. I provide this explanation in case you read different numbers elsewhere and I am happy to provide all backup for my analysis.
The most significant difference, is that I continue to read that earnings season is better than expected.
Based on my data (which is FactSet data, but somehow my analysis here differs from theirs), the Q1 S&P 500 earnings estimated has consistently been declining.
The current estimate for Q1 2024 S&P 500 earnings as of April 26 is $54.25.
On April 5, at the end of the quarter, but before earnings season, the Q1 earnings estimate was $54.85. In mid-February (the middle of the quarter), the estimate was $55.28 and at year-end (the beginning of the quarter, the expectation was $56.35.
In my data, I can’t find a time that aggregate Q1 S&P 500 earnings were expected to be lower.
While individual companies have exceeded earnings expectations, the index has not and any “beat expectations” or “better than expected” headline to characterize the results in my view, is inaccurate.
Currently, Q1 S&P 500 earnings growth, considering those companies that have reported and the estimates for those that have not, is estimated to be 1.7%.
Whenever we consider year over year growth, we need to remember what happened a year ago. Looking at the chart above Q1 2023 earnings were not good and came in 1.4% below those of 2022.
What this means in terms of raw earnings is that the current expectation for Q1 2024 S&P 500 earnings of $54.25 are up less than $1 from $53.34 in 2023 and just slightly ahead of the $54.09 earned in Q1 2022.
All of that said, we always want to look forward rather than back, particularly with earnings.
During Q1 earnings season, Q2 expectations have remained strong. Growth is expected to be +9.2% growth and absolute earnings have moved up slightly from where they were at the beginning of the quarter.
The current confidence in the outlook for the Q2 and the rest of the year is the fundamental foundation that, in our view, is supporting the market.
While expectations continue to look overly enthusiastic to us, we would be happy to be proven too conservative.
Based on the current estimates and Friday’s closing price of nearly 5100 on the S&P 500, the index trades at a valuation of 21.0x and 18.4x, 2024 and 2025 earnings, respectively.
(This is not a recommendation to buy or sell any security and is not investment advice. Please do your own due diligence).
3. One More Earnings Detail…

Source: Bloomberg. Through year-to-date 2024.
Based on Bloomberg’s earnings expectations (different from those of FactSet), the Q1 earnings, based on actual earnings from those companies that have reported and expectations for those that have not, are 58.1% higher than at their nadir in November 2022.
Meanwhile, earnings for the 493 companies in Bloomberg’s Large-Cap 500 excluding the Magnificent Seven are on course to come in 8.4% below the estimate from that same date.
Essentially, all of the earnings growth (and then some) in the S&P 500 over the past two years has come from the Magnificent 7.
Ed Clissold, chief US equity strategist at Ned Davis Research, points out that consensus estimates, call for the Magnificent 7’s earnings to grow 37% in 2024 versus 1% for the other 493 companies.
The challenge with this, in our view, is that a significant portion of this is likely priced in.
After Q4 Nvidia earnings, we wrote about a $30 2025 estimate (with a 30x multiple). Are the earnings expectations going to expand? Maybe. Is the multiple going to expand - given potentially slowing growth, competition, etc. unlikely.
We can get to $1150 or $1200 on Nvidia if we move to $35 to $40 in earnings and maintain the 30x multiple, but at that point we are likely considering 2026 earnings. (See here).
Similarly, last week, with Meta’s (Facebook’s) earnings, we wrote about $25 in 2025. Currently, the stock is in the “penalty box” as it’s one year of expense discipline seemed to be the exception rather than the rule. (See the Year of Inefficiency here).
While in the “penalty box,” Meta is trading at 18x 2025 estimated earnings of $25. Can it go to 20x yes, but much higher is unlikely.
This is really to say, that yes, Magnificent 7 earnings are continuing to grow, but investors, ourselves included, are already pricing in 2025 expectations.
At this point, it does not appear that there is much more juice to squeeze from the orange.
The other 493 need to take the baton and grow earnings or else it will be increasingly difficult to justify further significant upside.
(This is not investment advice or a recommendation to buy or sell any security).
4. Checking in on the 10-Year Treasury Yield

Source: TradingView. Through year-to-date 2024.
Other than the S&P 500, there may be no other chart that we have showed more often than that of the 10-Year Treasury yield (most recently here, here and here).
Looking back at the last three times we showed the 10-Year Treasury, it was forming the potential right shoulder of an “inverse head and shoulders” pattern (the 3 arcs on the right side of the chart) on March 21 (similar but opposite to what the Nasdaq 100 Equal Weight ETF may be doing); moving up to the neckline at 4.34% on April 1; and approaching our 4.65% target on April 11.
On February 12, we presented a survey of investors (chart 2 here) that showed nearly 80% of participants at a Goldman Sachs Global Strategy Conference expected 10-Year yields to end 2024 below 4%.
At the time, 10-Year Treasury yields were 4.17% and our view was there was a risk of 5.00% which was not being priced in.
As the 10-Year Treasury Yields fighting with our “head and shoulders” target level of 4.65%, although we see the possibility of a pause or even slightly lower yields, in our view, 5.00% continues to be a possible likely destination.
At some point, we believe that elevated and rising 10-Year US Treasury yields will will matter to equities like they did from August to October last year.
While valuation hasn’t been a concern (or even on the radar) for most equity investors in 2024, typically, higher 10-Year Treasury yields are negatively correlated with equity valuations for 2 specific reasons:
In a discounted cash flow valuation model, 10-Year US Treasury yields are often used as the “risk free rate” to “discount” future cash flows.
While we will not go into the calculation, higher 10-Year Yields, all else equal, leads to lower discounted cash flow valuations (at least on paper). Lower valuations are often expressed in equity markets through PE multiple contraction.
In an “equity risk premium” analysis, we compare the equity yield (the inverse of the PE ratio —> a PE of 20 = 1/20 = 5%; whereas a PE of 10 = 1/10 = 10%) with the Treasury Yield.
The concept is that equity investors should receive some premium for taking equity “risk.”
During the late 1990s, the Equity Risk Premium was negative (the earnings yield on equities was lower than the 10-Year Treasury yield). Alan Greenspan (in 1996) referred to this as irrational exuberance.
The current forward PE of the S&P 500 is 21.3x. The current earnings yield (1/21.3) is 4.7%. With the 10-Year Yield at 4.5%, Equity Investors are receiving 0.2% to take equity risk. Historically, this is low and below the long-term average.
Whereas PE levels are an absolute valuation measure, equity risk premium is a relative valuation metric - are equities expensive relative to the (less risky) fixed income? Currently, they are expensive.
(This is not a recommendation to buy or sell any security, please do your own research).
5. Fiscal Dominance in a Chart
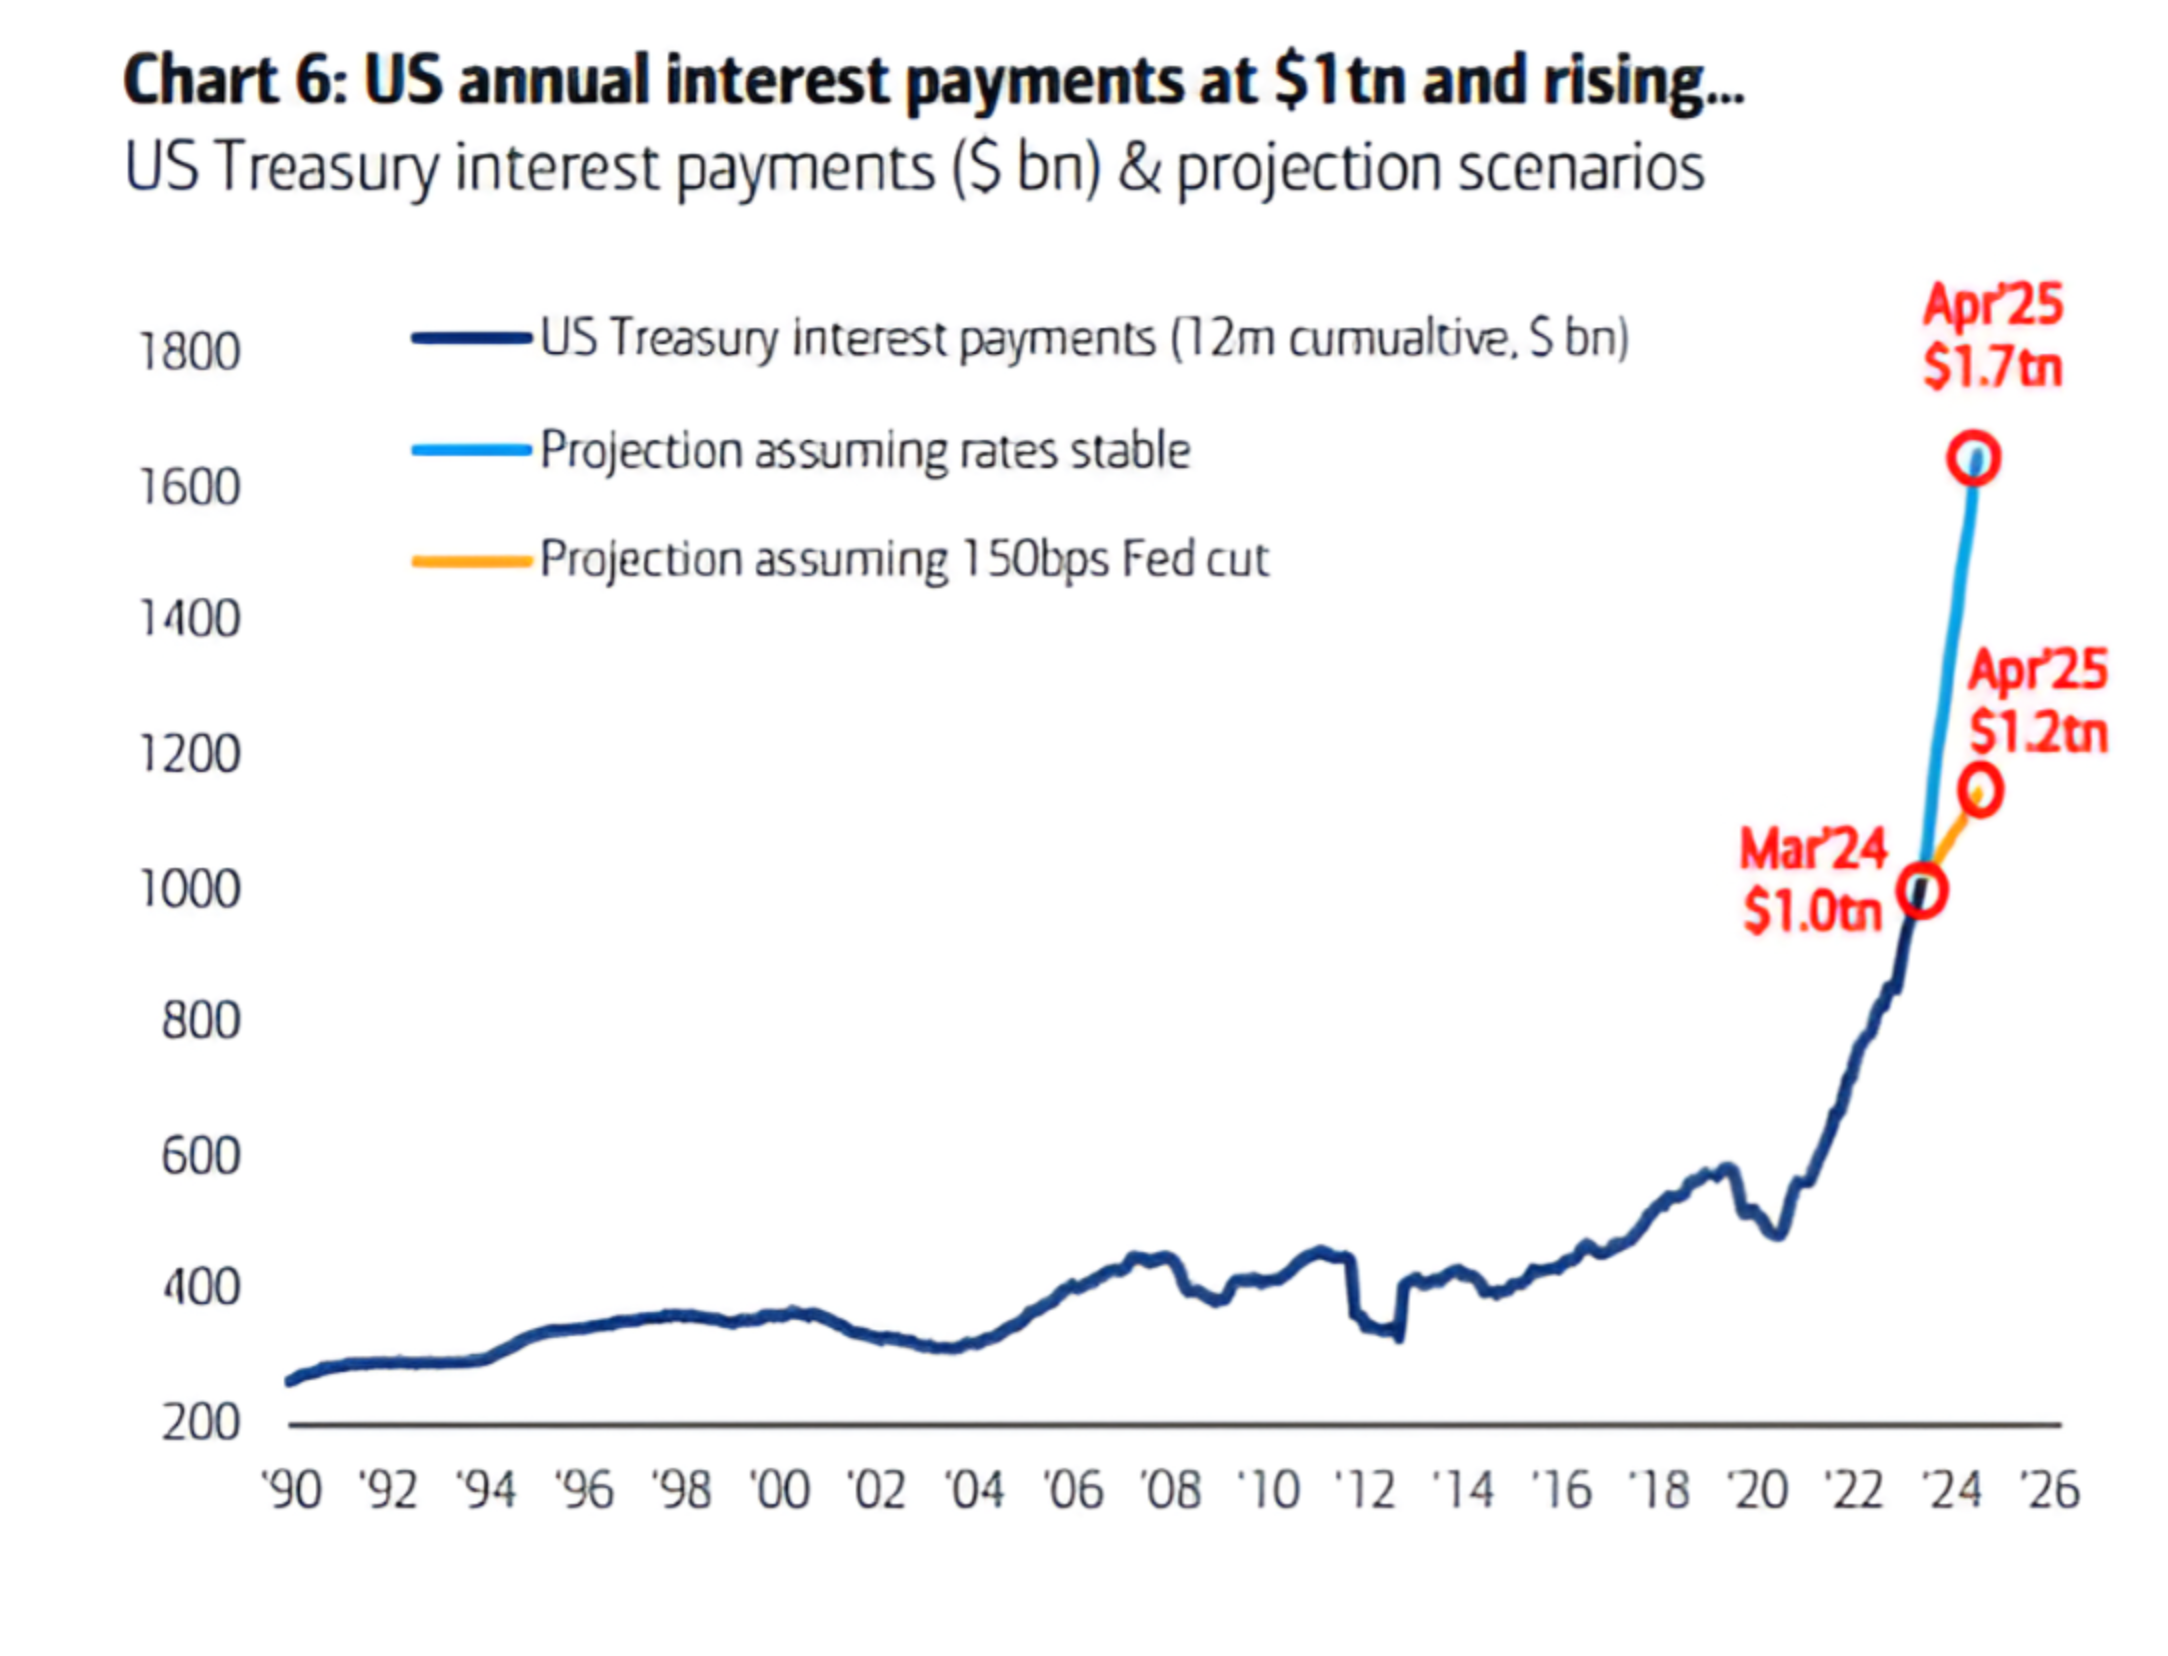
Source: Bank of America. Through year-to-date 2024.
As we highlighted here one of our recent themes has been the idea of Fiscal Dominance in the US.
Fiscal Dominance is the idea that government debt outstanding and interest payments are so great that they impact central bank policy decisions.
Taken in isolation, we believe that in most environments, inflation of around 3% and trending higher (depending on the measure, what’s excluded etc.), tight employment and equities near an all-time high would lead to conversation about tightening monetary policy rather than easing it.
In the chart above from Bank of America, it is easy to see the difference in interest payments ($500 billion) over the next year if the Fed made the 6 0.25% rate cuts (a total of 1.5% or 150 basis points) that were expected in January.
Could this be one of the factors that has led to the Fed’s easing bias?
While it is difficult to know, the factors behind the chart above will likely continue to become a significant part of Fed, Treasury and fiscal decision making going forward.
It is obvious to say that in a fiscal deficit environment, those additional $500 billion will be paid for with additional debt.
In our view, at some point, the “bond vigilantes” will begin to require greater yields to finance the ever growing debt burden of the US.
In other words, if this thesis is correct, the 5% level on the 10-Year Treasury yield chart above will be a pit stop on the way to something higher.
While this is more of a risk than a prediction, it is difficult, given the current scenario, to envision 10-Year Yields below 4% as the majority of Goldman Sachs Strategy Conference participants did two and half months ago.
All of that said, I am reminded of one of the first charts we presented this year (here) that shows its the “un-inversion” when 10-Year Yields are once again greater than 2-Year Yields that equity investors need to watch.
As we wrote then, “In each instance that the curve has become inverted over the past 45 years, the low in the S&P 500 has occurred once the curve has re-steepened. (Past performance is not indicative of future results).”
A spike in 10-Year Yields should it occur and an un-inversion of the yield curve would likely be a warning to equity investors.
(This is not a investment advice and is not recommendation to buy or sell any security).