


Losing My Religion
"Efficiency" and AI led the Magnificent 7 higher in 2023. There has been no more clear example that 2024 is not 2023 than last night's Meta (Facebook's) earnings call. Let's dig in...
1. 2024 is Not 2023: Technology Relative to the S&P 500

Source: TradingView. Through year-to-date 2024.
On March 15 (6 weeks ago), we began to highlight the underperformance of the Technology sector. (here)
At the time, we made three points that are worth remembering reiterating:
As the Technology sector is cap weighted and therefore over-emphasizes names like Microsoft, Apple and Nvidia, we need to begin to consider the next leg of AI. (We wrote about this here and here). We believe that this will favor smaller software, analytics and data-oriented companies that have a lower-weight in the Tech sector.
Cyclical value sectors such as Energy and Materials are likely worthy of consideration in portfolios.
We have characterized our current equity portfolio allocation as a barbell of AI 1.1 and 2.0 (the next leg of AI) and cyclical value exposure including Energy, Materials, Industrials and Financials.
This is not the 2023 market that was being dominated by the Magnificent 7. The character of the market and the drivers of performance seem to be changing in 2024 and we need to be sure to recalibrate.
Looking at the chart above, it is important to recognize what we have characterized as “institutional memory” in markets - the idea that the relationship between Technology shares and the S&P 500 peaked in January 2024 at nearly the exact same level as the March 2000 peak. We called this a good place to pause (here).
With that in mind, we wouldn’t be surprised to see Technology relative to the S&P 500 move back down to the August level of the relationship.
What would this mean?
It would mean that Apple, Microsoft, Nvidia and others underperformed (not necessarily moved down) other parts of the market.
Despite the fact that we highlighted the Utility (defensive value) sector yesterday and questioned what its recent positive performance means, we are not negative on equities (we still see upside to 5400 in 2024), we view the current period as a correction that we will use to emphasize our favored sectors and names. If this view changes, you will know.
(This is not a recommendation to buy or sell any security and is not investment advice).
2. The Year of Inefficiency: Meta (Facebook)
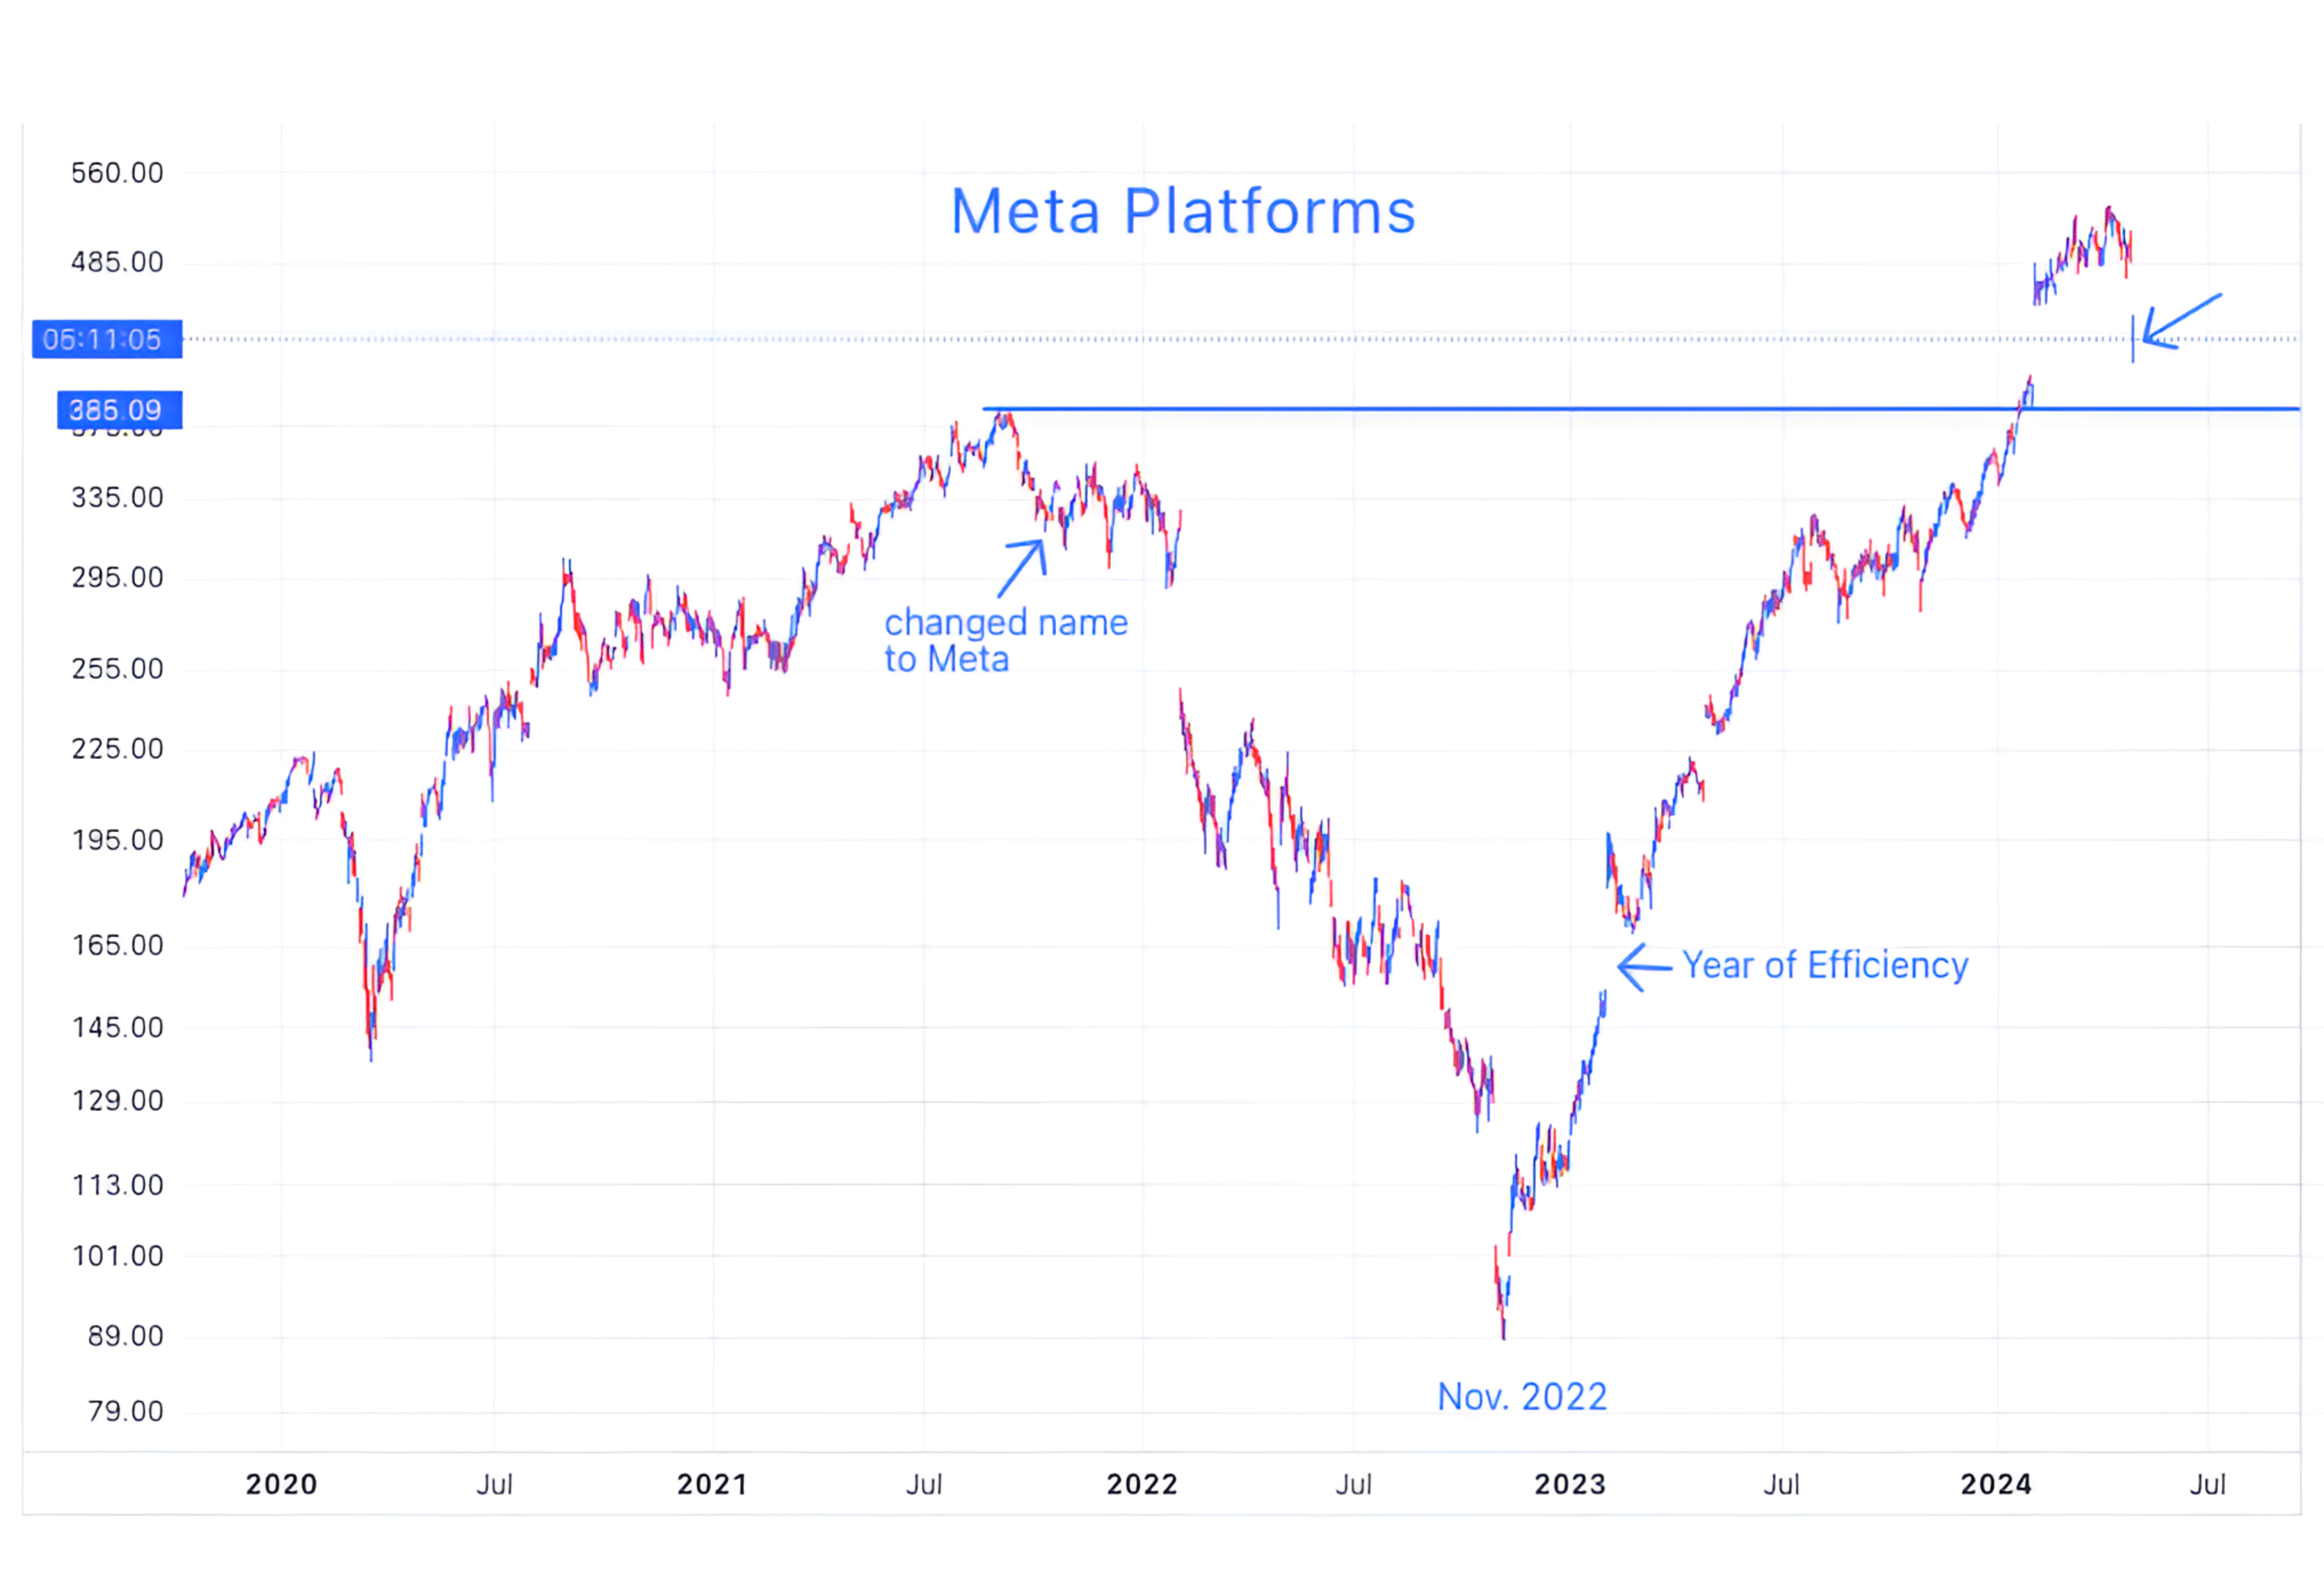
Source: TradingView. Through year-to-date 2024.
In late 2021, to emphasize its dedication to the Metaverse, Facebook changed its name to Meta Platforms.
On the chart above, it is easy to see investors begin to question the move as shares traded sideways after the announcement.
Although many recognize Facebook’s acquisition of Instagram for $1 billion in 2012 as one of the best purchases in terms of value creation, Mark Zuckerberg, Meta’s founder and CEO, was as, if not, more focused on the company’s 2014 acquisition of Oculus, the augmented and virtual reality (AR / VR) company.
Zuckerberg’s vision is that the next “platform” after the desktop and the mobile phone would be the metaverse.
The company that controlled the platform (like Microsoft on the desktop or Apple iOS / Google Android on phones) could exert control and extract profitability.
In its Q4 2021 conference call (in February 2022), Meta missed revenues and earning targets and announced that it would break out its “Reality Labs” division that invests in augmented and virtual reality hardware.
While the earnings miss hurt shares, later in the year, it became apparent that the company intended to spend at least $10 billion a year on metaverse-oriented AR/VR with no path to profitability in the near future.
Investors became increasingly concerned about the expenditures with until November 2022 when Meta announced that it was laying off 13% of its staff. At that point, shares bottomed.
In January 2023, Zuckerberg announced “the Year of Efficiency” based on expense cuts and conservatism and said Meta will be more “proactive in cutting projects that aren’t performing or may no longer be crucial.”
Shares rallied back to their 2021 highs.
In early February, when Meta announced better than expected Q4 2023 earnings along with a dividend and a $50 billion buyback, shares hit a new all-time high. They traded around that level until today.
Last night, on its earnings call basically announced higher spending on Reality Labs (AR/VR) and AI, and lower guidance.
Similar to some of the mid-year 2022 calls, Zuckerberg acknowledged that he didn’t know when the investments in Reality Labs would pay-off (to be fair the AI investments have begun to show results in terms of algorithms and advertising, but the AR/VR side concerns investors).
In other words, the link between investment and monetization is elusive and years away - back to “inefficiency.”
In our view, Meta earnings for 2025 should be around $25 per share.
With shares trading at around $430 today (down from around $500 yesterday), the company is being value at about 17x 2025 earnings.
While we would not be surprised to see shares trade back down to the 2021 high $385, at a valuation of around 15.5x 2025 earnings, Meta shares may be attractive around those levels.
(This is not a recommendation to buy or sell any security and is not investment advice. Please do your own due diligence).
3. A Text Book “Re-Test”: Energy
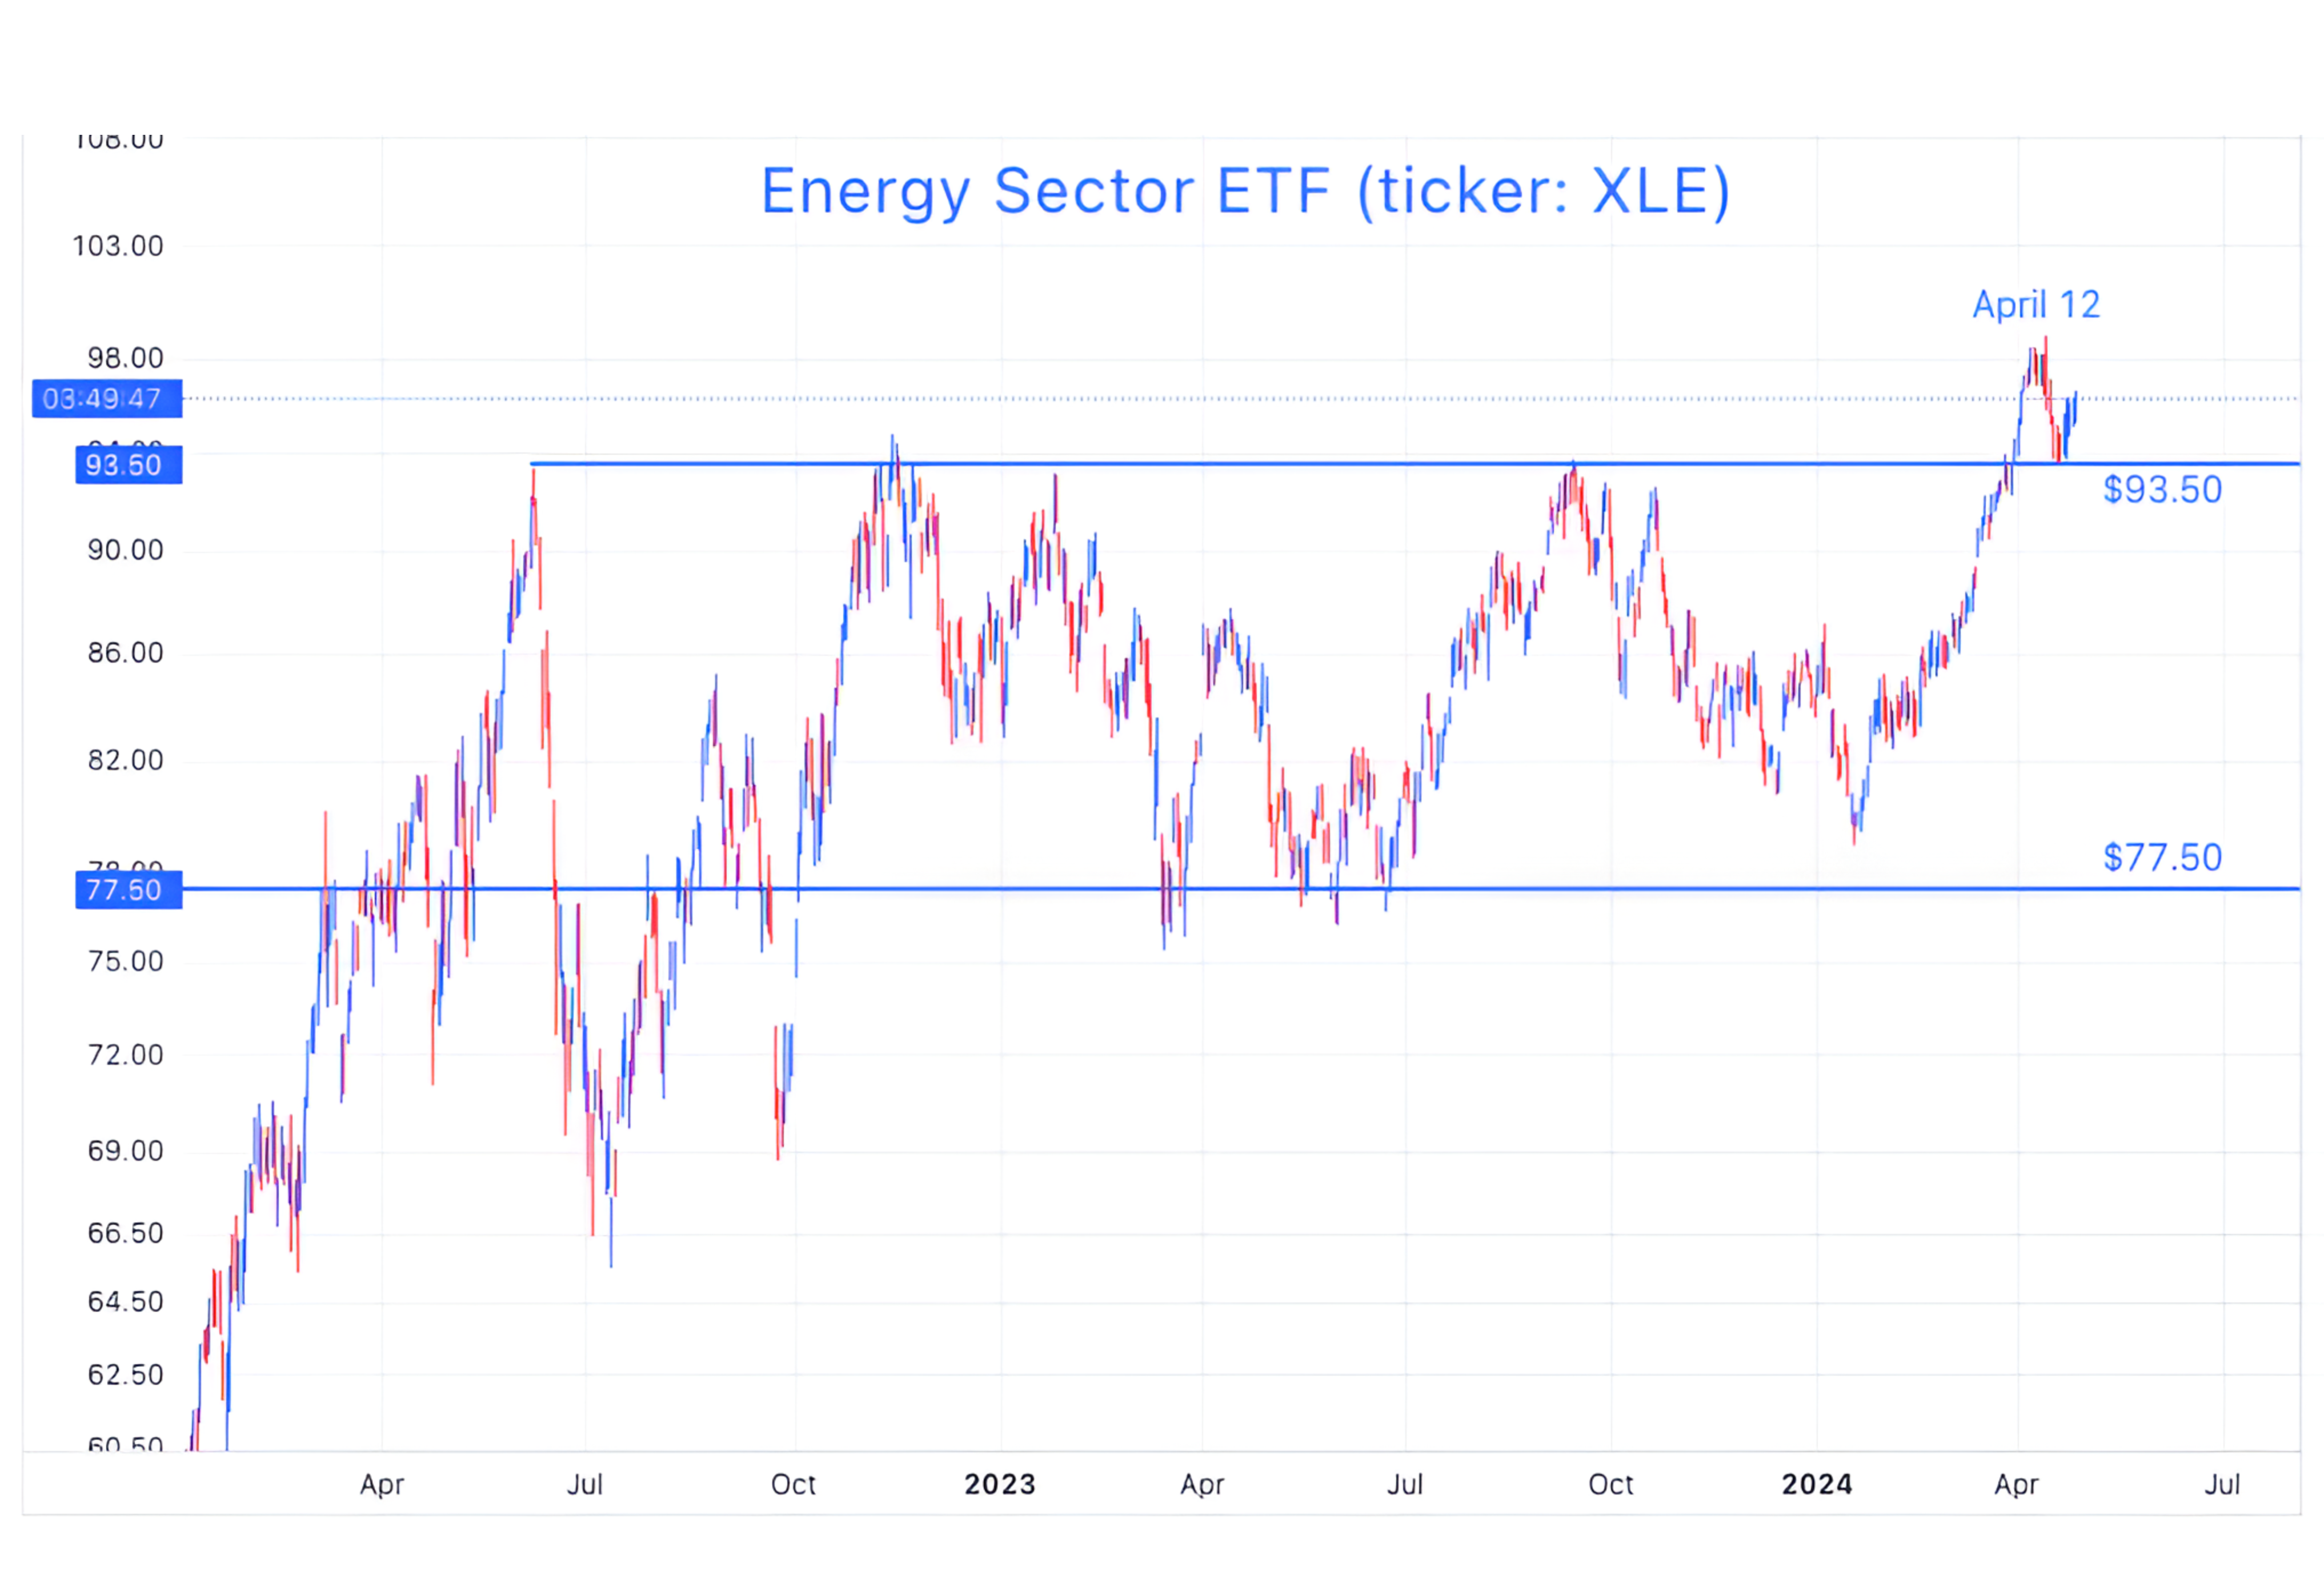
Source: TradingView. Through year-to-date 2024.
After trading sideways for most of 2023, the Energy sector, in late March moved to the north side of its range.
On April 12, the Energy sector hit a new high and, then, with the rest of the S&P 500 began to trade down.
Whenever we see a price move out of a range, we want to see what happens when and if it revisits its former floor or ceiling level.
The Energy sector, to this point, has exhibited a picture perfect “re-test” of its former ceiling level. (Revisit, kiss and bounce).
With prices that have moved sideways in a range for sometime and then move either above or below (see chart 4) the range, we typically use the concept of “symmetry” to establish a potential price target.
In the case of the Energy Sector ETF, given the $16 range ($93.50-$77.50) of the sideways move, we would consider $109.50 as a possible upside target.
We will see how the sector reacts when two of its largest components Exxon and Chevron report earnings tomorrow.
(This is not investment advice or a recommendation to buy or sell any security).
4. Where Do We Go From Here? Apple
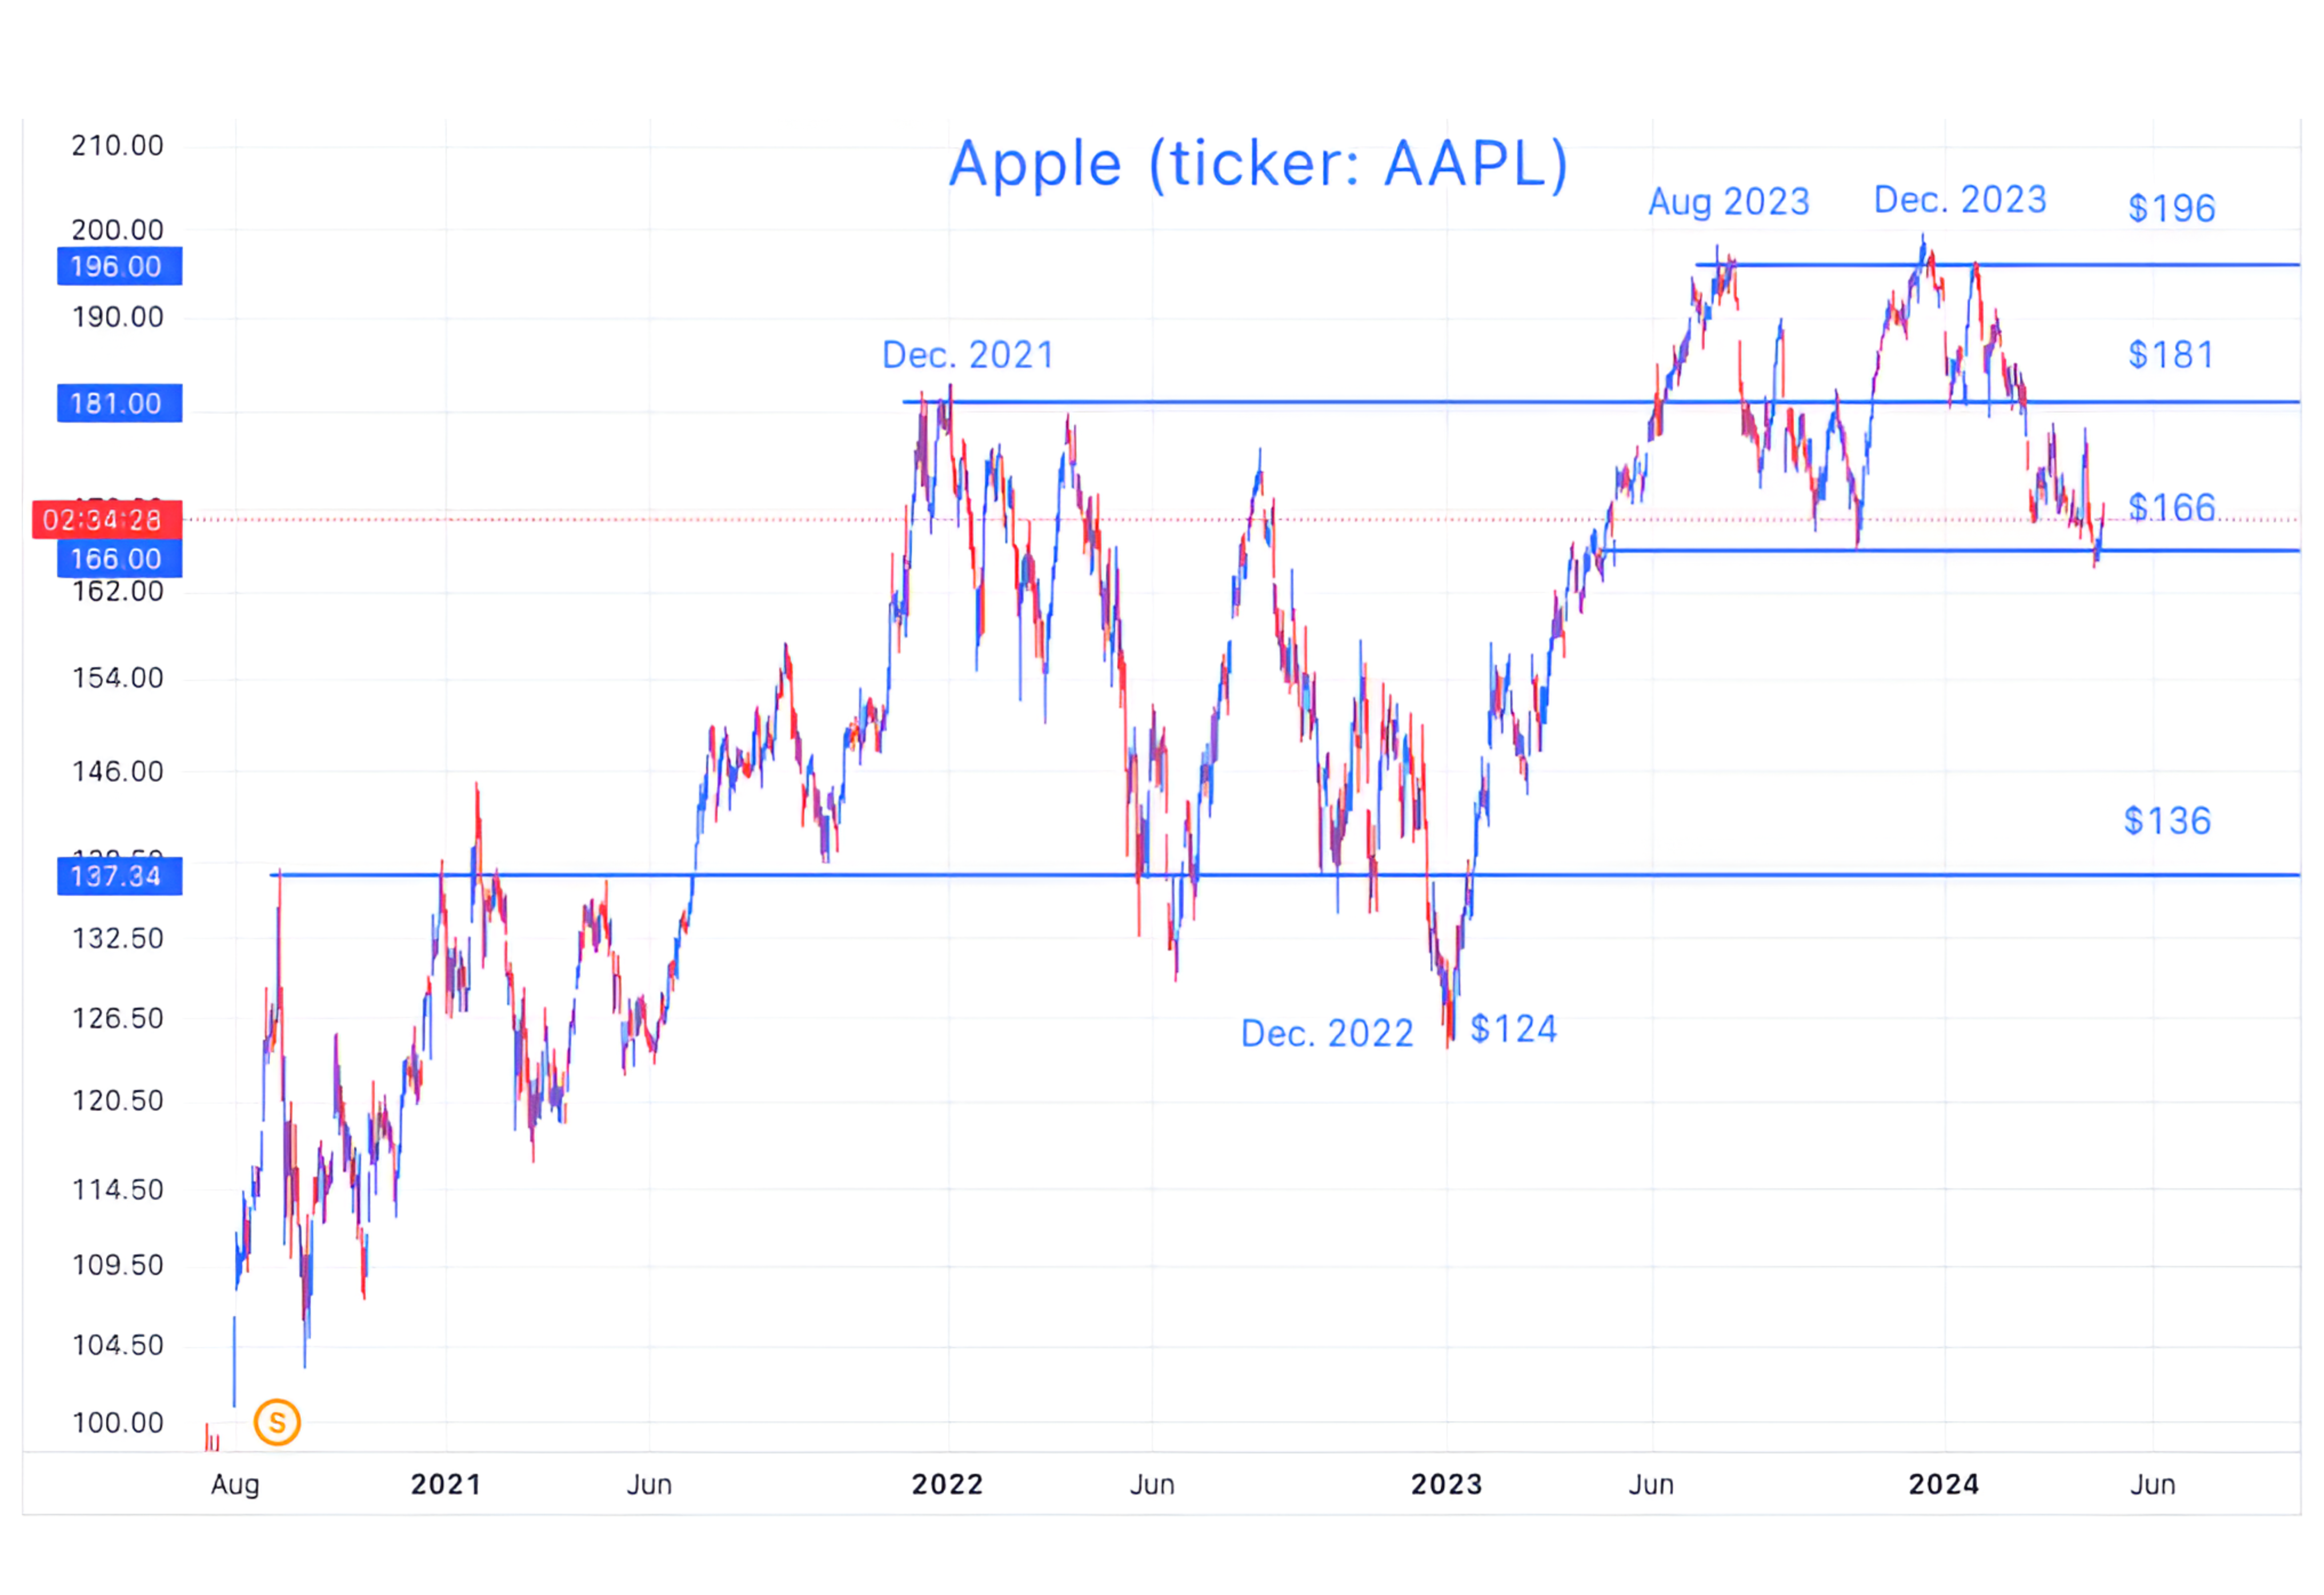
Source: TradingView. Through year-to-date 2024.
We showed Apple shares on March 1 (here).
At the time, we wrote:
“When we consider Apple, we see a great company that has:
Had declining operating earnings over the past two years ($119 billion in 2022, $114b in 2023 and $118b last 12 months) while shares have rallied over 40%;
Launched no recent meaningful new products (the Apple Vision Pro will not move the needle in the near-term);
Borrowed money to buy back shares in order to boost earnings per share (fewer shares with same earnings = greater earnings per share) but this seems to be tapering down;
Expanded its PE multiple to a current level of 28x up from 22x at the end of 2022; and
Lost the biggest buyer of its shares (Berkshire Hathaway was a net seller last quarter - not because of a negative view, but it became too large of a position in the Berkshire portfolio).”
Based on the chart and the $15 range between $196 and $181, we wrote “It is possible (this is not a prediction) that shares could continue trade down to around the $166 level.”
Apple has now hit our downside target and it looks, for the time being, that a broader range between $196 and $166 has been established.
We wouldn’t be surprised to see Apple shares continue to trade within this broad band.
However, if shares were to fall south, we would consider downside symmetry from the $196 - $166 range to highlight the possibility of a $136 target.
One last observation on the Apple chart - Apple tried to retest its December 2021 peak from above two times and failed both times. I wanted to point this out to contrast with the Energy chart above.
(This is not a recommendation to buy or sell any security, please do your own research).
5. Keeping an Eye on EM Equities

Source: TradingView. Through year-to-date 2024.
Often, when US Cyclicals (Energy, Materials, Industrials etc.) do well, Emerging Markets equities also do well.
25% of the EM Equity Index (and ETF) exposure is in China and given recent economic and market volatility in China this has weighed on the EM ETF.
In our view, however, the other 54% of the index is in India (18%); Taiwan (18%); Korea (13%); and Brazil (5%) and these markets have not experience the same issues that have held Chinese equities back.
We believe that if Chinese equities can stabilize (we have suggested that Chinese Internet equities could be an interesting trade here) and the dynamics of the other EM countries remain resilient, that the Emerging Market ETF could be an interesting diversification option.
Notably, the EM ETF is still trading below its pre-covid high and we want to see if it can capture the north side of its 2023 trading range (between the two horizontal light blue lines) before considering an allocation.
(This is not a investment advice and is not recommendation to buy or sell any security).