


May the Odds Be Ever in Your Favor
After a weekend of reading and thinking about this week's Fed meeting, there's a lot to write about. Unfortunately, I can fit it all in today, but this is where we'll begin. Let's dig in...
1. Sentiment Suggesting a Correction Followed by a Rally
The chart below shows the S&P 500 with annotations of the levels of the CNN Fear and Greed Index and the National Association of Active Investment Managers (“NAAIM”) Exposure Index at recent short-term peaks.
We showed this in early February (here) when the CNN Fear and Greed Index (here) was 79 and the NAAIM Exposure Index (here) was at 93.
Looking closely at the chart - the heightened levels in early February were not meaningful.
What we may have failed to appreciate at the time was that after the CNN Fear and Greed Index reading of 80 coupled with the NAAIM level of 103 last December was met with relatively mild volatility, overall investor positioning was more important than sentiment.
When we consider investor positioning, we believe that entering the year:
investors were under-allocated to equities after the surprising (to many) strong performance last year; and
under-positioned to AI related themes. We described this in chart 5 on February 1 (here) and we should have been more respectful of what we had written.
In our view, the heightened sentiment readings may be more significant now than in February as we believe that investors are more allocated (last week had the largest flows into US equities ever) and “more” positioned (they have loaded up on Nvidia and other AI stocks).
Furthermore, we have begun to see cracks in some of the sub-indicators we follow (we showed some of these last week including Staples vs. Discretionary; Small Caps falling a little; Utilities rallying; Regional banks fragile etc.).
In our view, given sentiment, the strength of the 22 week rally, and some cracks “under-the-surface”, the odds favor a near-term pullback.
That said, over the past 15 years when the National Association of Active Investment Managers (“NAAIM”) Exposure Index has moved to over 100, one year later the average S&P 500 return has been 14%. (Past performance is not indicative of future results).
What do we this information?
For some people nothing.
If you are fully invested with a long-term horizon, many of the momentum indicators we follow suggest further upside. We have highlighted our bullish scenario of 5500 on the S&P 500 at year-end.
For those that have cash, there may be a better time to put it to work.
For those that have outsized gains or are more trading oriented, perhaps trim a little and look to buy at lower levels.
(This is not a recommendation to buy or sell any security, it is not investment advice).

Source: Tom the Trader, NAAIM, CNN, TradingView. Through year-to-date 2024.
2. A Good Place to Pause?
Last Friday (in chart 5), we showed an extreme close up view (6 months) of the Technology ETF (ticker: XLK) relative to the S&P 500.
In that write-up, we highlighted that since November, despite the excitement around AI, that Technology had not outperformed the S&P 500.
In other words, if an investor had bought the entire index that includes banks, utilities, energy companies, industrials, retailers, healthcare and a lot of other companies that are not considered growth and won’t benefit from the earliest stages of AI, they would be doing just as well as if they had invested solely in the technology sector.
Below is a very long-term view (25 years) of the same chart.
We often write about “institutional memory” - the idea that there are buyers and sellers of certain securities at certain levels. I try to identify these with horizontal lines and try to highlight “battle zone” areas.
In that spirit, we recently looked at the Japanese Nikkei revisiting its 1990 peak and pausing.
Interestingly, there seems to be considerable long-term institutional memory in the relationship between the Technology Sector and the S&P 500 overall.
It’s notable that the January 25 peak in the relationship occurred nearly at the same level as the March 2000 peak.
In addition, we have drawn in 3 other lines that in our view reflect the long-term institutional memory in this pair.
If the memory from the March 2000 high is similar to that of the other levels that I’ve drawn in, there may be a battle before the Technology sector relative to the S&P 500 establishes a new all-time high.
Importantly, if this were to occur, it would not necessarily mean that the Technology sector would go down, it might just be that other sectors go higher faster.
(This is not a recommendation to buy or sell any security and is not investment advice. Past performance is not indicative of future results).

Source: TradingView. Through year-to-date 2024.
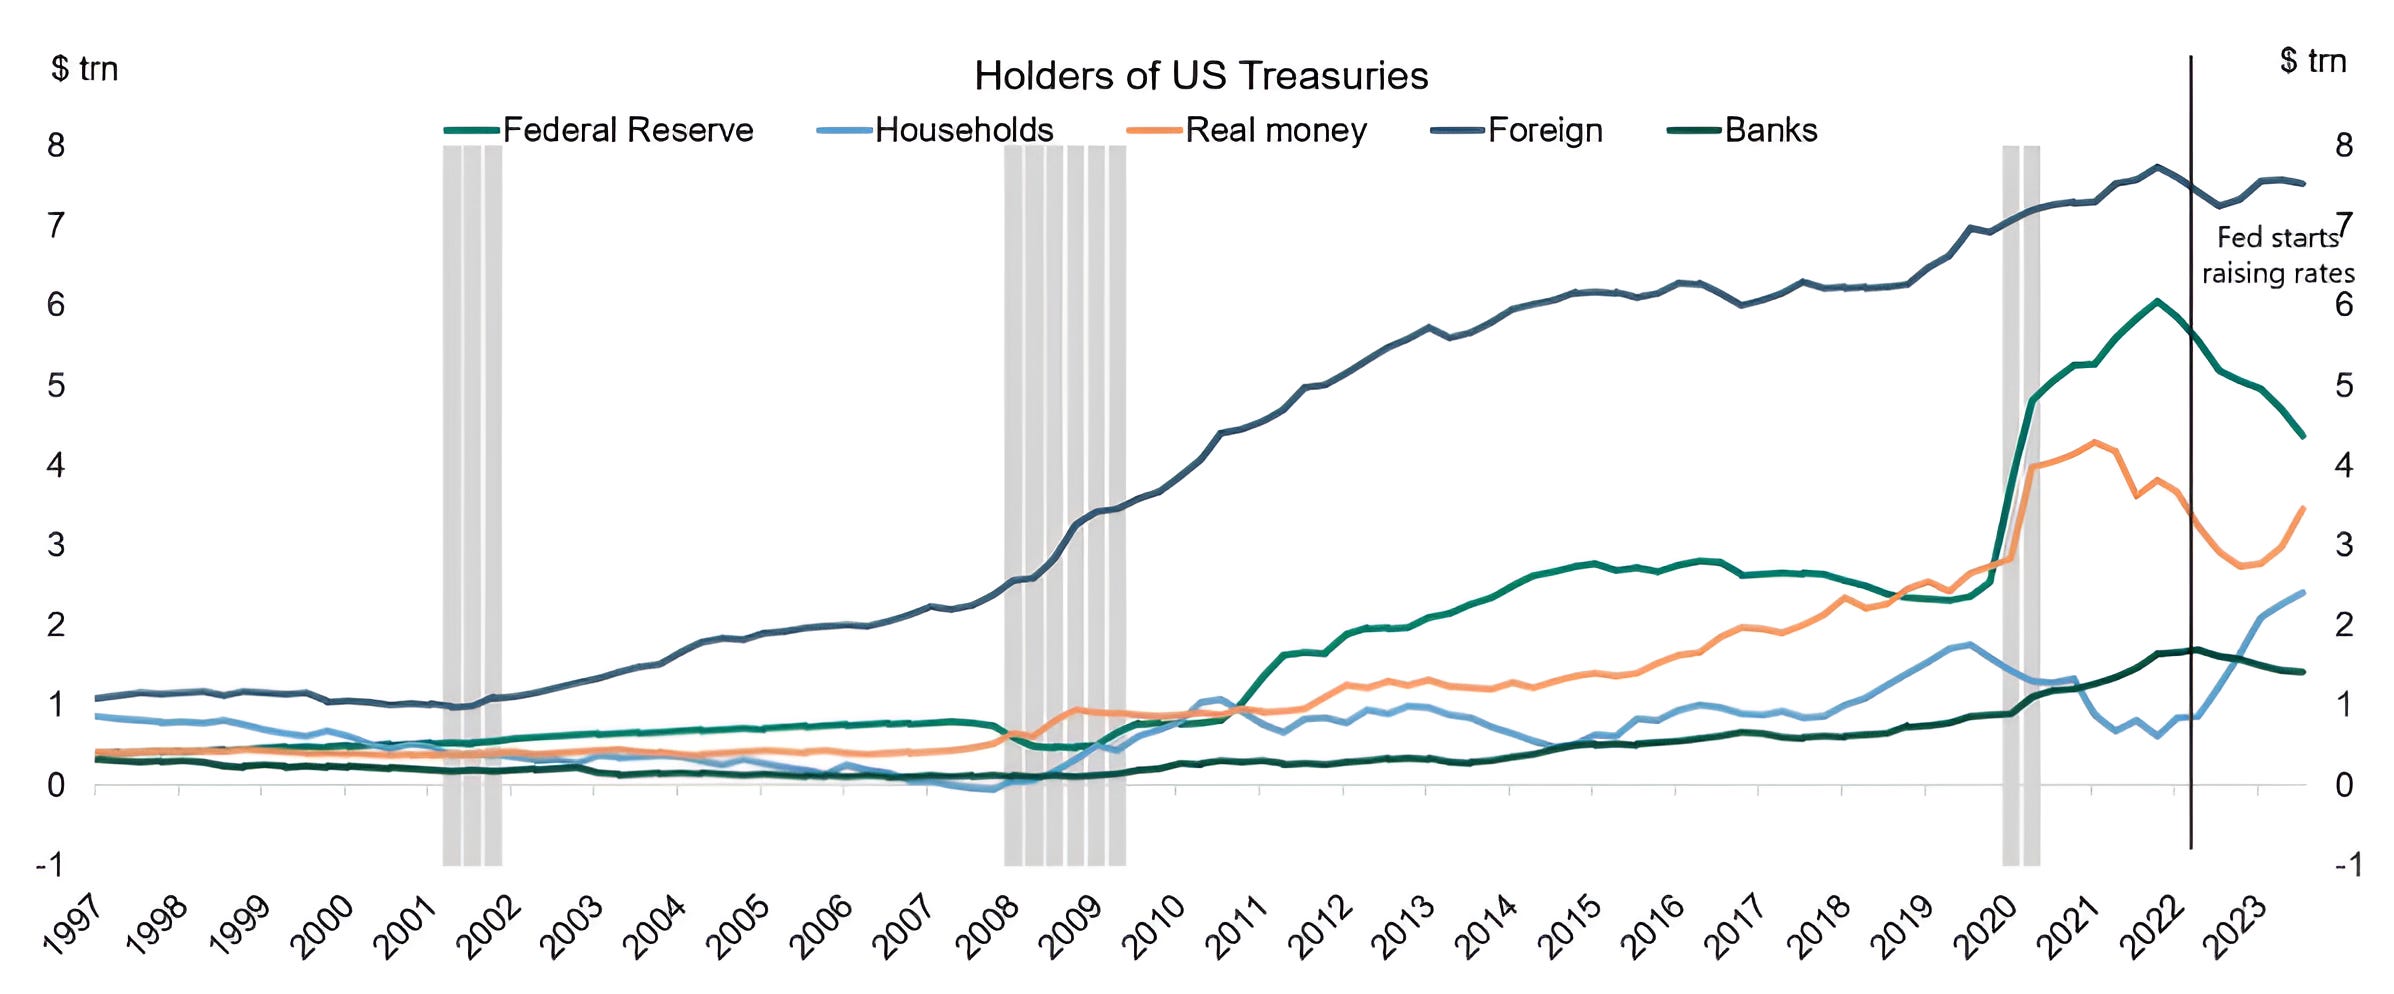
3. Who is Buying Treasuries?
As we regularly express our concern that 10-Year Treasury yields will confound the consensus by moving higher not lower (see chart 2 here), we found Torsten Sløk’s (former Deutsche Bank currently Apollo) chart this weekend interesting.
Since the Fed began raising rates and implementing Quantitative Tightening (QT), interest rate insensitive Sovereigns (China, Japan and the Fed) have been buying fewer Treasuries.
This hasn’t necessarily been causal (Fed tightening did not necessarily lead to lower sovereign Treasury purchases).
In the case of China, with US tariffs, the diversification and near-shoring of supply chains, and the economic slowdown, the Chinese government has had fewer dollars with which to buy Treasuries.
In the case of Japan, although the economy by many measures has been doing well, the Yen has weakened considerably. This has made buying Treasuries more expensive.
Who has been buying Treasuries?
US households. After 15 years of extremely low interest rates that provided little benefit other than “safety” to savers, 10-Year yields of 4%+ have been in high demand.
Similarly, pension funds and insurance companies so called “real money” needed these higher yields to match their future liabilities.
That said, this transition from sovereigns that are yield insensitive to households and real money that are yield sensitive may have implications for demand in the future.
As the US has $35 trillion in debt outstanding, a higher interest rate could begin to crowd out other spending priorities or require further borrowing.
It is important consider who and at what price (yield) will be buying all of the debt.
(This is not a recommendation to buy or sell any security).
Source: FFUNDS, Haver, Apollo Chief Economist. Through year-to-date 2024.
4. You Saw it Here First
When I graduated from business school 25 years ago and Alan “If I seem unduly clear to you, you must have misunderstood what I said” Greenspan was the Fed Chair, the one reliable translator for what was known as “Fed speak” was Greg Ip at the Wall Street Journal.
Greg, at the time, was the Fed whisperer.
When the Fed wanted to float an idea or “pre-announce” a policy, Greg Ip was the person to do so. Many joked that there was a direct line from the Fed to Greg.
When Greg left the Wall Street Journal to go to the Economist in 2008, I wondered if his special relationship with the Fed would move with him.
It did not.
Instead, it remained at the Wall Street Journal.
The new Greg Ip is Nick Timiraos.
As a result, many Fed watchers and prognosticators parse every word that Nick Timiraos (Nick T - to those on the sell side) writes or says.
(As an aside, I recently had the opportunity to see Nick T speak on the history of the Fed. On a topic that could have put you to sleep faster than propofol, Nick T was incredibly engaging, witty and informative).
In any event, when I woke up this morning and saw that Nick T was asking the question of whether the Fed has “hit the brakes hard enough,” it was affirmation that my headline from 2.5 weeks ago “Will the Fed’s Next Move be a Hike?” (here ) was not click bait.
In addition, when I wrote “What’s New Zealand Got to Do, Go to Do With It” (chart 3 here) 5 weeks ago, it wasn’t as crazy as it seemed at the time.
While we don’t know with certainty what the Fed will say at their meeting this week, we do know that the factors that are going into their decision making process are making their job more complicated.
We have argued (many times) that the current conditions (increasing inflation, stock market at all times highs, unemployment historically low) do not warrant a cut.
Furthermore, we believe that Fed moves and liquidity are critical for market support and direction.
If the Fed that is expected to ease instead considers keeping rates higher for longer or even a hike - that is meaningful for investors of all asset classes and it is why we highlighted before the concept had fully marinated.
To see our view considered in a headline from the Fed whisperer confirms that some of our suspicions were warranted and the idea likely deserves attention.
(This is not a investment advice and is not recommendation to buy or sell any security).

Source: Wall Street Journal. March 17, 2024.
5. Target Achieved
6 weeks ago, we wrote that we were looking for a possible bounce in Chinese Internet shares (chart 5 here).
At the time we wrote:
“We are not looking for the Chinese Internet shares to move out of their current range, but if they simply rally to the redline in the chart at $26.60 that would be a 14% move higher from yesterday’s close.”
$26.60 is the middle blue line on the chart below. Target achieved.
Clearly the $26.60 area has been a battleground in the past.
In our view, exceeding that level may require some work, however, we wouldn’t be surprised to see Chinese Internet shares continue to move higher.
We became negative on Chinese shares a few months after the Ant Financial IPO (scheduled for late October 2020) was cancelled.
At the time, we recognized the antagonistic stance that the Chinese government was taking with respect to its companies and entrepreneurs would concern investors.
While we are not sure the Chinese government will allow entrepreneurs to shine (taking the spotlight from Party officials) as they did in the past, we believe the government recognizes it needs some of the animal spirits that markets provide to the economy. (See George Soros on reflexivity here).
Combined with very attractive valuations, we believe, that Chinese internet shares, after a battle at current levels can move higher.
Our view is that if the Chinese Internet ETF can move back above $26.60 it is possible to move to $32 per share (the top horizontal blue line). This would represent 20% appreciation from current levels.
(This is not a investment advice and is not recommendation to buy or sell any security).
