


The Fundamental Things...
With earnings season almost complete and some softness showing up in the economy, we wanted to detail our outlook with a focus on corporate fundamentals. Let's dig in...
I had an interesting conversation with a close friend and reader last night.
This is a person who owns and operates several fast food restaurants.
He said that he is seeing softness in his market (low priced food) which in his mind is one of the most defensive areas of the economy. People need to eat. Lower-priced food is always popular and during difficult times as consumers “trade down.”
He said that he has noticed specials at Dominos, McDonalds and Burger King to bring prices lower. However, in his view, while they were all trying to boost (or at least maintain) sales, they were likely sacrificing margins.
Although we don’t want to over-extrapolate this anecdotal data, it is likely a sign of softness and could foreshadow disappointing future profitability.
My friend is a savvy equity investor and he concluded by saying, “I don’t trust this market and I haven’t been able to trust it for the past year.”
While I don’t fully disagree with him, what I have been trying to do in these notes is to explain why the market has rallied over the past year despite tighter and higher for longer Fed Funds; elevated 10-Year Yields; lackluster earnings growth; and above average PEs.
We have continued to focus on the two key pillars that have helped maintain this rally (in our view) despite these conditions:
Stealth Liquidity (see here, here, here, here, chart 4 here and here) - that has more than off-set the Fed tightening cycle has kept valuations elevated in our view and;
Earnings and Earnings Growth Expectations (whether its achievable or not) that has provided a context for fundamental strength which we discuss in detail below.
When we add to these the animal spirits of AI, the S&P 500 is up 10%+ in the first five months of the year.
Although our view isn’t reliant on past statistics and charts, we consistently show these as, in our view, history (despite not being indicative of future results) tends to “rhyme” in financial markets.
Why is that?
Investor psychology.
Furthermore, markets tend to “climb a wall of worry.”
In our view, the rally will continue for the next 3-9 months driven by technicals and seasonality and supported by stealth liquidity and the expectation of improving fundamentals.
While our S&P 500 target is 5500, it is possible in a blow-off top type scenario that the S&P 500 could move to 5600 or even 5800.
That said, we are beginning to see possible cracks in the foundation of the market’s ascent that, in our view, could become more apparent either late this year or in early 2025.
Although it’s a fools errand to try to develop a 6, 12 and 18-month road map for the equity market, we see the possibility (10-15% likelihood) of a 30% sell-off that see the S&P 500 bottom around 4000-4200 in 2025 from a peak of 5500-5800 in 2024.
I will try to provide context and details on some of those thoughts below and on going forward.
1. The S&P 500 Battling the March High, but, in General, Is Not Showing Much (if Any) Weakness

Source: TradingView. Through year-to-date 2024.
The S&P 500 - shown in the chart above - is not reflecting much weakness.
After the relentless 5-month 28% rally from October 2023 to March 2024, the S&P 500 had a 5% correction (right down to the 0.236 Fibonacci retracement level of the rally) and proceeded to make a new all time high two weeks ago.
Although we are not showing the moving averages on this chart, the S&P 500 remains above its 50- and 200-day moving averages which are measures that some use to define an up- or down-trend.
From a technical perspective, this remains a very healthy market.
If the S&P 500 were to drop below the March high, we would be watching the Fibonacci retracement levels of the April 19 to May 23 rally.
We might begin to become concerned if the sell-off from the May falls below the April 19 low around 5000.
Otherwise, we would view any small sell-off as establishing the initial stages of a higher-high, higher-low pattern and we would consider this a healthy pullback within an ongoing up move.
When we look for a potential price target based on the chart above, we would look at the 1.618 extension of the January to October 2022 sell-off which is around 5560.
As we always state, we do not rely solely on technicals (chart patterns) for market views or targets, but this level is somewhat consistent with our fundamental view of 5500 based on 20x 2025 earnings of $275 (slightly lower than current consensus).
(This is not a recommendation to buy or sell any security and is not investment advice. Please do your own research and due diligence).
2. The Key Remains Fundamentals (Part 1)

Source: FactSet. Through year-to-date 2024.
The chart above shows the evolution of the the “bottom-up” S&P 500 earnings (eps) expectations for 2024 (lower line) and 2025 (upper line).
As a reminder, the “bottom-up” S&P 500 earnings expectations track the analyst earnings per share expectations for every share in the S&P 500, weights those earnings by the respective company’s weight in the index and aggregates the results over time.
The takeaway from this chart is that not only have the S&P 500 “bottom-up” earnings expectations for 2024 and 2025 been relatively stable, they have recently been trending higher.
The current expectation is that 2024 S&P 500 earnings will be $245 and 2025 earnings will be $279 (+14%).
While we have our concerns that earnings growth expectations are becoming more demanding (14% earnings growth in 2025), thus far companies have been able to meet and exceed projections and re-confirm future guidance.
In 2000, it was not until September / October when companies began to miss earnings expectations that valuations re-rated and the market began to experience significant volatility.
While we would acknowledge that at 21x next 12 months earnings that the S&P 500 is trading at an above average forward valuation, as long as the fundamental outlook remains stable and there is little risk of monetary tightening, the multiple, despite being elevated, does not need to contract.
(This is not a recommendation to buy or sell any security and is not investment advice. Please do your own due diligence).
3. The Key Remains Fundamentals (Part 2)

Source: FactSet. Through year-to-date 2024.
The chart above shows the change in the S&P 500 quarterly earnings expectations in the first 2 months of the quarter.
As a reminder, during the first two months of the quarter, analysts are hearing from management teams on earnings calls and those management teams should (at least in theory) have a good read on the current quarter.
In 9 of the 11 past quarters, 2 months into the quarter, management teams have guided analysts to reduce expectations.
In other words, estimates have been too high.
Two months into the current quarter, analysts have raised guidance.
Presumably, management teams have confidence that they can surpass previous expectations.
While we obviously view this as a positive that is supporting the current market trend and valuation, as we show below, future expectations are about to become much more demanding.
(This is not a recommendation to buy or sell any security and is not investment advice. Please do your own due diligence).
4. Fundamental Challenges are Likely Coming (Part 1)
Source: FactSet. Through year-to-date 2024.
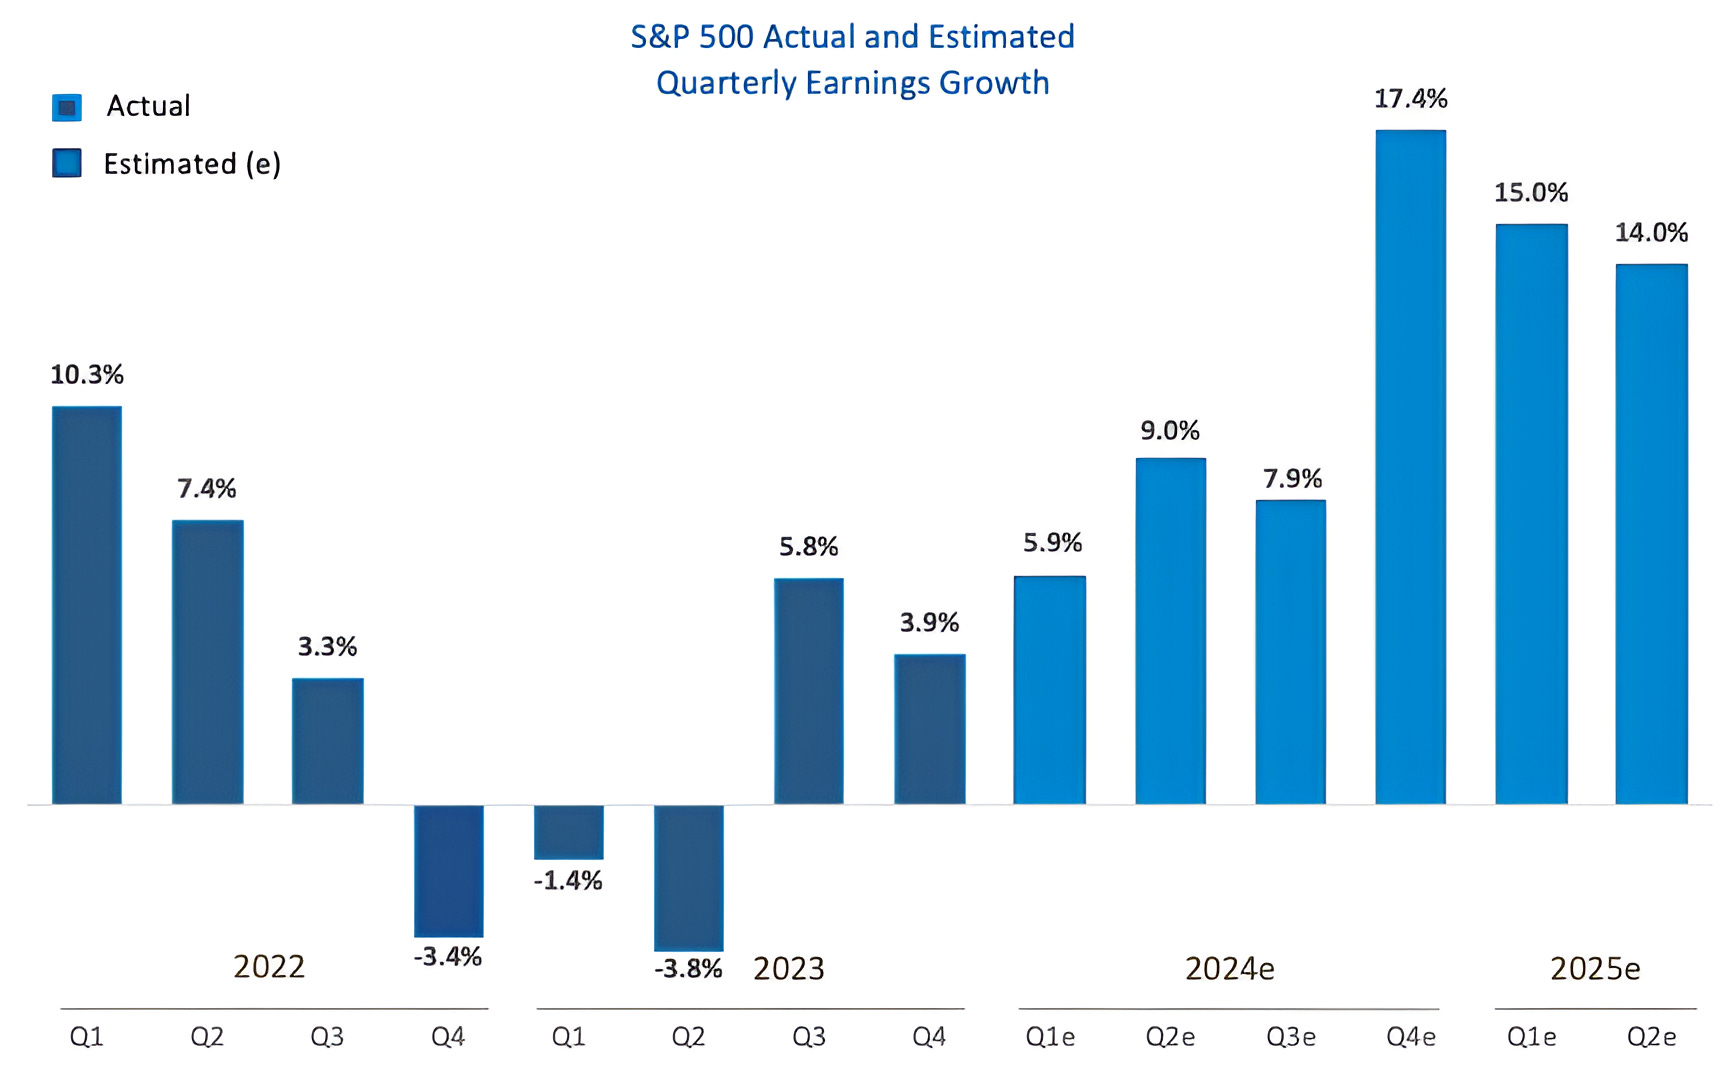
While Q1 S&P 500 earnings (the period that is currently being reported) are reflecting growth of 5.9% and Q2, which we remarked above has been guided higher, is showing 9.0% growth, both of these quarters are being compared to negative growth quarters in 2023.
Compared to Q1 and Q2 2022, Q1 and Q2 2023 earnings are expected to grow 4.4% and 4.8%, respectively.
While Q3 earnings are expected to grow 7.9% from 2023, vs. the same period in 2022, growth is expected to be 14%.
Normally, we wouldn’t show the trend in 2-year growth rates, but for 2-year earnings growth to go from 4.4% growth to 4.8% growth to 14% growth seems inconsistent.
Are corporate earnings suddenly going to accelerate and, if so, what is the catalyst?
While we obviously don’t know, the point is that by Q3 earnings expectations are beginning to become more demanding.
When we look at the final 3 quarters on the graph, Q4 2024, Q1 and Q2 2025 - we really begin to question the ability of companies to meet current expectations.
We have been writing recently that we see the “check coming due” in early 2025 if not sooner.
Demanding earnings expectations are a part of our explanation as to why.
The other part is that as we highlighted in “Do Do That Voodoo that You Do So Well” (here) - “policymakers [the Fed and Treasury] laid down a security blanket of liquidity into the 2024 election.”
Will stealth liquidity “run out” at some point in Q4?
While the Fed may be able to justify rate cuts by September, given recent US economic data, the transmission mechanism of rate cuts to the real economy is slow and the impact of monetary stimulus may be late.
Typically in Q4 of US Presidential election years, after the election, US equities rally as an unknown (who will become president) becomes a known.
This is one of the reasons that we have been considering a 2025 reckoning rather than a sell-off that begins in Q4 2024.
However, with questions about the integrity of the election, the election may be a cause for concern rather than relief.
(This is not a recommendation to buy or sell any security, please do your own research).
5. Fundamental Challenges are Likely Coming (Part 2)

Source: Goldman Sachs. Through year-to-date 2024.
We showed this chart from Goldman Sachs a week ago (here).
The chart shows the percent of S&P 500 companies citing “Expense Management” (dark blue) and “Pricing Power” (light blue) during their quarterly conference calls.
We have continued to think about this chart in the context of more questionable economic data (we will write about this on Thursday).
As we highlighted in the introduction, a number of fast food establishments have announced promotions, value meals and / or 2 for 1 specials.
This is a reflection of the lack of pricing power in the current environment.
When we showed this chart last week, we wrote “once all of the easy Expense Management tools have been exhausted, there is the potential for lay-offs.”
While it is impossible to time something like this, we could envision a more challenging employment scenario in the next 3 to 6 months.
Employment (or lack thereof) in our view is a critical indicator and characteristic of economic slowdowns.
The reason we always want to be sensitive to slowdown or recessionary possibilities is that those are the periods of the largest equity market drawdowns.
As we wrote in the introduction, we see the possibility (10-15%) of a significant drawdown beginning in the next 6-12 months, but see the likelihood of higher equity markets before then.
(This is not a investment advice and is not recommendation to buy or sell any security).