


Born to Run!
The markets have faced a number of challenges this year - any one of which could have de-railed the US equity ascent, but none has. In our view, liquidity has been the key driver. Let's dig in...
As we reflect on the third quarter that concluded last week, it is amazing to consider all that occurred:
The sitting US President dropped out of the election;
There were two assassination attempts on the opposition candidate;
The conflict in the Middle East intensified;
The Russia / Ukraine war continued;
The China slump dragged on;
US corporate earnings for the quarter were consistently re-rated downwards (see chart 2 here);
and yet the S&P 500 moved higher by 6% and did not experience a negative month.
The major off-set to the list above was monetary policy.
In our view, this ranged from the Fed cutting 50 basis points to the Chinese bazooka (see chart 5 here and chart 3 here) and, what we have continually referred to as stealth liquidity (see here, here, here, here, here, here, here, chart 4 here and here).
The only significant US equity volatility during the quarter, from mid-July to early August, seemed to have been caused by a sharp increase in the value of the Japanese Yen and an unwind of related leveraged trades (see our explanation of the Yen carry trade as a market driver here and before that here).
Can it continue?
While we would characterize the fundamental and valuation backdrop as challenging (see earnings in chart 2 here and here and valuation in chart 3 below), several of the historical analogs that we have shown (see chart 5 here or here) suggest that over the next year, US equities will continue to move higher.
We will continue to use a combination of macro-economic indicators, corporate earnings, charts and liquidity be our guide to market direction.
Our strategy has been and continues to be to remain invested and from time to time add puts and put spreads to our portfolios.

1. The S&P 500: Keeping its Head Above Water
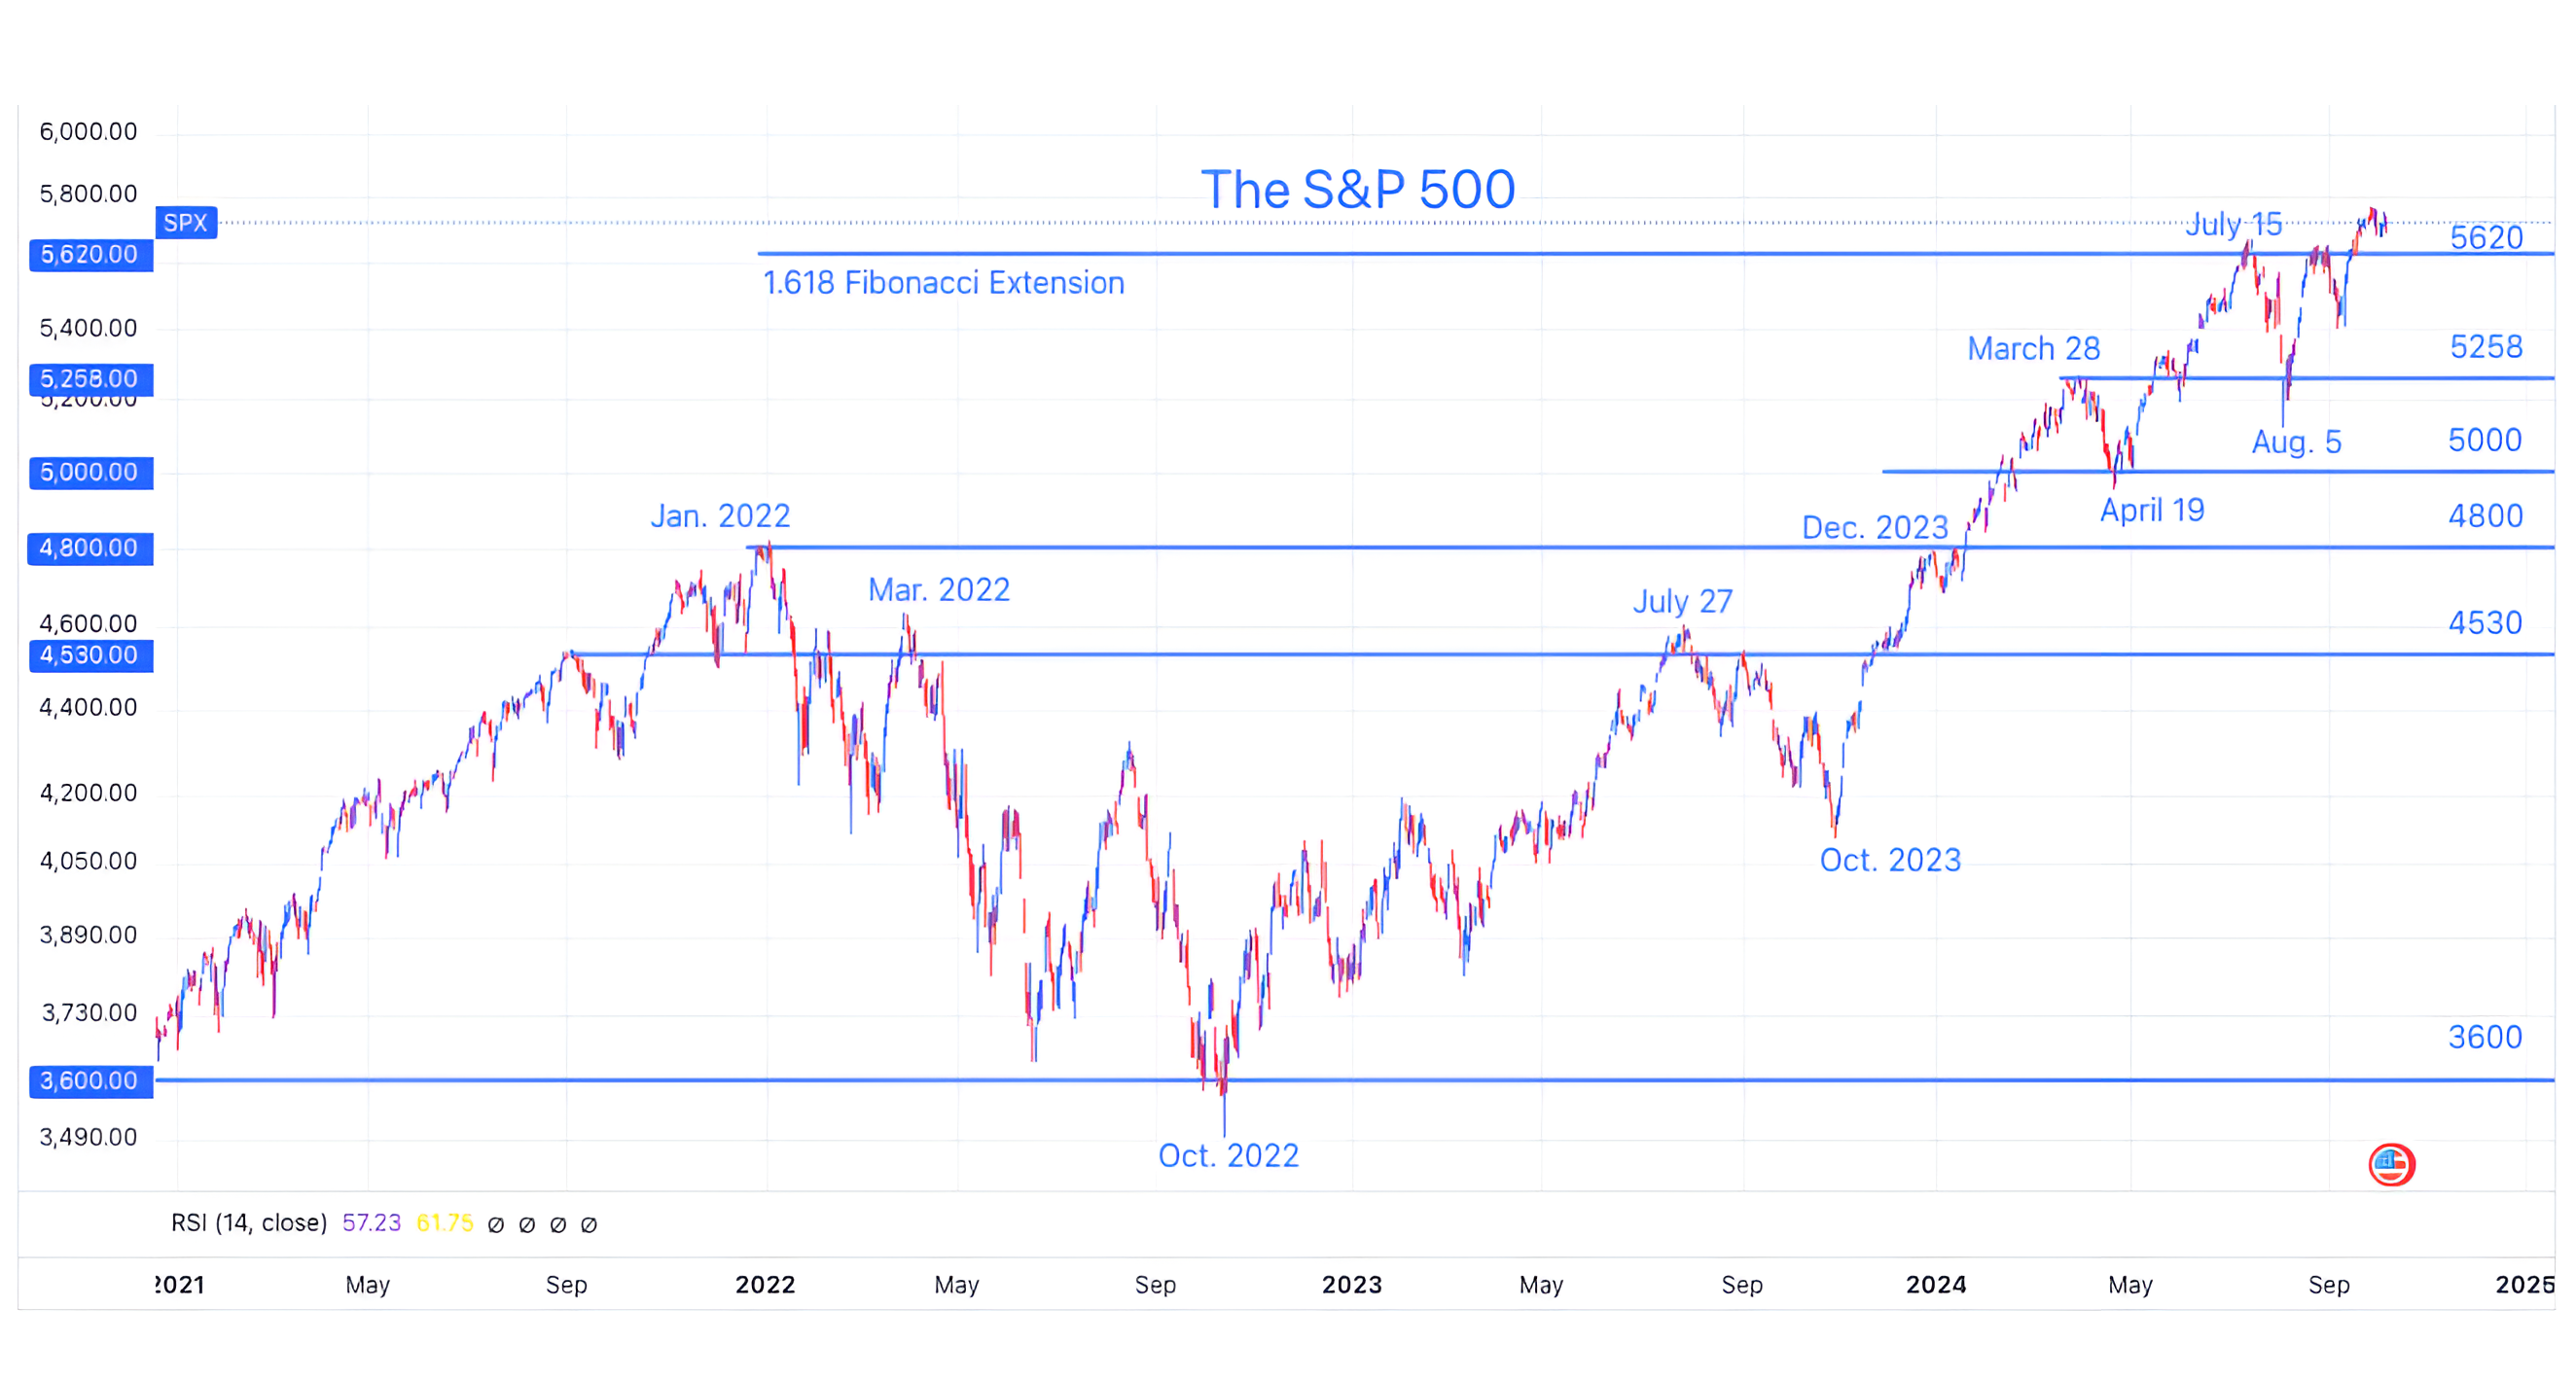
Source: Trading View. Through year-to-date 2024.
The chart above shows the S&P 500.
When we showed the chart a week ago (here), we were expecting the index to revisit the 5620 level (the top horizontal blue line).
However, rather than move up or down, the Index has moved sideways over the past two weeks.
I always think about sideways moves in two different ways:
Indecision. Investors view the price as a level that represents fair value given the available information. As price moves sideways, investors are awaiting the next catalyst - either to move higher or lower.
Refueling. After two attempts to break through the 5620 level, in mid-September, the S&P 500 finally captured the north. Having expended the buying energy, the Index is now paused. Buyers and sellers are trading shares - some taking gains while others capitulating by investing at levels that they swore not to. As “weak hands” (those investors with lower levels of conviction) are absorbed, the market may be setting up for its next up leg.
Either way, despite: 1) an employment number last Friday that has led the bond market to price out at least one Fed rate cut; 2) higher 10-year yields; 3) elevated valuations (see chart 3); 4) questionable earnings (earnings season begins on Friday); 5) heightened conflict in the Middle East - leading to higher oil prices; and 6) a contentious US Presidential election, US equities remain strong and resilient.
If there is no re-test of or a move down to the 5620 level, the next stop in our view is 6000 (explanation in chart 2, below).
(This is not a recommendation to buy or sell any security and is not investment advice. Past performance is not indicative of future results. Please do your own research and due diligence).
2. Goldman Increased Its S&P 500 Price Target to 6300
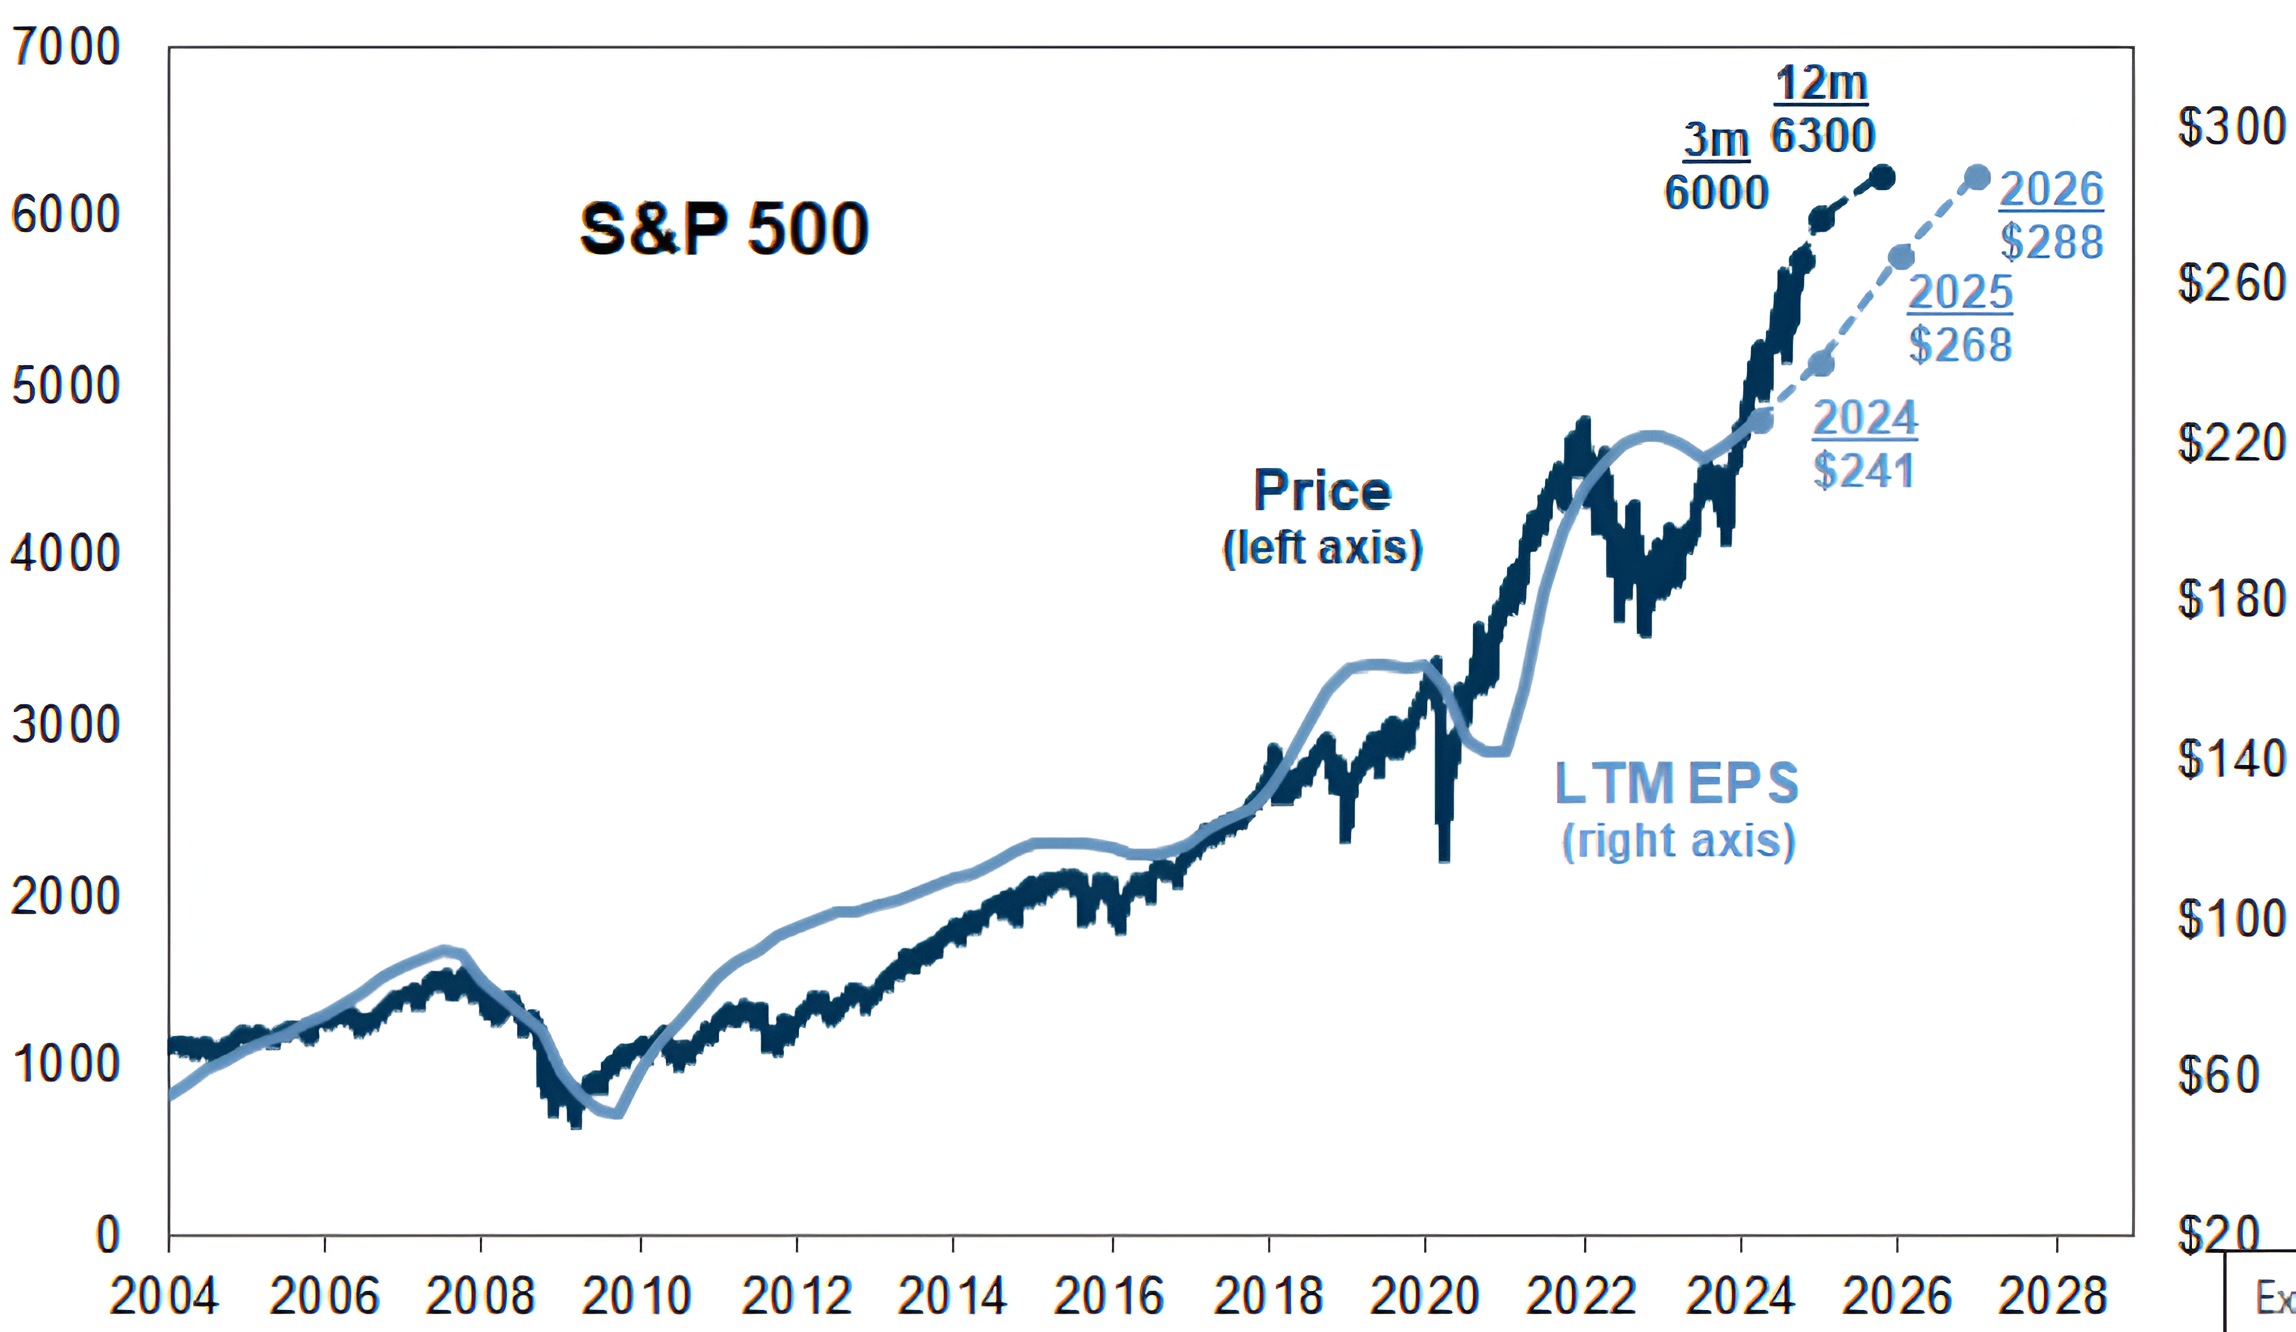
Source: Goldman Sachs. Through year-to-date 2024.
The chart above from Goldman Sachs shows the firms expected path of the S&P 500 (dark blue) and S&P 500 Earnings (light blue).
Goldman Sachs is expecting the S&P 500 to reach 6000 in the next 3 months (+4.5%) and 6300 (+9.7%) over the next 12 months.
The upside, in their view, will be driven by earnings as the firm sees earnings growing 11% to $268 in 2025 and 7.5% to $288 in 2026.
If the firm is correct, a year from now, the S&P 500 will be trading 21.9x 2026 expected earnings.
While several of our historical analogs and our charts (see chart 1, above) are consistent with Goldman’s view, we continue to question 2025 earnings estimates (see chart 2 here) and the premium valuation (see chart 3, below) of the Index.
Although we continue to view estimates of 2025 S&P 500 earnings as too high, we acknowledge that it may not matter.
As we wrote in chart 1 here “In a soft landing scenario, analysts will begin looking at 2026 S&P 500 earnings of at least $300-310 (regardless of whether 2025 earnings are achievable).
With a 20x forward PE, it is possible to see 6000-6200 (6-10%) as achievable (600-620 on the ETF).”
In other words, we believe the consensus consider higher 2026 earnings than Goldman has and earnings disappointment during 2025 could be disregarded.
(Past performance is not indicative of further results. This is not a recommendation to buy or sell any security and is not investment advice. Please do your own due diligence).
3. Valuation

Source: Goldman Sachs Investment Research. Through June 2024.
The chart above shows the forward PE multiple of the S&P 500 (light blue line) and the Equal Weight S&P 500 (dark blue line).
This chart only goes through June I’ve shown it before (here), however, there are some critical reasons that I wanted to show it again:
The current forward PE of the S&P 500 is 22.3x. In other words, since June, the valuation of the S&P 500 has increased (become more demanding).
Considering Goldman’s view highlighted in chart 2 that the S&P 500 will trade at 21.9x 2026 forward earnings a year from now, we find it notable that in the two other instances of elevated S&P 500 forward PEs over the past 25 years, they have only remained 21x for eight to ten months. The S&P 500 is now in month 4 of 21x+ forward PE.
In the past, when there has been a large difference between the PE of the Equal Weight S&P 500 and the (traditional) S&P 500, the chasm has closed as a result of the valuation of the traditional S&P 500 moving down, not the valuation of the Equal Weight S&P 500 moving higher.
As we wrote here:
“While we still believe that a post-election rally (regardless of who wins) is likely, as we wrote at the beginning of June (here):
We see the possibility (10-15% likelihood) of a 30% sell-off that would see the S&P 500 bottom around 4000-4200 in 2025 from a peak of 5500-5800 in 2024.”
We noted here, that, in our view, the likelihood of a significant sell-off had increased to 20-30%.
Despite our view of a heightened possibility of a sell-off, given what seems to be conflicting data, we have remained invested. From time to time, we have added puts and put spreads to our portfolios and watched the charts for clues that might indicate that a significant sell-off is upon us.
Clearly, as we highlighted in chart 1, those clues are not currently present.
(Past performance is not indicative of future results. This is not a recommendation to buy or sell any security and is not investment advice. Please do your own due diligence).
4. The Jobs Report

Source: MUFG US Macro Strategy. September 2024.
By most accounts, last Friday’s employment report was a strong one: US non-farm payrolls rose by 254,000 in September; the unemployment rate dropped to 4.1%; and revisions to July and August payrolls were +72,000.
There were headlines such as “No Landing” (as opposed to a soft landing) and recessionary fears seemed to evaporate.
The market’s immediate reaction was to begin to reduce expectations for future Fed rate cuts.
Prior to the employment report, it was expected that the Fed would cut another 0.50% at its next meeting in early November. The expectation is now for a 0.25% cut with a possibility of no cut priced in.
Despite all of the excitement around the number, in the deep recesses of X (formerly Twitter) where conspiracy theories thrive, there were questions about the quality of the employment number.
The first question was about the type of jobs created. Many people commented that all of the job gains were government jobs.
While government employment pays and keep consumers afloat similar to private sector jobs, government jobs are not necessarily considered a reflection of economic strength like private sector jobs are.
Furthermore, as reflected in the chart above, there were concerns about the “seasonal adjustment” used in September’s employment number.
When the US government releases data, it is generally seasonally adjusted.
The adjustment is intended to remove seasonal fluctuations. Within employment data, periods like summer or Christmas can experience significant job gains that make comparing those periods to the periods right before or after meaningless.
Somehow the seasonal adjustment for the September non-farm payrolls (as can be seen in the chart above) was considerably different from the September seasonal adjustment of the past two years.
If the seasonal adjustment factor from September 2023 had been used (which was similar to that of September 2022, the non-farm payrolls figure for September 2024 would have been much more moderate.
A September 2023 seasonal adjustment factor on the 2024 employment data, might have changed some views on the strength of the economy and encouraged a larger ease in the Fed’s upcoming decision.
Finally, in any payroll number, there is a “birth-death” adjustment.
The birth-death adjustment accounts for the impact of new businesses opening ("births") and existing businesses closing ("deaths") on overall employment figures, and is applied to the data before seasonal adjustment takes place.
The birth-death adjustments during 2024 have been consistent with those from 2023.
(Past performance is not indicative of future results. This is not a recommendation to buy or sell any security and is not investment advice. Please do your own due diligence).
5. Something Different…
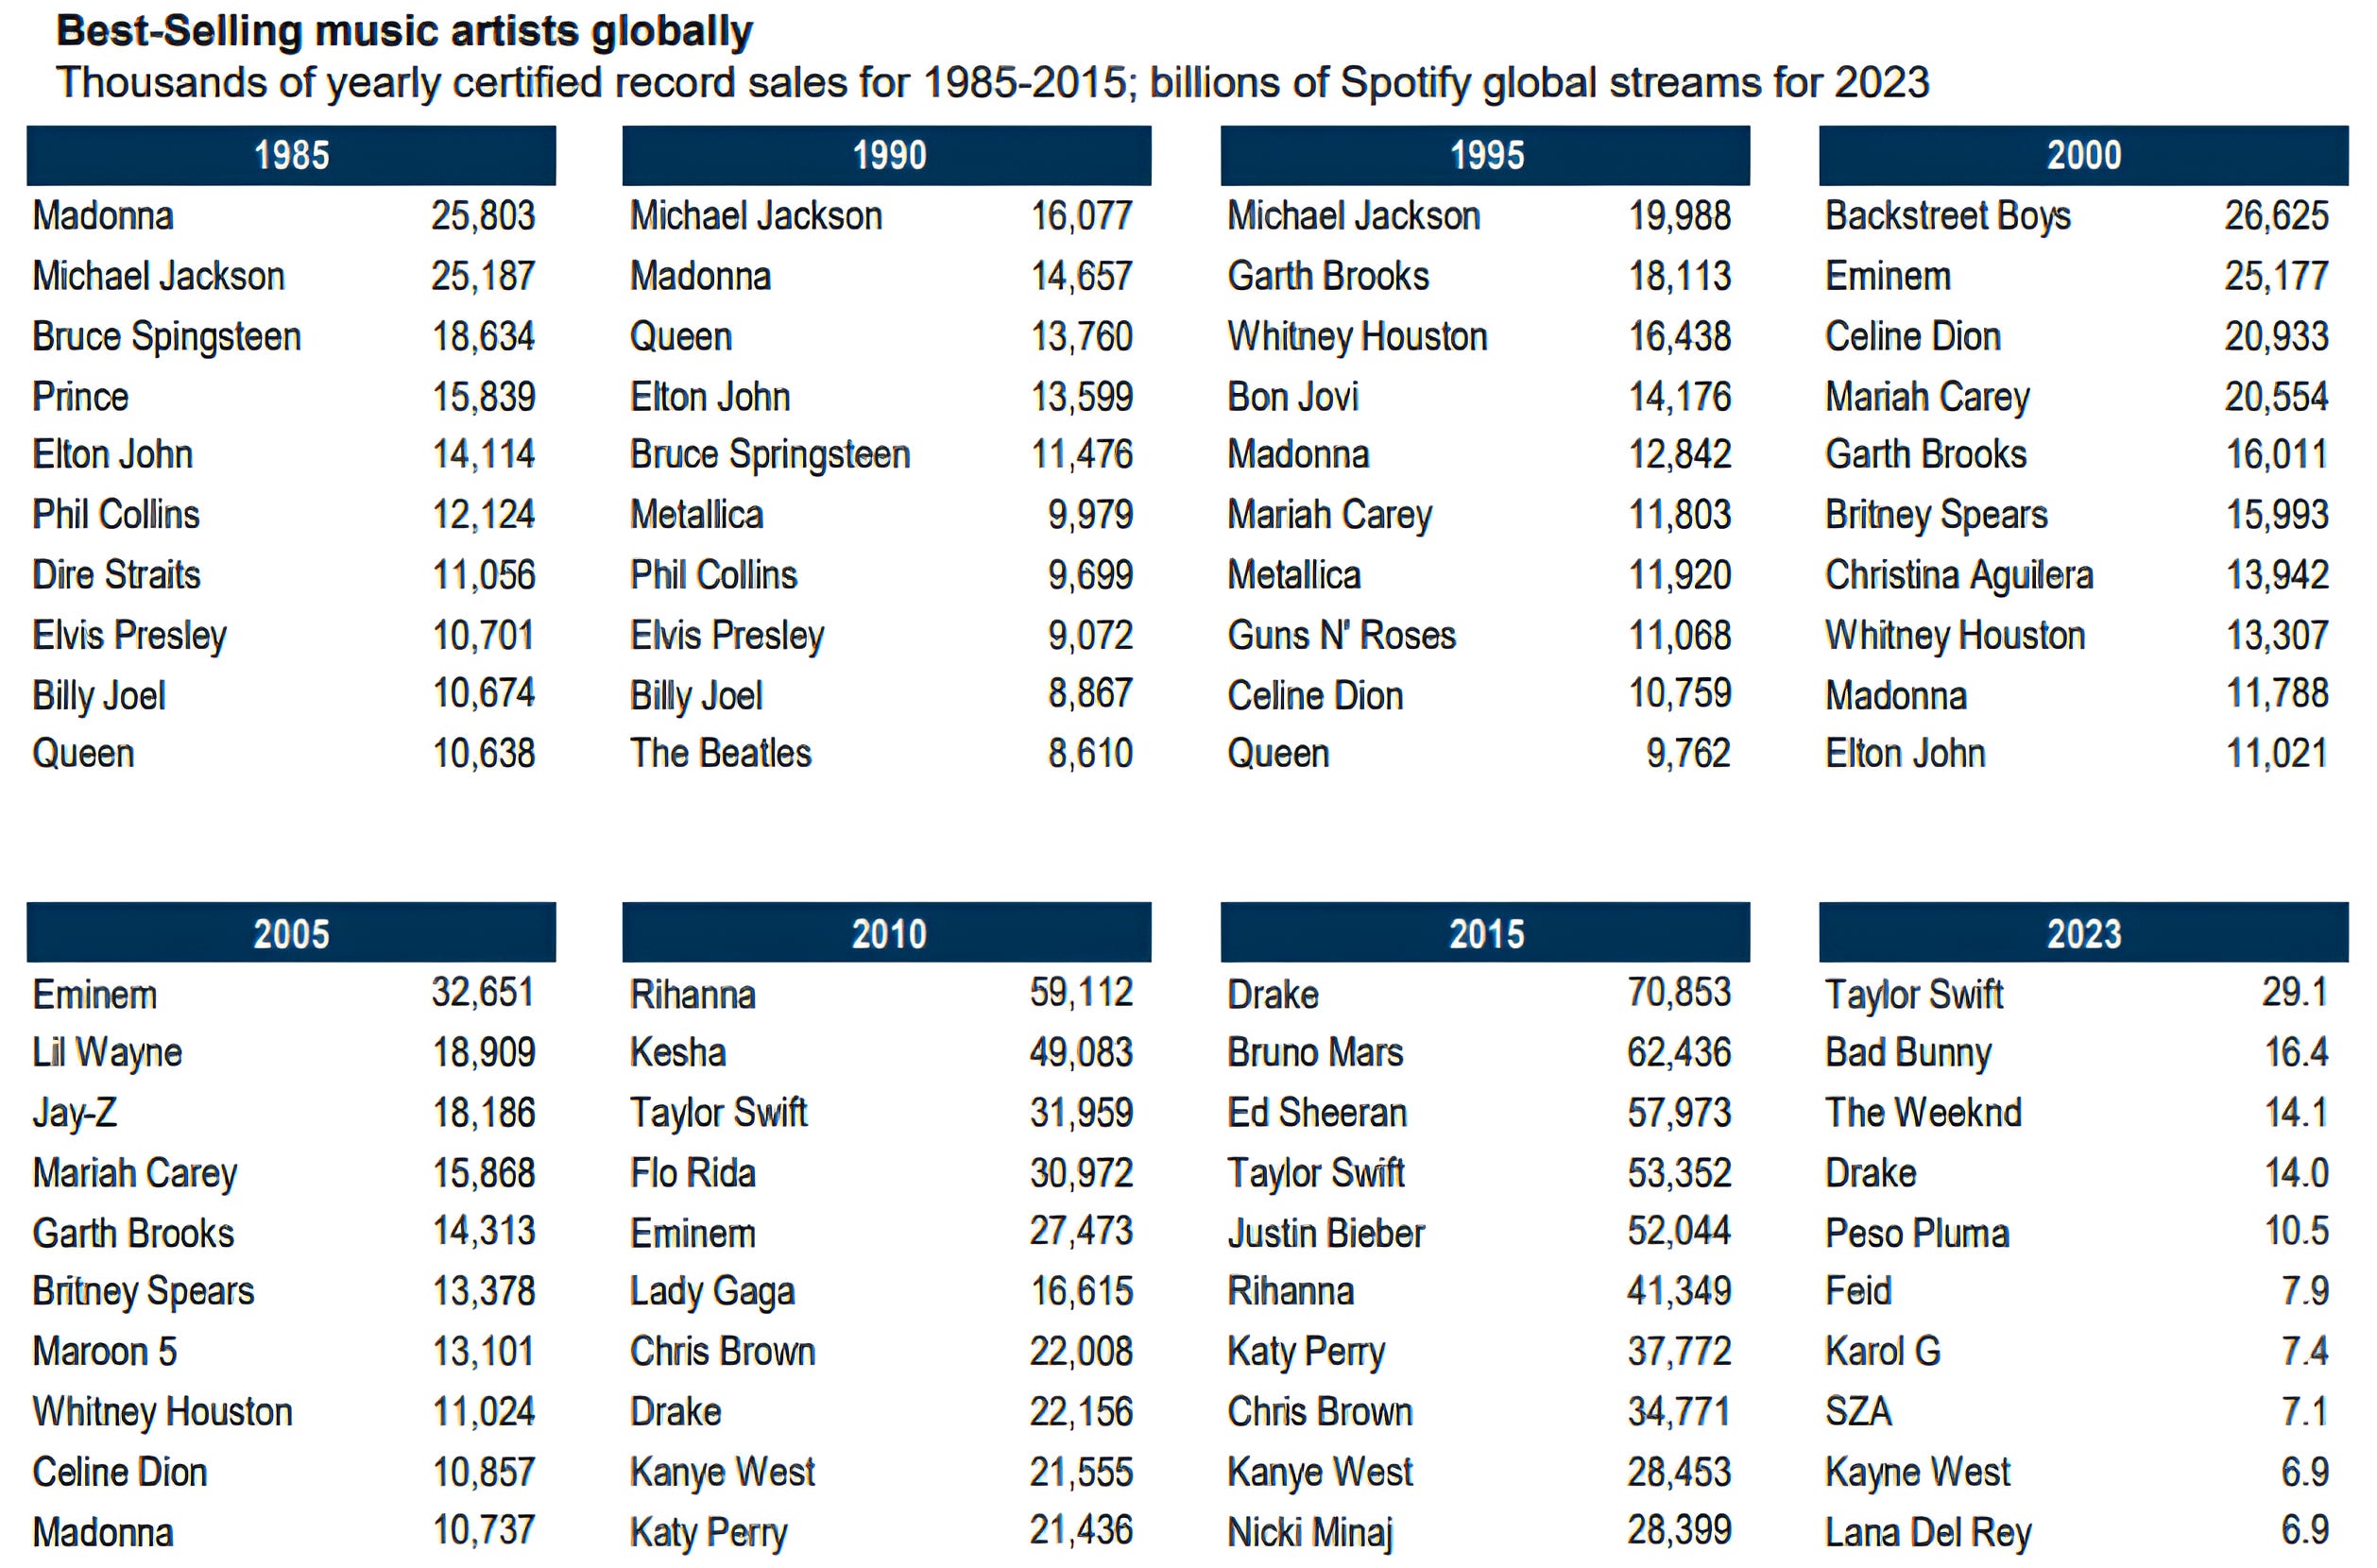
Source: Goldman Sachs. Through year-to-date 2024.
The chart above shows the best selling music artists globally during different years.
Today’s title was from the third best selling artist in 1985 and the fifth best selling artist of 1990 (Bruce Springsteen), however, the song (and album of the same name) was from 1975.
(Past performance is not indicative of future results. This is not a recommendation to buy or sell any security, please do your own research).